
Volume 13 Issue 3 *Corresponding author juciano@ippur.ufrj.br Submitted 27 may 2025 Accepted 14 jul 2025 Published 24 jul 2025 Citation RODRIGUES, J. M. Daily mobility by taxi in the city of Rio de Janeiro: exploring the spatiotemporal pattern of trips on the TAXI.RIO application. Coleção Estudos Cariocas, v. 13, n. 3, 2025.
DOI: 10.71256/19847203.13.3.146.2025 The article was originally submitted in PORTUGUESE. Translations into other languages were reviewed and validated by the authors and the editorial team. Nevertheless, for the most accurate representation of the subject matter, readers are encouraged to consult the article in its original language.


| Daily mobility by taxi in the city of Rio de Janeiro: exploring the spatiotemporal pattern of trips on the TAXI.RIO application Mobilidade cotidiana por táxi na Cidade do Rio de Janeiro: explorando o padrão espaço-temporal das viagens no aplicativo TAXI.RIO Movilidad cotidiana en taxi en la ciudad de Río de Janeiro: explorando el patrón espacio-temporal de los viajes en la aplicación TAXI.RIO Juciano Martins Rodrigues¹ 1Universidade Federal do Rio de Janeiro, Rua Antônio Barros de Castro, 119, Cidade Universitária, Rio de Janeiro/RJ, Brasil CEP: 21941-853, https://orcid.org/0000-0001-5187-0899, e-mail: juciano@ippur.ufrj.br
AbstractThe taxi service plays a fundamental role in the urban mobility system of the city of Rio de Janeiro. This study uses data from trip records requested through the TAXI.RIO app to analyze the spatial distribution of pick-ups and drop-offs over the course of a week. The goal is to examine daily mobility by taxi by identifying the main origins and destinations, outlining the primary travel flows between different parts of the city, and mapping spatial clustering trends. The analysis also reveals a temporal pattern related to the city's economic dynamics. Keywords: mobility, taxi, app, TAXI.RIO. ResumoO serviço de táxis desempenha papel fundamental no sistema de mobilidade urbana da cidade do Rio de Janeiro. Este estudo usa dados dos registros de viagens solicitados através do aplicativo TAXI.RIO para analisar a distribuição espacial dos embarques e desembarques ao longo de uma semana. O objetivo é analisar a mobilidade cotidiana por táxi a partir da identificação das principais origens e destinos, traçar os principais fluxos de viagens entre partes da cidade e mapear as tendências de aglomeração espacial. A análise revela também um padrão temporal relacionado à dinâmica econômica da cidade. Palavras-chave: mobilidade, táxi, app, TAXI.RIO. ResumenEl servicio de taxis desempeña un papel fundamental en el sistema de movilidad urbana de la ciudad de Río de Janeiro. Este estudio utiliza datos de los registros de viajes solicitados a través de la aplicación TAXI.RIO para analizar la distribución espacial de los embarques y desembarques a lo largo de una semana. El objetivo es analizar la movilidad cotidiana en taxi a partir de la identificación de los principales orígenes y destinos, trazar los principales flujos de viajes entre diferentes partes de la ciudad y mapear las tendencias de aglomeración espacial. El análisis también revela un patrón temporal relacionado con la dinámica económica de la ciudad. Palavras-chave: mobilidade, táxi, app, TAXI.RIO. |
Introduction
The city of Rio de Janeiro has approximately 6.2 million inhabitants, spread across a territory of 1,200.329 square kilometers. It is the main municipality and core of a metropolis of 12 million people (IBGE, 2022). Its transportation system is structured around collective services offered through bus lines (both BRT and conventional), three subway lines, and a system of metropolitan trains. These services account for a large portion of trips and are complemented by a Light Rail Vehicle (LRV) system operating in a limited part of the central area, a bike-sharing system, a tourist tram line, and vehicles from the so-called alternative transport sector (vans, Kombis, and motorcycle taxis).
Also functioning as a complementary service, individually hired public transportation through taxis plays a fundamental role in the urban mobility system. More than just a transportation option for residents and tourists, it enjoys wide social acceptance and use. Traditionally painted yellow and blue, taxis in the city of Rio de Janeiro are part of the urban landscape and hold a significant place in the city’s culture and history[1].
The taxi market in the city is structured similarly to other places, with three characteristic service segments prevailing, mapped by the OECD (2007) and highlighted by Binenbojm (2016): (1) the taxi stand segment, known in the literature as taxi rank; (2) the street-hailing segment, referred to as hailing; and (3) the pre-booked door-to-door trip segment, frequently mentioned in the international literature as pre-booking, taxi-booking, or phone booking. In this last category, the passenger can track the vehicle’s movement and pay for the ride using a credit card, similar to the conveniences found in app-based ride-hailing services, which now dominate the individual transport market.
As in other parts of the world, app-based services quickly became popular, reshaping the individual transport market in the city of Rio de Janeiro and its metropolitan region. In addition to widespread public adoption, the entry of app-based platforms into the market, and their disruptive nature, challenged the regulatory rationale of individual transport services, which until then had been monopolized by taxis (Binenbojm, 2016). This has required the public authorities to develop governance and regulatory solutions to balance the interests of app drivers, professional taxi drivers, and, to some extent, the needs and preferences of the general public.
The development of the TAXI.RIO app by the City of Rio de Janeiro fits within this type of solution and is part of a broader context of institutional changes. In this scenario, public authorities have been compelled to address governance-related challenges in the transport sector, especially attempts to regulate remunerated individual transport apps.[2]
Thus, TAXI.RIO, as a facilitator of taxi trips, plays an important role in the transportation system and the management of urban mobility in the city. First, because it created conditions for the traditional taxi service, regulated by the municipal authority, to continue operating under real competitive circumstances while safeguarding acquired rights. Second, although there is broad consensus on the need to prioritize public transport and active modes (walking and cycling), there is no doubt that taxis, as a form of individually hired public transport, offer advantages over travel based on privately owned individual vehicles. This mode of transportation offers, among other benefits, convenience, comfort, and a sense of safety. At the same time, since taxis can be used by several people throughout the day, they generate more favorable collective outcomes compared to private vehicle use, contributing to reduced traffic, pollution, and environmental impact.
Beyond its importance for transport planning and management, the study of trips carried out through the TAXI.RIO service is supported by the methodological potential of analyzing individualized travel data, which are increasingly available and accessible in academic and corporate contexts. Moreover, the spatiotemporal analysis of these trips serves as a timely starting point to fill knowledge gaps about taxi mobility. To some extent, this analysis can also contribute to a better understanding of key components of everyday mobility, which is expressed through the diverse and complex interactions between places of residence, work, leisure, and other daily activities.
Therefore, also motivated by the specific opportunity to better understand the role of taxis in the urban mobility system of the city of Rio de Janeiro, this study’s main objective is to explore the spatiotemporal pattern of trips requested through the TAXI.RIO app. To this end, the temporal and spatial distribution of pick-up and drop-off points for trips taken during a reference week (March 1, 2020 to March 7, 2020) is analyzed. It is considered that the choice of this specific subset does not compromise the analysis, since taxi trips tend to follow weekly patterns, a fact already demonstrated in studies with similar purposes (Qian and Ukkusuri, 2015).
With geolocated information for each point of origin and destination, the study seeks to understand travel behavior through the mapping of flows across different parts of the city, more specifically, among the five planning areas (the official division used for public planning by the municipal government) and among the 199 spatial units used for disseminating census results. Additionally, as part of the study, visualizations were produced by aggregating the data into a grid of hexagons commonly used in transportation policy research (11,916 in total). This scale of representation allows for a more detailed visualization of the origin and destination locations and their potential relationship to the city’s sociospatial configuration (distribution of population, per capita income, and employment). Finally, the study includes the calculation of a spatial autocorrelation index to detect trends in the clustering of pick-ups and drop-offs in the spatial units throughout the day.
It is worth noting that these data refer to a period prior to the COVID-19 pandemic, officially declared by the World Health Organization (WHO) on March 11, 2020. Despite the time lag relative to the present date, the choice of this reference week is justified primarily by the unprecedented opportunity to provide insights into taxi mobility in the city of Rio de Janeiro. Although it is clear that these data cannot reflect the current dynamics, the record from that period serves as a baseline for future comparisons, including the potential impacts of the pandemic on travel patterns for this mode of transportation. Lastly, it is important to note that this time frame was chosen based on the quality of the data provided by the City of Rio de Janeiro, particularly in terms of completeness and comprehensiveness of the information.
In addition to this introduction and the conclusion, the article is structured into three sections. The first presents an overview of research on taxi mobility and its spatiotemporal patterns through a brief literature review. The second provides a description of the methodology and the data used in the study. The third presents the results of the analysis focused on the spatial and temporal distribution of taxi trips.
Overview of Research on Taxi Mobility and Its Spatiotemporal Patterns
With the spread and relative popularization of technologies that enable the recording and sharing of data on location and spatial trajectories, the possibilities for studying human mobility in different contexts have expanded (González et al., 2008; Veloso et al., 2011). The most well-known example of this type of technology is GPS (Global Positioning System), which is now present in a variety of personal and corporate devices. The adoption of these technologies and the recording of large volumes of data, with broad coverage, good continuity, and low collection costs (Tang et al., 2017), have radically transformed transportation management and planning, including the monitoring and projection of traffic intervention scenarios.
The spread of this technology has also brought studies on travel patterns and their relationship to urban structure to the forefront of urban mobility research (Liu et al., 2015). The increased availability of spatially referenced trip records has enabled a growing number of studies on taxi mobility (Veloso et al., 2011; Peng et al., 2012; Liu et al., 2015; Mao et al., 2015; Zhang, 2015; Qian and Ukkusuri, 2015; Bischoff et al., 2015; Kumar et al., 2016; Hochmair, 2016; Tang et al., 2017; Zhang, 2018; Yang, 2018; Liu, 2020; Wang et al., 2023; Wang et al., 2024) and other modes of transportation (Braga et al., 2020; Arias-Molinares et al., 2021). This type of data contains precise spatiotemporal properties within the urban space, providing a solid foundation for reflecting on relevant aspects of the structure and functioning of cities (Liu et al., 2015) and, consequently, on the daily mobility of the population.
Daily mobility, in this context, refers to people’s routine movements between their homes and other spaces where everyday life unfolds and is reproduced (places of work, study, leisure, healthcare, consumption, social encounters, etc.) (Legroux, 2021). In this article, daily mobility is thus considered synonymous with physical displacement, specifically regarding taxi trips requested via the TAXI.RIO app.
In the Brazilian context, studies on daily taxi mobility, and particularly on the spatiotemporal pattern of such trips, are scarce. The few available works on this mode of transportation address aspects related to service operation, such as methods or considerations regarding fare calculation (Dias, 2009; Oliveira, 2009; Gonçalves and Kneib, 2009), performance and efficiency (Drumond, 2017), monitoring (Galvão and Almeida, 2009), business models (Hino et al., 2018), and service reorganization and restructuring (Gonçalves et al., 2011; Monteiro et al., 2016). Additionally, there are studies that address specific issues and variations of taxi services that are less applicable in other contexts. For instance, Brasileiro and Xavier (1996) investigated the operation and characteristics of taxi services without meters in the city of Ilha Solteira-SP. Estolano et al. (2009) examined the implementation of a prepaid taxi service for City Tour-style tourist routes in Recife-PE.
Given the growing use of on-demand taxi services and the increased availability of data from embedded GPS systems, it is reasonable to expect a significant rise in studies that can fill the gaps in taxi mobility research in Brazil. Even in countries where this technology is more widespread, the number of studies in this area remains limited, highlighting the existence of a research agenda still under development.
Most existing studies do not delve deeply into the specific investigation of the spatiotemporal patterns of taxi trips, instead focusing on data processing methods, mathematical modeling, or evaluations of operational efficiency and individual driver performance (Tang et al., 2017). Nonetheless, the available studies offer valuable insights into taxi travel behavior and reveal recurring patterns in different cities. For example, a study conducted in Singapore by Kumar et al. (2016), using a clustering method for pick-up and drop-off points, identified a predominant pattern of trips heading to the city’s central business district. In a study on taxi trip trajectories in Shanghai, Liu et al. (2012) found two distinct patterns. First, they observed a consistent temporal regularity, with most trips occurring on weekdays. Second, they identified stable spatiotemporal patterns, indicating that certain locations are highly likely to serve as both origin and destination throughout the day.
In another study also conducted in Shanghai, Liu et al. (2015) discovered a regular structure in which short-distance spatial interactions prevail, revealing a demand strongly linked to daily mobility. In a broader study that analyzed factors influencing urban taxi demand, such as income and education variables, Qian and Ukkusuri (2015) demonstrated that areas with higher employment levels, especially in Manhattan, are the most popular destinations for taxi trips in New York City. Using data from Washington, D.C., Yang et al. (2018) investigated taxi demand and found that the occurrence of pick-ups is strongly related to residential and employment density. Bischoff et al. (2015), in turn, studied taxi trips in Berlin over two specific weeks in 2013 and 2014, observing peak demand in the mornings on weekdays and at night on weekends. In terms of spatial patterns, although Tegel Airport stood out as a major origin and destination, they identified that most trips occurred within the city center. It is worth noting that, unlike other studies, these authors found evidence of a correlation between taxi demand and disruptions in public transportation.
Tang et al. (2017) analyzed the individual behavior of high-performing drivers in Wuhan (China), based on the proportion of time their taxis were occupied. Regarding spatial patterns, the authors concluded that these drivers, compared to less efficient ones, concentrated their trips in commercial zones and key urban transportation hubs. Moreover, they were better able to identify operational areas with favorable traffic conditions and high passenger demand at different times, both on weekdays and weekends.
In a study on Qingdao (China), Liu et al. (2020) found results similar to those in other works, indicating that peak hours show some differences in taxi trip demand between weekdays and weekends, and that residential density and housing prices tend to favor an increase in taxi trip frequency. Giraldo-Forero et al. (2019), although focusing on mathematical modeling, explored taxi trips in Manizales, Colombia, and similarly concluded that demand peaks coincide with morning work start times, lunch hours, and the end of the workday.
While this article contextualizes the results in relation to the city’s sociospatial configuration, it focuses solely on the exploration of the spatiotemporal pattern of trips in Rio de Janeiro, without delving into a detailed investigation of the influence of socioeconomic factors and land use on travel behavior. Future studies aim to explore explanatory factors behind demand and trip trajectories, taking into account elements specific to the city’s spatial heterogeneity and metropolitan and regional context.
In this regard, beyond its evident potential to generate novel knowledge on the functioning and role of the TAXI.RIO service, this study also seeks to contribute methodologically, given the replicability conditions in contexts where similar services are in operation or may be implemented. In this context, it is emphasized that exploring the spatiotemporal patterns of taxi trips using this data is also useful for understanding how the city functions, by observing, for instance, when and where demand for individual transportation services is greatest. It is also understood that better knowledge of this data can support traffic planning and management, as well as medium- and long-term land use and occupation policies. More than that, this study is grounded in the idea that research on taxi trips can help identify key aspects of human mobility patterns as part of broader urban dynamics (Sang et al., 2011).
Data and Methodology
The data used in this article cover records of pick-up and drop-off events within the boundaries of the municipality of Rio de Janeiro and were provided by IPLAN/RIO[3], the municipal public company responsible for the development and management of the TAXI.RIO application. The dataset contains records of 166,337 trips that began and ended between March 1, 2020 (Sunday) and March 7, 2020 (Saturday), and originally includes the following variables:
● trip identifier;
● date and time of pick-up;
● coordinates of the pick-up point;
● coordinates of the drop-off point.
Two preprocessing steps were implemented to clean and validate the data and to include calculated variables added to the dataset. All procedures in these steps were performed using functions from packages developed in the R programming language.
In the first step, two temporal units of analysis were incorporated: the day of the week and the time interval in which the trip began (time band). The first was calculated from the original trip date, while the second was added based on the information on hour, minute, and seconds, also contained in the original dataset. The distance variable was calculated using tools from the sf package, a computational solution for handling spatial data developed by Pebesma et al. (2018). This procedure was essential to identify trips that, although classified as completed, had a distance value equal to zero. These, along with trips covering a distance of up to 100 meters, were eliminated. This procedure is based on the understanding that records of very short trips or those with zero distance are often the result of null operations or data transfer errors, as documented in the literature (Liu et al., 2012; Veloso et al., 2011). As a result, the final number of observations analyzed in this article corresponds to a set of 154,267 trips over 100 meters in length, beginning between the first hour of March 1, 2020, and the last hour of March 7, 2020. In addition to this total, Table 1 shows the number of trips by date and day of the week on which the pick-up occurred.
Table 1: Number of trips by date and day of the week of pick-up
Date | Day of the Week | Number of Trips |
01/03/2020 | Sunday | 11.547 |
02/03/2020 | Monday | 22.085 |
03/03/2020 | Tuesday | 22.453 |
04/03/2020 | Wednesday | 22.848 |
05/03/2020 | Thursday | 24.695 |
06/03/2020 | Friday | 26.386 |
07/03/2020 | Saturday | 24.253 |
Total | — | 154.267 |
Source: IPLAN-RIO
In the second step, procedures were carried out to allow for the identification of the three spatial levels used in the analysis, with the inclusion of three additional variables related to the geographic location of the points. Thus, the following were identified: the Planning Areas defined by the City of Rio de Janeiro, the Census Tract Groups from the 2010 Demographic Census, and a hexagonal spatial grid accessed through a tool developed by Pereira et al. (2022). These variables were defined through a spatial join between the location of each pick-up and drop-off point and the polygonal mesh of each area type. This was done using the st_join function from the sf package in the R programming language (Pebesma et al., 2018).
The Planning Areas (Áreas de Planejamento, AP’s) of the city of Rio de Janeiro are an administrative division of the municipality created for land use planning and management purposes. They were established by the city’s Master Plan and divide the territory into five large areas, numbered from 1 to 5. Each Planning Area comprises a defined set of the city's 163 neighborhoods, grouped according to socioeconomic, geographic, and urban characteristics. This division is used by various municipal and state government agencies for purposes such as territorial management, urban planning, transportation, health, and education. In research settings, the use of AP’s is important because they represent a macro-level social and spatial division of the city. Moreover, it allows for analyses that align more closely with local planning practices and public policy implementation.
Planning Area 1 corresponds to the city’s central zone, including the neighborhood of Centro and its surroundings. Planning Area 2 (AP 2) includes neighborhoods in the so-called South Zone (such as Copacabana, Ipanema, Flamengo, and Laranjeiras) and the area known as Greater Tijuca. It represents the region with the highest income levels, though it also includes Rocinha, one of the city’s largest and most important favelas. Planning Area 3 (AP 3) encompasses neighborhoods in the North Zone and has a relatively high population density. Although its income levels are lower, it contains key neighborhoods for commerce and economic activities, such as Méier, Cachambi, and Governor’s Island, which is home to the city’s largest airport, as well as two major favela complexes: Alemão and Maré. Planning Area 4 (AP 4) is centered around Barra da Tijuca, one of the city’s largest neighborhoods in terms of area and the main focus of real estate expansion in recent decades. Finally, Planning Area 5 (AP 5) corresponds to the West Zone. This is a vast and populous area that includes important neighborhoods in demographic terms such as Campo Grande, Bangu, and Realengo.
The Census Tract Groups from the 2010 Demographic Census are geographic units used by the Brazilian Institute of Geography and Statistics (IBGE) to estimate and publish data collected through the census sample questionnaire at the intra-urban level. These divisions are defined to ensure the sample is representative of the population in a geographic scope that falls between the census tract and the municipality. Dividing the city into Census Tract Groups is essential for capturing the diversity and heterogeneity of urban space and is used for various purposes, including management, urban planning, and social indicator monitoring. This scale not only enables a reasonably detailed visualization of the data but also allows for linkage with demographic and socioeconomic data produced by the national census.
In the case of Rio de Janeiro, these 199 spatial units resemble the boundaries of the city’s official neighborhoods and also reflect cultural and historical identity issues, reinforcing their adoption as an important tool for territorial organization and representation. The city’s division into official Planning Areas and Census Tract Groups (shown in dark gray lines) is illustrated in Figure 1.
The division of space into hexagons corresponds to a statistical grid that provides a general view of the spatial distribution of points and has been widely used in studies assessing transportation policies and access to urban opportunities (Pereira, 2018; Braga et al., 2020; Pereira, 2022), as well as in research on spatiotemporal patterns of taxi and other transportation modes (Veloso et al., 2011; Liu et al., 2015; Patel & Chandan, 2015; Arias-Molinares et al., 2021; Wang, 2023). This geographic level was used for data visualization and descriptive analysis.
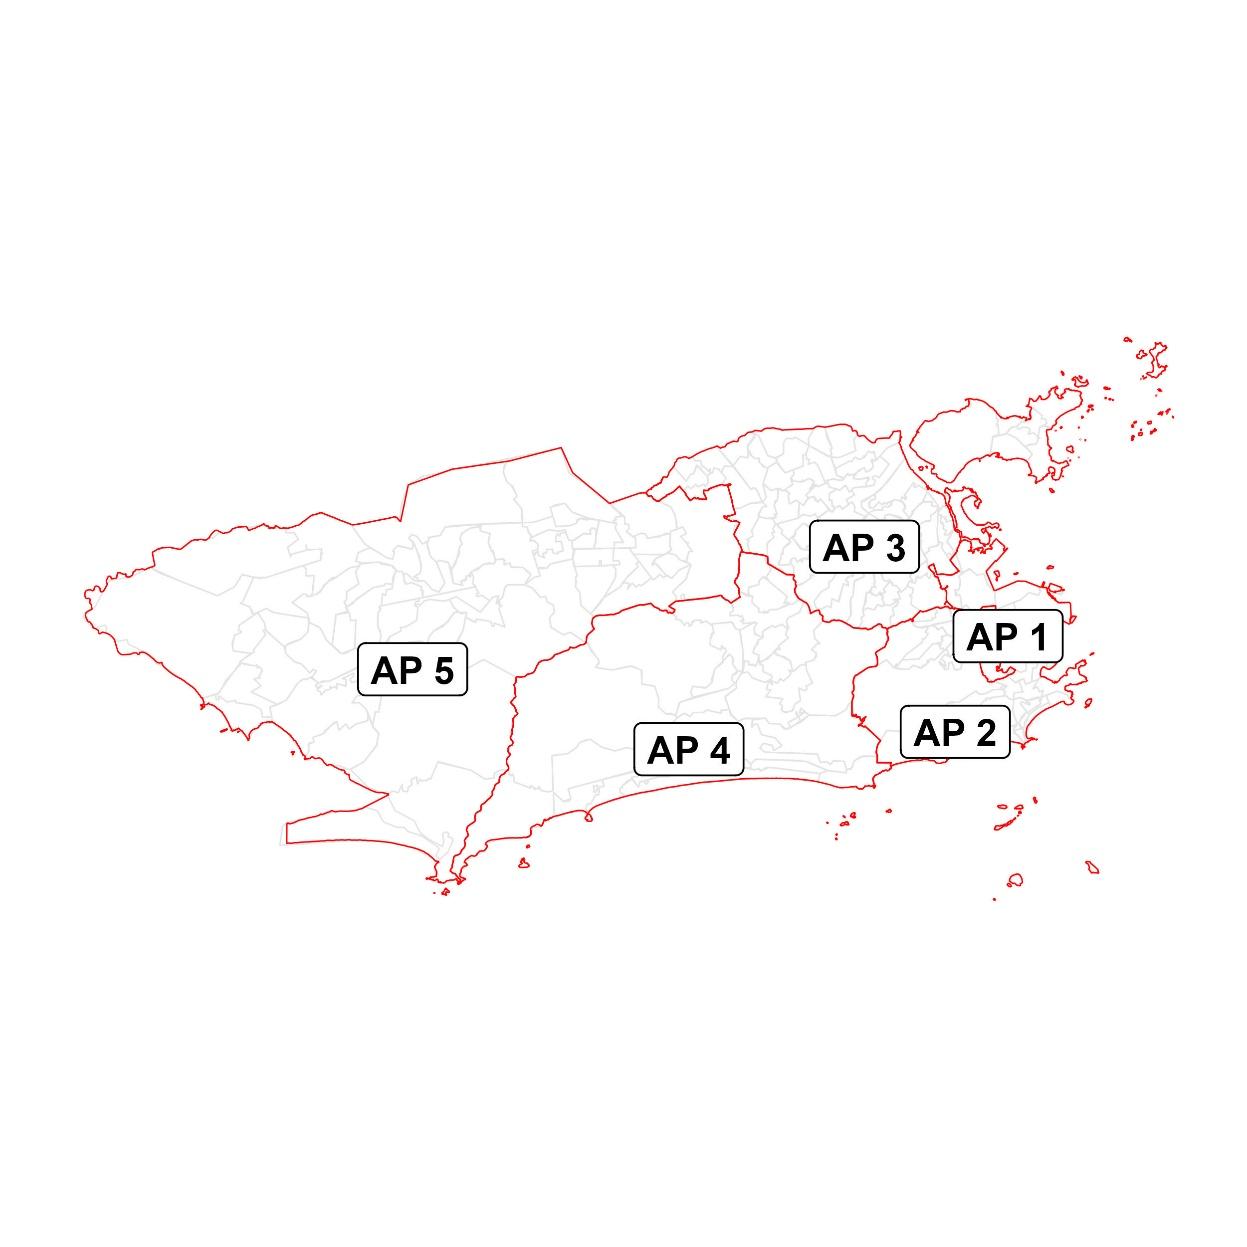
Figure 1: Division of the city of Rio de Janeiro into Planning Areas and 2010 Demographic Census Tract Groups
Source: City of Rio de Janeiro and Brazilian Institute of Geography and Statistics (IBGE).
In the analysis stage, the study employed traditional methods and metrics from descriptive statistics, exploratory data analysis, and spatial data analysis, including visualization tools through mapping. Additionally, two types of spatial autocorrelation indices were calculated to assess clustering trends in trip origins and destinations. First, the Global Moran’s I index (Anselin, 1995) was calculated. This statistical measure assesses the spatial autocorrelation of variables within a given geographic area, in this case, the entire municipality of Rio de Janeiro. A positive Global Moran’s I value indicates positive spatial autocorrelation, meaning similar values tend to be clustered in neighboring areas. A negative value indicates negative spatial autocorrelation, meaning dissimilar values are located near each other. The univariate form of the index was calculated separately for all origins and all destinations at the level of the Census Tract Group. This served to better understand the overall behavior of trips during specific pre-defined time bands (7:00-10:00 a.m. and 5:00-8:00 p.m.). For comparison purposes, the index was also calculated for other times of the day. Additionally, the Local Indicator of Spatial Association (LISA) was calculated in its univariate form to map specific clustering trends in pick-up and drop-off points over time. The calculation and mapping of this index are useful for identifying clusters where the variable values are significantly different from what would be expected under a random distribution, revealing whether pick-ups and drop-offs are concentrated in specific patterns and whether those patterns vary throughout the day. Both the global statistic and the local statistic that generated the clusters were calculated using a first-order contiguity weight matrix, i.e., considering only immediately neighboring units.
The data preprocessing, statistical analysis, and spatial representation of the results were carried out using the R programming language (R Core Team, 2018). For procedures related to analyzing the temporal distribution of trips, the spatial distribution of pick-up and drop-off points, inter-area flows within the city, and the spatial autocorrelation index, the study followed the approach proposed by Lovelace et al. (2019). This approach suggests integrating tools from geography, geoinformatics, geocomputation, and spatial statistics for the applied analysis of spatial data in R, based on the principles of open-source code, open data, and reproducibility.
Exploring the Spatiotemporal Pattern of TAXI.RIO App Trips
- Temporal Travel Patterns
The temporal distribution of boardings reveals highly similar patterns throughout weekdays. First, the data show that taxi rides occur far more frequently during the day than at night. Second, it is possible to identify two clearer peaks throughout the day—one in the morning and another in the late afternoon (Figure 2). Additionally, from Monday to Friday, a third peak in boarding volume appears around midday[4]. The concentration of trips in the middle of the week and the regular peaks in the early morning and late afternoon suggest that taxi rides may be strongly associated with commuting to and from work. This behavior resembles findings from other cities, as shown in studies analyzing taxi trips in New York (Patel and Chandan, 2015), Shanghai (Liu et al., 2012; Mao et al., 2015), Singapore (Kumar et al., 2016), and Qingdao (Liu, 2020).
On weekends, the two characteristic peaks are not as evident, which may suggest that travel is not driven by the same predominant motives observed on weekdays. This observation reinforces the notion of a daily mobility less tied to work-related purposes. On Saturdays, the pattern is characterized by an increase in the number of boardings throughout the day, with two more evident peaks, one around midday and another in the late afternoon. This behavior has not been recorded in studies of other cities, suggesting a context specific to Rio de Janeiro. On Sundays, the day with the lowest number of recorded trips, the two times with the highest number of rides are around midday, likely when people are heading to restaurants for lunch or visiting relatives, and in the late afternoon, presumably as people return from daytime activities.
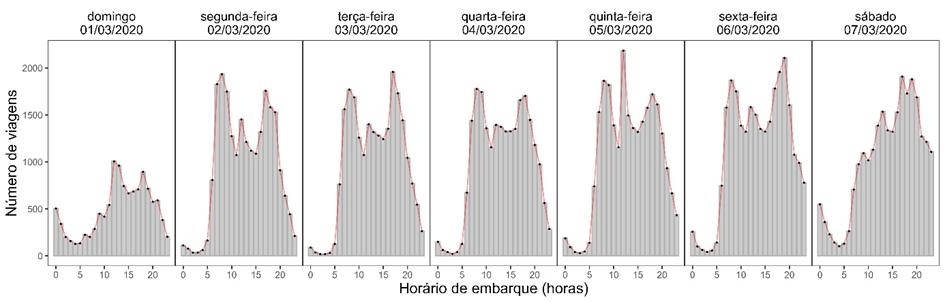
Figure 2: Number of boardings by time and weekday.
Source: Author’s elaboration using data from IPLANRIO.
- Spatial Travel Patterns
Figure 3 shows the distribution of trip origins and destinations for the reference week. In addition to a clear concentration in certain parts of the city, there is a noticeable spatial overlap between areas with higher numbers of boardings and those with more drop-offs. This suggests that taxi circulation tends to follow a consistent spatial regularity limited to certain urban zones, in other words, trips mostly originate from and arrive at the same regions throughout the week. This tendency is confirmed by the scatter plot showing the correlation between the number of boardings and drop-offs within the hexagonal grid (Figure 4). The darker colors, representing areas with the highest number of trips, are predominantly located in Planning Areas 1 and 2, as well as a small portion of Planning Area 3 bordering those two.
The zones where trip origins and destinations are concentrated partially coincide with areas of higher income, as seen in Figure 5. The exception is the Barra da Tijuca region, which, despite being a high-income area, does not exhibit a strong incidence of departures or arrivals during the reference week compared to other parts of the city. This discrepancy may be explained by the area's distinct social profile, urban characteristics, and residential typology. Barra da Tijuca is known for a culture strongly centered on the use of private automobiles. Additionally, the neighborhood features wide avenues, gated communities, and abundant parking spaces, all of which encourage private vehicle use over public transit, active mobility, or even taxis.
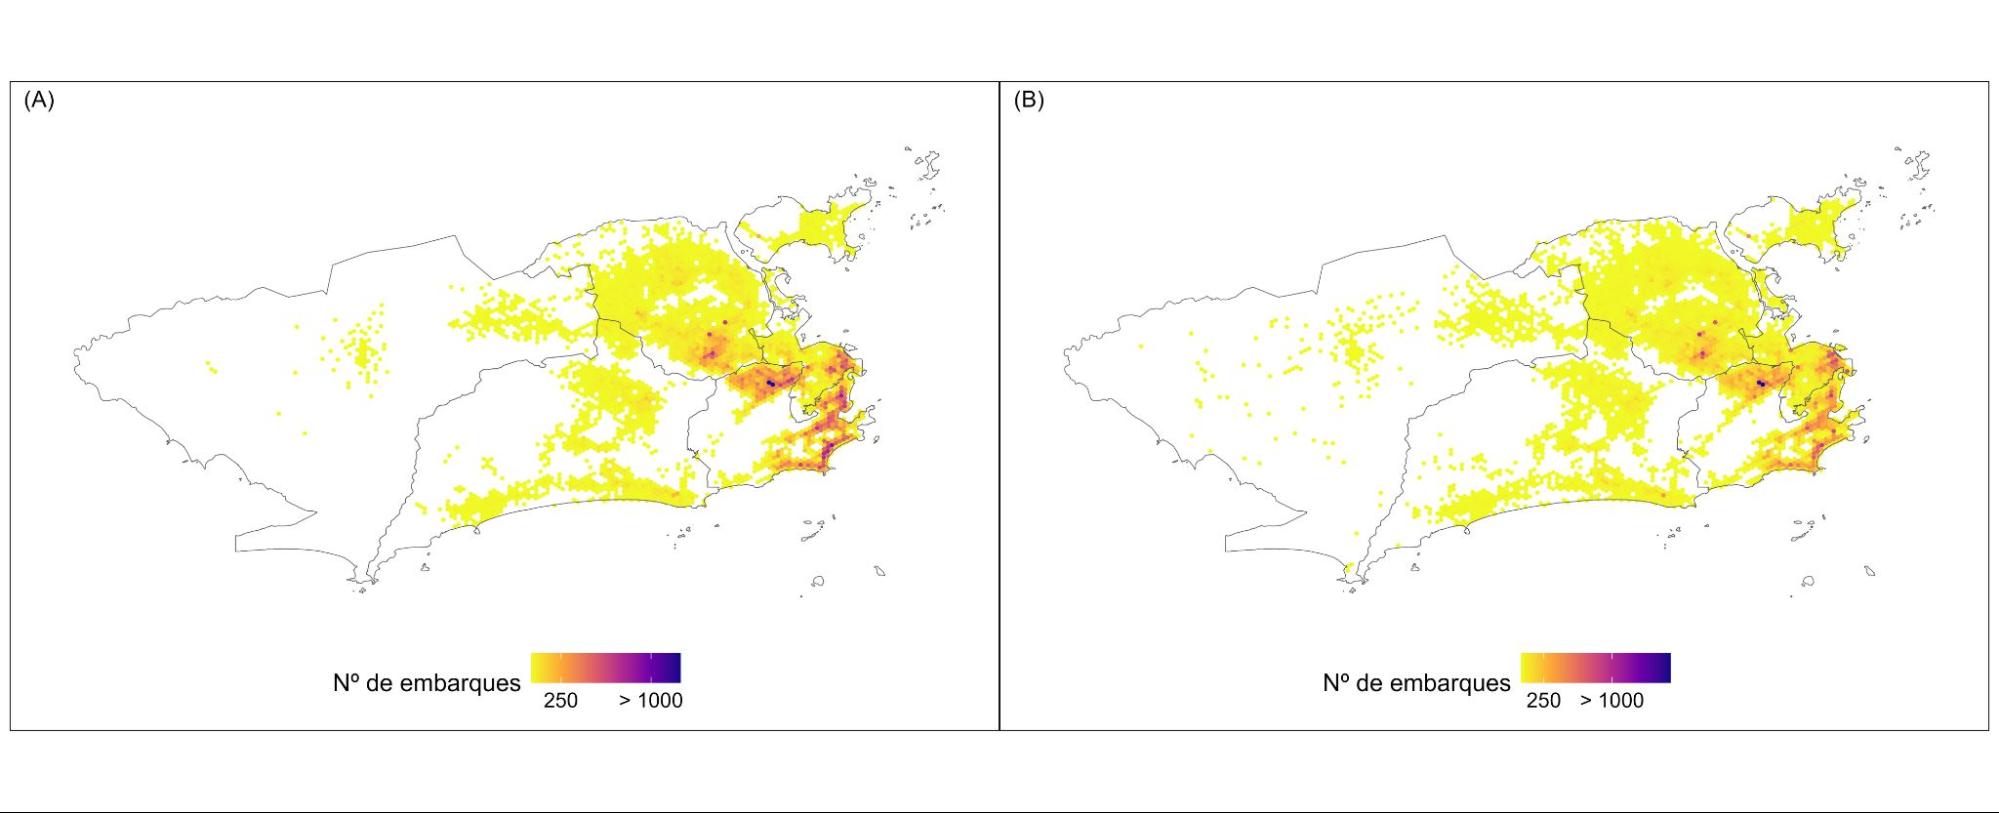
Figure 3: Spatial distribution of boarding points (A) and drop-off points (B) during the reference week.
Source: Author’s elaboration using data from IPLANRIO.
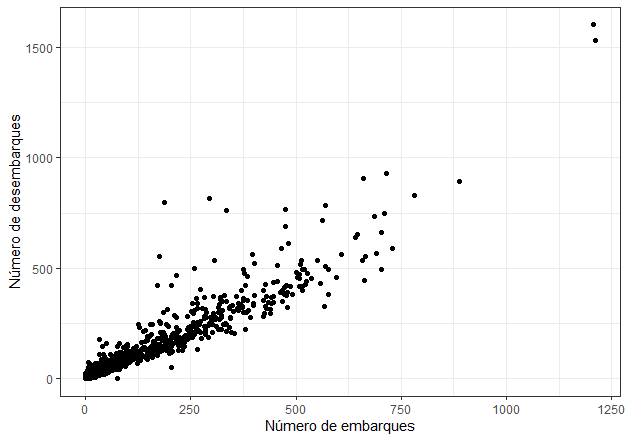
Figure 4: Scatter plot of boardings and drop-offs by hexagon during the reference week.
Source: Author’s elaboration using data from IPLANRIO.
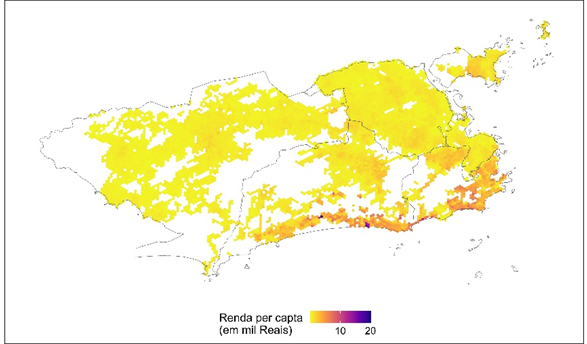
Figure 5: Spatial distribution of per capita income in the municipality of Rio de Janeiro – 2010.
Source: Author’s elaboration using data from IPEA.
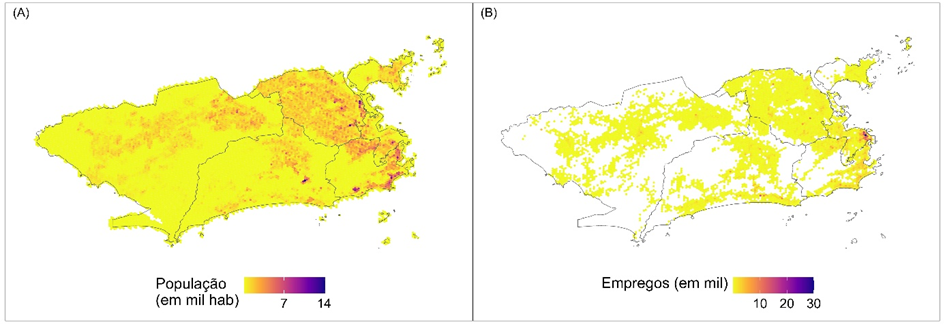
Figure 6: Spatial distribution of population (A) and employment (B) in the municipality of Rio de Janeiro – 2010.
Source: Author’s elaboration using data from IPEA.
- Mapping the Main Origin-Destination Flows
Analyzing the distribution of boarding and drop-off points aggregated by Planning Areas (AP’s) allows for a broader understanding of the data. This procedure also enables mapping the macro-behavior of all trips, identifying flows that occur within the same area or between different areas. The analysis found that 63.4% of trips both started and ended within the same AP, while 36.6% had origins and destinations in different AP’s, an expected pattern for taxi mobility, where trips tend to be shorter (Liu et al., 2012). Furthermore, the study revealed that 55.7% of trips started and ended in APs 2 or 3, with 37.9% and 17.8% respectively. Regarding inter-AP flows, notable segments include trips from AP 2 to AP 1, accounting for 10.4% of the total, and the reverse (AP 1 to AP 2), comprising 7.3% of all trips during the reference week.
In addition to this behavior, which reinforces the trend of macro-concentration in APs 1, 2, and 3, taxi mobility in Rio de Janeiro is marked by the low participation of AP 5. Although this region contains 27% of the city's population and 47% of its territory, only 0.25% of trips both began and ended within it. Moreover, no other flow involving AP 5 as either origin or destination exceeded this percentage. This is significant, as it indicates that the distribution of taxi trips closely mirrors the city’s social divide, with a macro-concentration in wealthier areas (Figure 5). This scenario suggests that in AP 5, the TAXI.RIO app-based taxi service is virtually non-existent. Additionally, the area’s position in the urban structure is characterized by its distance from the city center and its population's reliance on substandard train and bus services. The low availability of taxi services in this region appears to reflect broader issues of limited access to public services, including transportation (Pereira, 2019).
Mapping flows based on the 199 census weighting areas, in turn, provides a more detailed view of the spatial behavior of these trips in terms of trajectories. The study identified a total of 10,532 flows, including those that started and ended within the same area. These intra-area flows are particularly noteworthy, first, because they account for 6.5% of all trips made during the reference week, and second, because 50% of them occur in just 16 of the 199 areas, further emphasizing the concentration of taxi services in specific parts of the city. Among these areas, five are located in AP 2 (in the neighborhoods of Ipanema, Gávea/Jardim Botânico, Laranjeiras/Cosme Velho, Grajaú, and Vila Isabel), five in AP 3 (in the neighborhoods of Engenho Novo; S. Francisco Xavier/Riachuelo/Rocha/Sampaio/Jacaré; Méier; Cachambi; Engenho de Dentro; and Maria da Graça/Del Castilho/Higienópolis), two in AP 4 (Barra da Tijuca and Freguesia), and two in AP 1 (Centro and São Cristóvão/Vasco da Gama). Notably, a total of 599 trips started and ended within the boundaries of the Centro neighborhood, the highest value recorded for this type of flow across all census areas. Méier and Cachambi also stand out, helping explain the high number of trips in AP 3. Both are sub-centers for the service and retail sectors, with Cachambi housing one of the city's largest shopping malls.
In addition to having the highest volume of internal trips, the city center is also the main destination for flows originating in other areas. Figure 7 illustrates this by showing origin-destination flows with more than 11 trips between areas. The dots represent the centroid of each area. This information is complemented by Table 2, which lists the top ten flows. Among them, either as origin or destination, the Barra da Tijuca area is notably absent, even though it ranks among those with the highest internal flow.
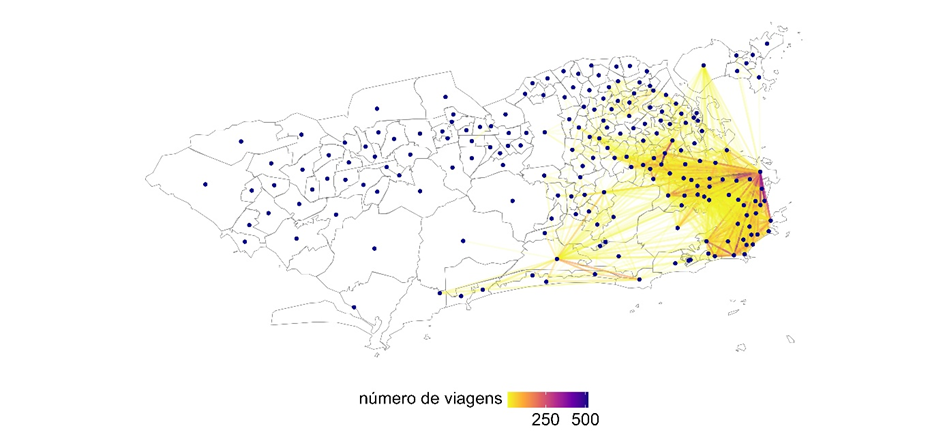
Figure 7 – Main travel flows between areas.
Source: Author’s elaboration using data from IPLANRIO.
Table 2: Main travel flows between census weighting areas
Origin | Destination | Number of Trips |
Laranjeiras/Cosme Velho | Centro | 519 |
Vila Isabel | Centro | 475 |
Cachambi | Méier | 466 |
Ipanema | Centro | 451 |
Maracanã | Centro | 390 |
Méier | Cachambi | 388 |
Flamengo | Centro | 380 |
Glória | Centro | 376 |
Flamengo | Centro | 352 |
Grajaú | Centro | 332 |
Source: Author’s elaboration using data from the TAXI.RIO App.
Spatiotemporal Patterns of Taxi Trips in the City of Rio de Janeiro
This section analyzes the distribution and clustering trends of pickup and drop-off points according to two distinct time intervals, defined by the recorded time of boarding: between 7:00 and 10:00 (morning period) and 17:00 and 20:00 (afternoon/evening period). The darkest areas on the maps in Figure 8 highlight the locations with the highest occurrences of taxi pickups and drop-offs during these intervals. It is possible to observe that the areas with the highest number of pickups in the morning are concentrated in a swath covering virtually all of Planning Area 2 (AP 2) and a smaller, lighter portion of AP 3. On the other hand, the darkest areas indicating the highest number of drop-offs in the same period are more prominent in the city center, with some scattered occurrences in other areas.
Regarding the afternoon period, pickups are more spatially dispersed, although there is a darker, more prominent concentration in the central area, similar to that observed for morning drop-offs. This behavior once again suggests that the spatiotemporal pattern of taxi trips is closely linked to commuting for work purposes.
The identification of a greater number of pickups in predominantly residential areas during the morning and of drop-offs in areas with high job concentration reinforces this hypothesis (see Figure 6). Moreover, the afternoon pattern further supports this trend, with pickups concentrated in the city center and drop-offs in predominantly residential zones. At the same time, the increase in pickups in residential areas during the afternoon peak suggests that trips during this period may have more varied purposes, including travel to commercial and leisure centers, such as shopping malls.
As shown in the maps, drop-off points in the afternoon coincide spatially with pickup points in the morning. This is reinforced by Figure 8, which visually represents the association between the number of pickups and drop-offs in these specific periods, and by the correlation calculated between the two variables, which is positive and highly correlated (0.82 on a scale of 1). This result suggests that the areas where trips begin in the morning are the same as those where they end in the afternoon. At the same time, this behavior reveals a pendular travel pattern in the city of Rio de Janeiro, at least in these time intervals.
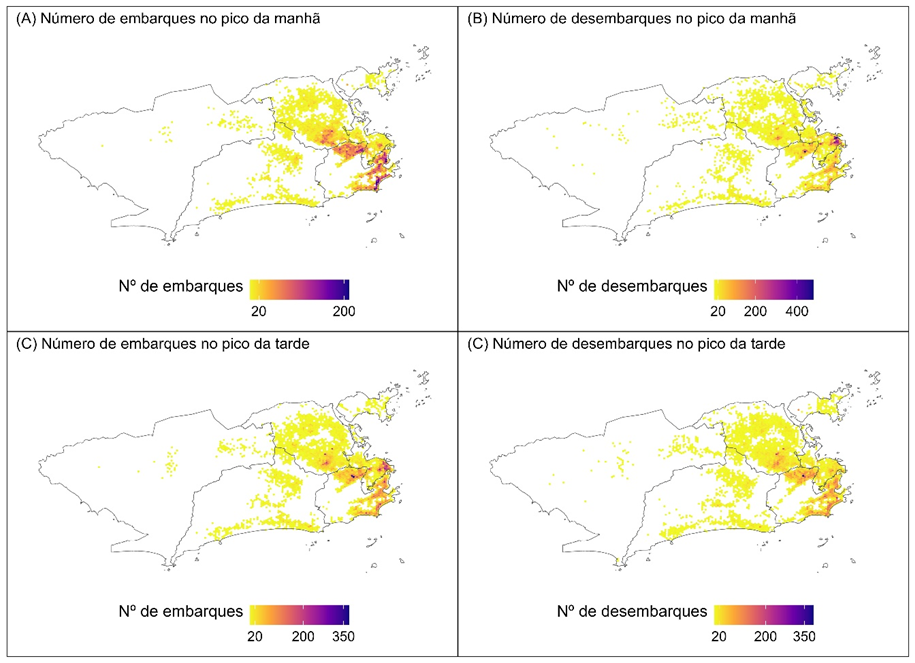
Figure 8: Spatial distribution of pickup and drop-off points in the reference week by peak hour intervals.
Source: Author’s elaboration based on data from IPLAN/RIO.
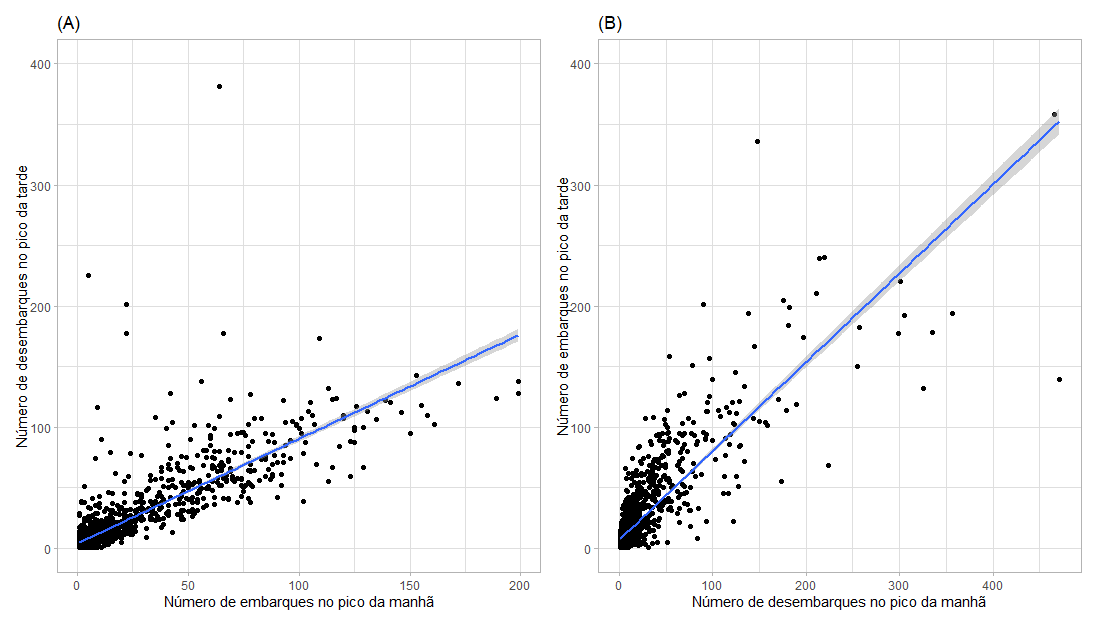
Figure 9: Scatter plot of the number of pickups in the morning and drop-offs in the afternoon (A), and scatter plot of drop-offs in the morning and pickups in the afternoon (B).
Source: Author’s elaboration based on data from IPLAN/RIO.
To better understand the spatiotemporal dynamics of taxi mobility, the Global Univariate Moran’s I Index was calculated for the number of pickups and drop-offs aggregated at the census weighting area level for each time interval. The results are shown in Figure 10. The Global Moran’s I calculated for morning peak pickups yielded a result of 0.75, indicating a high degree of spatial autocorrelation and suggesting a strong clustering tendency during this period. For drop-offs in the same time slot, the index result was 0.213, approaching a situation of no spatial autocorrelation. This result reflects the extreme concentration of drop-off points in the city center, which, despite high volumes, are surrounded by areas with significantly different values, thus limiting the influence on the global index. Therefore, while this concentration is sufficient to generate a cluster of drop-offs (as will be seen), it does not indicate a global trend of significant clustering.
The result for pickups between 5 PM and 8 PM (0.705) is similar to that of morning pickups, suggesting a comparable clustering pattern. In other time intervals, both pickup and drop-off indices (0.589 and 0.57, respectively) indicate a moderate positive spatial autocorrelation, meaning areas with similar values tend to be near each other, but not to the same extent as in the morning and afternoon peak periods.
In summary, the most relevant results of the Global Moran’s I Index point to a general pattern characterized by a higher tendency for clustering of origins in the morning and destinations in the afternoon, indicating a general pendular movement pattern in taxi travel behavior.
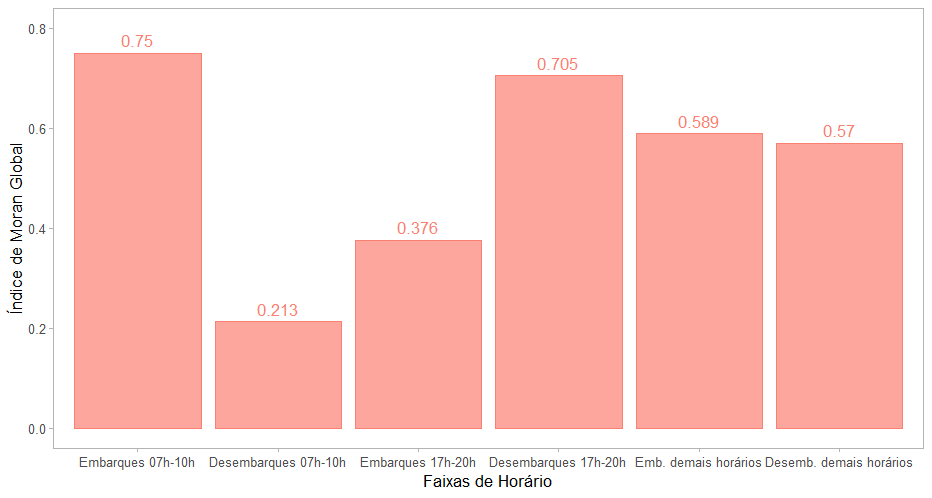
Figure 10: Global Moran’s I Index by time intervals.
Source: Author’s elaboration based on data from the TAXI.RIO app.
As noted in the methodology section, in addition to visualizations through maps and the global index, the Local Moran’s I Index was calculated. This measure detects origin and destination clusters at the census weighting area level to better explore and qualify the trends already identified. The maps in Figure 11 show statistically significant clusters. Red regions represent High-High (HH) clusters, where areas with high values are surrounded by others with similarly high values. Dark blue regions represent Low-Low (LL) clusters, where low-value areas are clustered together. High-Low (HL) clusters occur when a high-value area is surrounded by low-value areas, indicating spatial dissociation, which also characterizes Low-High (LH) clusters, where low-value areas are surrounded by high-value areas.
In this study, only statistically significant HH, LL, and LH clusters were identified, there were no areas with high quantities of origins or destinations surrounded by low-value areas across the time intervals analyzed. It is clear that in the morning period, the HH pickup cluster is concentrated predominantly in areas located in AP 2 and some parts of AP 3. For drop-offs, the HH cluster is limited to areas within AP 1, which comprises Rio de Janeiro’s central region. These findings reinforce the existence of a travel pattern beginning in predominantly residential areas and ending in the city's main employment hubs.
This pattern is confirmed by the HH cluster of pickups between 5 PM and 8 PM, which includes downtown Rio, its immediate surroundings, and areas corresponding to neighborhoods such as Lagoa, Botafogo, and Flamengo—all in the city’s South Zone. This configuration is likely due to the high number of people taking taxis to return home from work. Additionally, a cluster was identified in AP 3 encompassing areas corresponding to the neighborhoods of Cachambi, Todos os Santos, Engenho Novo, Lins de Vasconcelos, and part of Méier, all with a strong commercial presence, including one of the city’s largest shopping centers.
Some of these areas also make up the clusters of afternoon drop-offs. Notably, the city center does not appear among them, reinforcing one of the defining characteristics of taxi travel patterns in Rio de Janeiro: its role as the main destination in the morning and origin in the afternoon when work activities conclude.
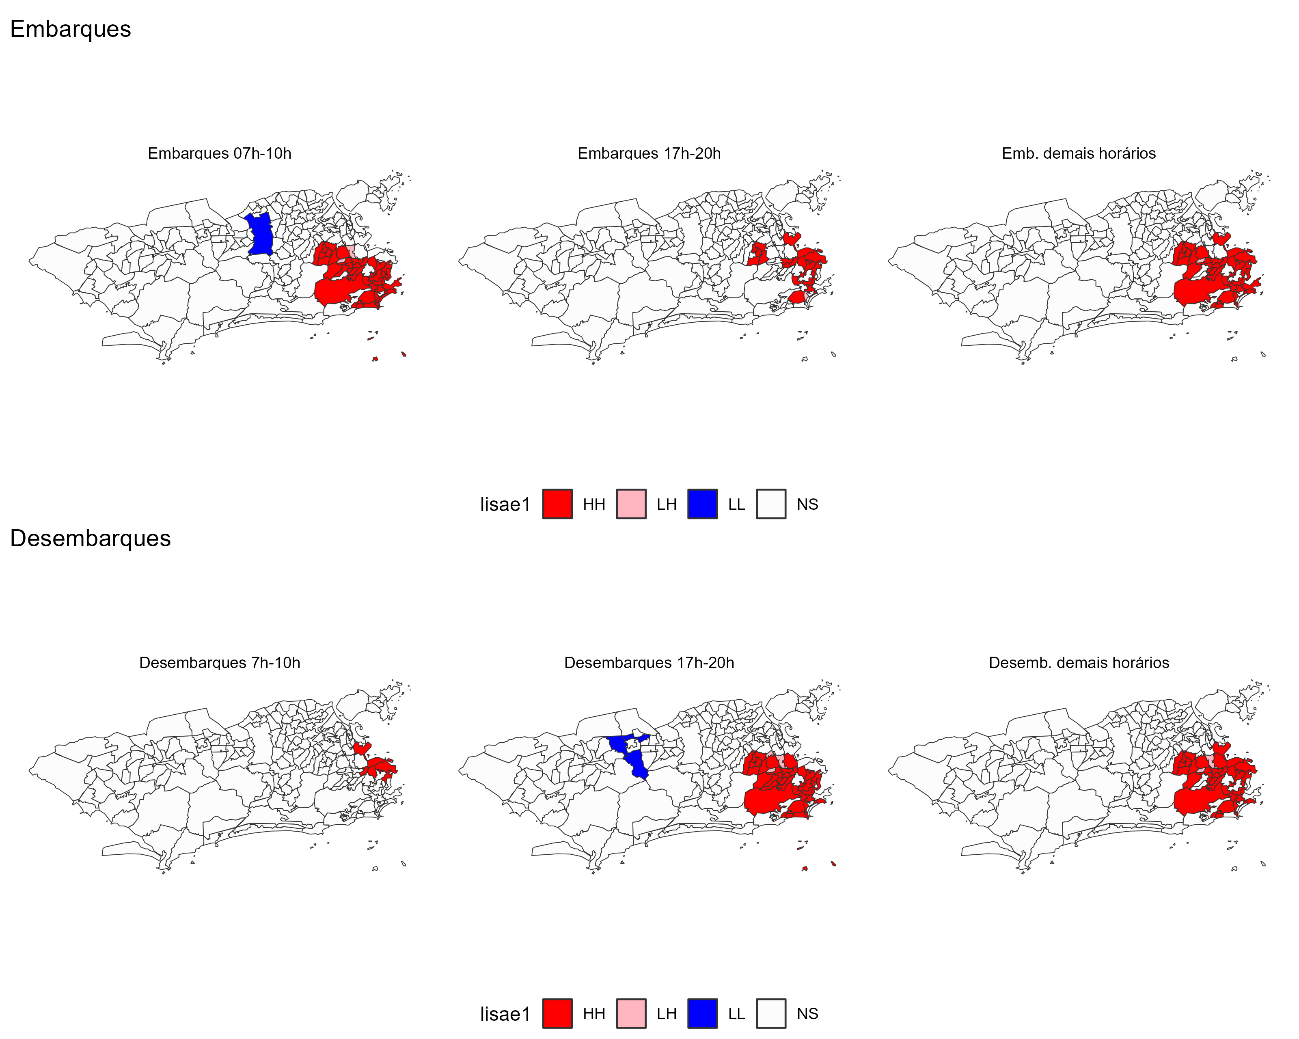
Figure 11: Spatial clusters of pickups and drop-offs by time interval based on the Local Moran’s I Index.
Source: Author’s elaboration based on data from IPLAN/RIO.
Conclusion
This article aimed to analyze the spatiotemporal patterns of taxi trips in the municipality of Rio de Janeiro requested through the TAXI.RIO app. To this end, we employed methods and metrics from descriptive statistics, exploratory data analysis, and spatial data analysis, including mapping tools and the calculation of spatial autocorrelation indices.
Before the analysis itself, it was important to contextualize the implementation of the app as a technological tool tied to an important institutional dimension of transportation in the city. Its institutionalization as a public solution to a transportation issue also touches on mobility governance, allowing the accommodation of taxi drivers’ interests, who had seen a sharp drop in income with the rise of private competitors. In this sense, the implementation of the app marked a sort of reinstitutionalization of taxis as a public individual transport service in the city of Rio de Janeiro. The City Hall thus began to provide institutional guarantees for the continuity of the service through the deployment of this technology. This observation highlights the importance of TAXI.RIO not only as an object of research in the field of transportation but also in urban planning and public policy, justifying further exploration in future studies.
The analysis confirmed the existence of a spatiotemporal pattern with significant daily regularity during the reference week. First, it is possible to identify recurring spatiotemporal regularities that define a predominant pattern, even though one of the main characteristics of taxi service is its adaptability to passenger needs, as it is not limited to predefined routes or pickup/drop-off locations. This pattern is marked by peaks of origin and destination that are spatially concentrated. In the morning, this demand appears specifically in predominantly residential areas, while destinations cluster around the city center and its surroundings. Although we did not explore this aspect in greater detail, it is reasonable to assume that public facilities, train stations, airports, parks, and shopping centers are important attractors of these trips. Future research into the spatiotemporal patterns of taxi travel should delve deeper into these specific spatial characteristics.
This study also showed that taxi use presents significantly different patterns between weekdays and weekends, an aspect that should also be explored further in subsequent research. Nonetheless, as in other studies (Liu et al., 2015), the exploration of data from Rio de Janeiro reveals a predominance of short-distance spatial interactions, indicating that the demand and trajectory of taxi trips are strongly linked to everyday mobility. At the same time, the results show that the most popular destinations are located in areas with high employment concentration, as also demonstrated by Qian and Ukkusuri (2015) and Patel and Chandan (2015) for New York, and by Yang et al. (2018) for Washington, DC. In addition to this trend related to employment location, the analysis of taxi trip data in Rio de Janeiro also indicates that the temporal pattern is closely associated with the operating hours of economic establishments. This aligns with findings in other cities, such as Manizales (Giraldo-Forero et al., 2019) and Berlin (Bischoff et al., 2015).
Beyond its methodological contribution, the results presented in this article may be incorporated into public transportation planning by identifying demands not captured through traditional passenger data. Furthermore, efforts to map spatiotemporal patterns may support public policies for traffic management and the implementation of circulation infrastructure, including interactions between taxi use and other modes of transport.
Finally, it is important to acknowledge that taxi data inevitably face representativeness issues, that is, taxi passengers and app users do not constitute a sufficiently random sample of the general transport-using population. In the case of Rio de Janeiro, such data can certainly point to relevant aspects of urban dynamics and transportation operations, but they are not representative of general mobility patterns. One of the main limitations concerns the potential bias introduced by differences in the profile of taxi users compared to the general population, as these users tend to be higher-income residents concentrated in specific areas of the city. Despite this limitation, we hope the study can inform public policies related to taxi transportation in the city, contributing to improving the efficiency and convenience of the overall transportation system. By drawing on studies of taxi demand patterns, authorities can make informed decisions about where and when to implement improvements in public transport, such as expanding bus lines or constructing metro stations in high-demand areas.
References
ANSELIN, L. Local indicators of spatial association—LISA. Geographical Analysis, v. 27, n. 2, p. 93–115, 1995. DOI: 10.1111/j.1538-4632.1995.tb00338.x.
ARIAS-MOLINARES, D. et al. Exploring the spatio-temporal dynamics of moped-style scooter sharing services in urban areas. Journal of Transport Geography, v. 96, p. 1–15, 2021. DOI: 10.1016/j.jtrangeo.2021.103193.
BINENBOJM, G. Novas tecnologias e mutações regulatórias nos transportes públicos municipais de passageiros: um estudo a partir do caso Uber. Revista de Direito da Cidade, v. 8, n. 4, p. 1690–1706, 2016. DOI: 10.12957/rdc.2016.26051.
BISCHOFF, J.; MACIEJEWSKI, M.; SOHR, A. Analysis of Berlin’s taxi services by exploring GPS traces. In: MODELS AND TECHNOLOGIES FOR INTELLIGENT TRANSPORTATION SYSTEMS, 2015, Budapest. Proceedings [...]. Budapest: MT-ITS, 2015. p. 209–215.
BRAGA, C.; LOUREIRO, C.; PEREIRA, R. Analisando a variabilidade de estimativas de acessibilidade por transporte público a partir de dados de GPS. Transportes, v. 28, n. 5, p. 169–184, 2020.
BRASILEIRO, L. A.; XAVIER, A. G. Caracterização do serviço de táxi sem taxímetro: caso da cidade de Ilha Solteira, SP. Revista dos Transportes Públicos, v. 18, n. 3, p. 45–56, 1996.
DIAS, F. A. O. P. Contribuição metodológica para o cálculo das tarifas de táxi: um estudo de caso em Brasília. Revista dos Transportes Públicos, v. 32, n. 4, p. 25–36, 2009.
DRUMOND, R. A. Análise da produtividade do serviço de táxi de Belo Horizonte. In: CONGRESSO BRASILEIRO DE TRANSPORTE E TRÂNSITO, 21., 2017, São Paulo. Proceedings [...]. São Paulo: ANTP, 2017. p. 1–7.
ESTOLANO, B. et al. Porto Táxi – Um retrato de Recife. In: CONGRESSO BRASILEIRO DE TRANSPORTE E TRÂNSITO, 17., 2009, Curitiba. Proceedings [...]. Curitiba: ANTP, 2009. p. 1–6.
GALVÃO, R. R.; ALMEIDA, A. R. Monitoração do mercado de táxi e remuneração pelo desempenho padrão. In: CONGRESSO BRASILEIRO DE TRANSPORTE E TRÂNSITO, 11., 1997, Belo Horizonte. Proceedings [...]. Belo Horizonte: ANTP, 1997. p. 1–11.
GIRALDO-FORERO, A. F. et al. A spatiotemporal analysis of taxis demand: a case study in the Manizales City. In: NYSTRÖM, I.; HERNÁNDEZ HEREDIA, Y.; MILIÁN NÚÑEZ, V. (ed.). Progress in pattern recognition, image analysis, computer vision, and applications: CIARP 2019. Cham: Springer, 2019. (Lecture Notes in Computer Science, v. 11896). DOI: 10.1007/978-3-030-33904-3_48. Available at: https://doi.org/10.1007/978-3-030-33904-3_48. Accessed on: June 27, 2025.
GONÇALVES, A. O.; BARBOSA, A. E. F.; LUCATO, B. L. Táxi – Um salto de qualidade por meio da reorganização do serviço. In: CONGRESSO BRASILEIRO DE TRANSPORTE E TRÂNSITO, 18., 2011, Rio de Janeiro. Proceedings [...]. Rio de Janeiro: ANTP, 2011. p. 45–48.
GONÇALVES, A. R.; KNEIB, E. C. Caracterização do serviço de táxi: elementos para a revisão tarifária do Distrito Federal. In: CONGRESSO BRASILEIRO DE TRANSPORTE E TRÂNSITO, 17., 2009, Curitiba. Proceedings [...]. Curitiba: ANTP, 2009. p. 1–11.
GONZÁLEZ, M.; HIDALGO, C.; BARABÁSI, A. L. Understanding individual human mobility patterns. Nature, v. 453, n. 7196, p. 779–782, 2008. DOI: https://doi.org/10.1038/nature06958. Available at: https://doi.org/10.1038/nature06958. Accessed on: June 27, 2025.
HINO, M. C. et al. Mudança em modelos de negócios consolidados: o estudo das cooperativas de rádio táxi no Brasil após a inclusão dos aplicativos no mercado. Journal of Information Systems and Technology Management, v. 15, p. 1–19, 2018. DOI: 10.4301/S1807-1775201815009.
HOCHMAIR, H. H. Spatiotemporal pattern analysis of taxi trips in New York city. Transportation Research Record, v. 2542, p. 45–56, 2016. DOI: 10.3141/2542-06.
IBGE – INSTITUTO BRASILEIRO DE GEOGRAFIA E ESTATÍSTICA. Censo Brasileiro de 2022. Rio de Janeiro: IBGE, 2022.
KUMAR, D. et al. Understanding urban mobility via taxi trip clustering. In: IEEE INTERNATIONAL CONFERENCE ON MOBILE DATA MANAGEMENT, 17., 2016, Porto. Proceedings [...]. Porto: IEEE, 2016. p. 318–324. DOI: 10.1109/MDM.2016.54.
LIU, Y. et al. Understanding intra-urban trip patterns from taxi trajectory data. Journal of Geographical Systems, v. 14, n. 4, p. 463–483, 2012. DOI: 10.1007/s10109-012-0166-z.
LIU, X. et al. Revealing travel patterns and city structure with taxi trip data. Journal of Transport Geography, v. 43, p. 78–90, 2015. DOI: 10.1016/j.jtrangeo.2015.01.016.
LIU, X. et al. Spatial variation of taxi demand using GPS trajectories and POI data. Journal of Advanced Transportation, v. 2020, p. 1–20, 2020. DOI: 10.1155/2020/7621576.
LEGROUX, J. A triplicidade do espaço e das práticas cotidianas de mobilidade para o estudo da fragmentação socioespacial. GEOgraphia, v. 23, n. 51, 2021. Available at: https://periodicos.uff.br/geographia/article/view/47518. Accessed on: 27 jun. 2025.
LOVELACE, R.; NOWOSAD, J.; MUENCHOW, J. Geocomputation with R. London: CRC Press, 2019.
MAO, F.; JI, M.; LIU, T. Mining spatiotemporal patterns of urban dwellers from taxi trajectory data. Frontiers of Earth Science, v. 10, n. 2, p. 205–221, 2016. DOI: 10.1007/s11707-015-0525-4.
MONTEIRO, P. R. S.; MIGLIORINI, V. L.; PAULA, A. Q. Metodologia para reestruturação do serviço de táxi em cidades de pequeno e médio porte. In: CONGRESSO BRASILEIRO DE TRANSPORTE E TRÂNSITO, 20., 2015, Santos. Proceedings [...]. Santos: ANTP, 2015. p. 1–9.
ORGANIZATION FOR ECONOMIC COOPERATION AND DEVELOPMENT – OECD. Taxi services regulation and competition: roundtables on competition policy nº 81. Paris: OECD, 2007. Available at: https://www.oecd.org/daf/competition/41472612.pdf. Accessed on: May 27, 2023.
OLIVEIRA, F. Metodologia de cálculo das tarifas de táxi – Belo Horizonte. In: CONGRESSO BRASILEIRO DE TRANSPORTE E TRÂNSITO, 17., 2009, Curitiba. Proceedings [...]. Curitiba: ANTP, 2009. p. 1–16.
PATEL, U.; CHANDAN, A. NYC taxi trip and fare data analytics using BigData. ResearchGate, [S.l.], Oct. 2015. Available at: https://www.researchgate.net/publication/287205718_NYC_Taxi_Trip_and_Fare_Data_Analytics_using_BigData. Accessed on: 27 jun. 2025.
PENG, C. et al. Collective human mobility pattern from taxi trips in urban area. PLoS ONE, v. 7, n. 8, 2012. DOI: https://doi.org/10.1371/annotation/f0d48839-ed4b-4cb2-822a-d449a6b4fa5d.
PEBESMA, E. Simple features for R: standardized support for spatial vector data. The R Journal, v. 10, n. 1, p. 439–446, 2018. DOI: 10.32614/RJ-2018-009. Available at: https://doi.org/10.32614/RJ-2018-009. Accessed on: 30 jun. 2025.
PEREIRA, R. H. M. Transport legacy of mega-events and the redistribution of accessibility to urban destinations. Cities, v. 81, p. 45–60, 2018. DOI: 10.1016/j.cities.2018.03.013.
PEREIRA, R. H. M. Desigualdades socioespaciais de acesso a oportunidades nas cidades brasileiras – 2019. Brasília: Ipea, 2020. (Texto para Discussão, n. 2535). Available at: http://repositorio.ipea.gov.br/handle/11058/9586. Accessed on: 30 jun. 2025.
PEREIRA, R. H. M. et al. Estimativas de acessibilidade a empregos e serviços públicos via transporte ativo, público e privado nas 20 maiores cidades do Brasil em 2017, 2018, 2019. Brasília: Ipea, 2022. (Texto para Discussão, n. 2800). Available at: http://dx.doi.org/10.38116/td2800. Accessed on: 30 jun. 2025.
PEREIRA, R. H. M. Justiça distributiva e equidade no transporte: legado dos megaeventos e desigualdades de acesso a oportunidades no Rio de Janeiro. Brasília: Ipea, 2019. (Texto para Discussão, n. 2464). Available at: https://bit.ly/2S7smes. Accessed on: 30 jun. 2025.
QIAN, X.; UKKUSURI, S. V. Spatial variation of the urban taxi ridership using GPS data. Applied Geography, v. 59, p. 31–42, 2015. DOI: 10.1016/j.apgeog.2015.02.011.
R CORE TEAM. A language and environment for statistical computing. Vienna: R Foundation for Statistical Computing, 2021. Available at: https://www.R-project.org/. Accessed on: May 27, 2023.
SANG, S.; O’KELLY, M.; KWAN, M. P. Examining commuting patterns: results from a journey-to-work model disaggregated by gender and occupation. Urban Studies, v. 48, n. 5, p. 891–909, May 2011. DOI: 10.1177/0042098010368576. Available at: https://doi.org/10.1177/0042098010368576. Accessed on: June 27, 2025.
TANG, L. et al. Uncovering distribution patterns of high performance taxis from big trace data. ISPRS International Journal of Geo-Information, v. 6, n. 5, art. 134, 2017. DOI: 10.3390/ijgi6050134. Available at: https://doi.org/10.3390/ijgi6050134. Accessed on: June 27, 2025.
VELOSO, M.; PHITHAKKITNUKOON, S.; BENTO, C. Urban mobility study using taxi traces. In: TRAJECTORY DATA MINING AND ANALYSIS, 2011, New York. Proceedings of the 2011 International Workshop on Trajectory Data Mining and Analysis. New York: ACM, 2011. p. 23–30.
VELOSO, M. et al. Exploratory study of urban flow using taxi traces. In: WORKSHOP ON PERVASIVE URBAN APPLICATIONS – PURBA, 1., 2011, San Francisco. Proceedings [...]. San Francisco: ACM, 2011.
WANG, J. et al. How do taxi usage patterns vary and why? A dynamic spatiotemporal analysis in Beijing. Computational Urban Science, v. 3, art. 11, 2023. DOI: 10.1007/43762-023-00087-w. Available at: https://doi.org/10.1007/43762-023-00087-w. Accessed on: June 27, 2025.
WANG, N. et al. Ride‑hailing origin‑destination demand prediction with spatiotemporal information fusion. Transportation Safety and Environment, v. 6, n. 2, p. tdad026, Apr. 2024. DOI: 10.1093/tse/tdad026. Available at: https://doi.org/10.1093/tse/tdad026. Accessed on: June 27, 2025.
YANG, Z. et al. Analysis of Washington, DC taxi demand using GPS and land-use data. Journal of Transport Geography, v. 66, p. 35–44, 2018. DOI: 10.1016/j.jtrangeo.2017.10.021.
ZHANG, D. et al. Understanding taxi service strategies from taxi GPS traces. IEEE Transactions on Intelligent Transportation Systems, v. 16, n. 1, p. 123–135, 2015. DOI: 10.1109/TITS.2014.2328231.
ZHANG, W.; HONNAPP, H.; UKKUSURI, S. V. Modeling urban taxi services with e-hailings: a queueing network approach. In: INTERNATIONAL SYMPOSIUM ON TRANSPORTATION AND TRAFFIC THEORY – ISTTT, 23., 2018. Proceedings [...]. p. 751–771.
About the Author
Juciano Martins Rodrigues is a Professor at the Institute for Research and Urban and Regional Planning (IPPUR) at the Federal University of Rio de Janeiro (UFRJ). He holds a Master’s degree in Population Studies and Social Research from the National School of Statistical Sciences (ENCE/IBGE) and a PhD in Urbanism from the Graduate Program in Urbanism (PROURB/UFRJ).
Acknowledgments
The author acknowledges the contributions of the Municipal IT Company (IPLANRIO) for providing the data used in this article.
Author Contributions
Conceptualization, J.M.R.; methodology, J.M.R.; software, J.M.R.; validation, J.M.R.; formal analysis, J.M.R.; investigation, J.M.R.; resources, J.M.R.; data curation, J.M.R.; writing—original draft preparation, J.M.R.; writing—review and editing, J.M.R.; visualization, J.M.R.
Conflicts of Interest
The authors declare no conflicts of interest.
About Coleção Estudos Cariocas
Coleção Estudos Cariocas (ISSN 1984-7203) is a publication dedicated to studies and research on the Municipality of Rio de Janeiro, affiliated with the Pereira Passos Institute (IPP) of the Rio de Janeiro City Hall.
Its objective is to disseminate technical and scientific production on topics related to the city of Rio de Janeiro, as well as its metropolitan connections and its role in regional, national, and international contexts. The collection is open to all researchers (whether municipal employees or not) and covers a wide range of fields — provided they partially or fully address the spatial scope of the city of Rio de Janeiro.
Articles must also align with the Institute’s objectives, which are:
- to promote and coordinate public intervention in the city’s urban space;
- to provide and integrate the activities of the city’s geographic, cartographic, monographic, and statistical information systems;
- to support the establishment of basic guidelines for the city’s socioeconomic development.
Special emphasis will be given to the articulation of the articles with the city's economic development proposal. Thus, it is expected that the multidisciplinary articles submitted to the journal will address the urban development needs of Rio de Janeiro.
[1] Since May 29, 2017, the standard taxi service (with the traditional yellow and blue vehicles) has been officially designated as a cultural heritage of the city.
[2] In 2021, the City of Rio de Janeiro issued a decree to regulate remunerated private individual transportation via mobile applications, based on Articles 11-A and 11-B of Federal Law 12,587 of 2012 (Urban Mobility Law). The measure included provisions for the creation of a Municipal Fund for Sustainable Urban Mobility, financed by a 1.5% levy on the fare charged to passengers, as well as the establishment of a Committee for the Study and Regulation of App-Based Transportation (Cerva). However, neither the fund nor the committee were implemented, and in March 2021, the decree was revoked.
[3] Municipal company responsible for managing Information and Communication Technology (ICT) resources in the city of Rio de Janeiro. It was established by Law No. 140 of November 14, 1979.
[4] As can be seen in Figure 2, this peak is more pronounced on Thursday, differing from the pattern observed on other days. This discrepancy was investigated in detail, but no reasons were found to explain the behavior, as there were no intervening events in the city on that date and time. Furthermore, no technical issues were detected in the data that could have caused such a difference.