
Volume 13 Issue 4 *Corresponding author ayrtongeo@gmail.com Submitted 10 Nov 2025 Accepted 05 Jan 2026 Published 30 Jan 2026 Citation MANSO, A. D. et al. Assessment of urban cover changes in the AEIU of Porto Maravilha (RJ) using spectral indices. Coleção Estudos Cariocas, v. 13, n. 4, 2026.
DOI 10.71256/19847203.13.4.189.2025. The article was originally submitted in PORTUGUESE. Translations into other languages were reviewed and validated by the authors and the editorial team. Nevertheless, for the most accurate representation of the subject matter, readers are encouraged to consult the article in its original language.


| Assessment of urban cover changes in the AEIU of Porto Maravilha (RJ) using spectral indices Avaliação de mudanças na cobertura urbana da AEIU do Porto Maravilha (RJ) a partir de índices espectrais Evaluación de cambios en la cobertura urbana de la AEIU de Porto Maravilha (RJ) a partir de índices espectrales Ayrton Durães Manso1, Caio Gabriel Santa Bacelar2; Alexandra de Souza Rodrigues3; Hugo Portocarrero4; Pablo Ritto Koehler5 1Universidade do Estado do Rio de Janeiro, Rua São Francisco Xavier, 524, Bloco A Maracanã – Rio de Janeiro - RJ, ORCID: 0000-0002-2002-3328, ayrtongeo@gmail.com 2Universidade Federal Fluminense, Av. Gal. Milton Tavares de Souza s/nº - Gragoatá - Niterói, Rio de Janeiro - RJ, ORCID: 0009-0009-5820-9302, bacelar.caiogabriel@gmail.com 3Universidade Federal do Estado do Rio de Janeiro, Avenida Pasteur nº 296, Urca, Rio de Janeiro - RJ, ORCID: 0009-0001-4253-5869, ale.his.rodrigues@gmail.com 4Universidade do Estado do Rio de Janeiro, Rua São Francisco Xavier, 524, Bloco A Maracanã – Rio de Janeiro - RJ, ORCID: 0000-0001-7733-6352, hportocarrero@gmail.com 5 Companhia Carioca de Parcerias e Investimentos, R. Sacadura Cabral, 133 - Saúde, Rio de Janeiro – RJ, ORCID: 0009-0008-7796-2140, pablokoehler@ccpar.com.br
AbstractThis study quantified land cover change in the Porto Maravilha Urban Special Interest Area (AEIU) (2009-2024), utilizing remote sensing geotechnological instrumentation. Geoinformation derived from spectral indices NDVI and NDBI (Landsat) revealed two distinct periods. The first (2009-2016) is characterized by an increment in NDBI and a decrement in NDVI, indicating construction densification and vegetation suppression. The second period (2017-2024) exhibited the stabilization of anthropic surfaces. The negative correlation between the indices validated the increase in built-up areas at the expense of green areas. Keywords: remote sensing, land cover, Porto MaravilhaResumoO presente estudo quantificou a alteração na cobertura do solo na Área de Especial Interesse Urbanístico (AEIU) do Porto Maravilha (2009-2024), mediante instrumentação geotecnológica de sensoriamento remoto. A geoinformação, derivada dos índices espectrais NDVI e NDBI (Landsat), revelou dois períodos distintos. O primeiro (2009-2016) é caracterizado pelo incremento do NDBI e decréscimo do NDVI, indicando adensamento construtivo e supressão vegetal. O segundo período (2017-2024) apresentou a estabilização das superfícies antrópicas. A correlação negativa entre os índices validou o aumento de áreas construídas em detrimento de áreas verdes. Palavras-chave: sensoriamento remoto, cobertura do solo, Porto Maravilha ResumenEl presente estudio cuantificó el cambio en la cobertura del suelo en el Área de Especial Interés Urbanístico (AEIU) de Porto Maravilha (2009-2024), mediante instrumentación geotecnológica de teledetección. La geoinformación, derivada de los índices espectrales NDVI y NDBI (Landsat), reveló dos períodos distintos. El primero (2009-2016) se caracteriza por el incremento del NDBI y el decremento del NDVI, indicando densificación constructiva y supresión de vegetación. El segundo período (2017-2024) presentó la estabilización de las superficies antrópicas. La correlación negativa entre los índices validó el aumento de áreas construidas en detrimento de áreas verdes. Palabras clave: teledetección, cobertura del suelo, Porto Maravilha |
1 Introduction
The use of Remote Sensing (RS) for the acquisition of detailed and accurate information about the Earth’s surface has increased significantly with the advancement of its technologies, being considered an indispensable tool for the management and planning of urban regions (Herold; Scepan; Clarke, 2002). The use of satellite imagery and Geographic Information Systems (GIS) enhances the ability to detect complex changes in terrestrial landscapes, offering a low-cost and highly effective methodology when compared to traditional monitoring methods (Roy; Bari, 2022; Liu, 2023). The relevance of this technology is amplified in a context in which data such as land cover and land use, land consumption, surface temperature, and air pollution can be freely obtained from online repositories (Shumilo et al., 2021).
Historically, the use of aerial photographs was one of the first data sources for mapping urban green areas. The application of spectral indices such as the Normalized Difference Vegetation Index (NDVI), derived from Landsat images between the 1970s and 1990s, enabled the quantification of vegetation “greenness” (Liu, 2023). Built-up areas, in turn, have been quantified using the Normalized Difference Built-up Index (NDBI). Recent studies have indicated the potential of this index to identify urban expansion, the conversion of green areas, and its correlation with land surface temperature (Roy; Bari, 2022; Arif; Toersilowati, 2024; Cetin et al., 2024; Drešković; Dug; Osmanovic, 2024).
Within the scope of urban studies based on long-term time series, the choice of satellite necessarily involves a balance between spatial resolution, temporal coverage, and radiometric consistency. In this study, the integrated use of images from the Landsat 5, Landsat 7, and Landsat 8 satellites allowed the analysis of changes in land cover in the Special Urban Planning Interest Area (in Portuguese: Área de Especial Interesse Urbanístico - AEIU) of Porto Maravilha, which occurred as a result of infrastructure works initiated in 2009 and promoted to meet the demands of major sporting events hosted in the city of Rio de Janeiro, such as the 2014 World Cup and the 2016 Olympic Games.
Therefore, the objective of this study was to analyze land cover change in the Porto Maravilha AEIU from 2009 to 2024 using RS data. To this end, the NDVI and NDBI indices were adopted in order to understand the variation in the correlation between them over the temporal period, indicating possible scenarios of densification of anthropogenic surfaces and suppression of urban vegetation as consequences of the intense structural interventions in the landscape.
2 Urban and landscape transformations in the port region of Rio de Janeiro: A brief historical approach
The port region of Rio de Janeiro constitutes an emblematic space in the city’s urban and social history. Since the colonial period, this area, mainly composed of the neighborhoods of Saúde, Gamboa, and Santo Cristo, has been central to the formation of Rio de Janeiro’s urban core and to the economic development of the capital. It hosted docks, the Valongo market, and a significant population of enslaved and freed workers, who shaped its cultural and identity-based practices (Silva; Silva, 2014). This Afro-Brazilian and working-class heritage profoundly marked the territory, giving it a fundamental role in the constitution of “Pequena África” (Little Africa), the cradle of manifestations such as samba and Candomblé.
Throughout the nineteenth century, with the expansion of coffee production and the modernization of Brazilian ports, Rio de Janeiro consolidated itself as the country’s main commercial center. The urban reforms undertaken during the administration of Pereira Passos (1902–1906) introduced a new spatial order, opening avenues, demolishing tenements, and redesigning the waterfront in the name of modernity and the “sanitation” of the city (Monié; Silva, 2015; Colchete Filho; Costa; Jesus, 2019). These interventions, however, resulted in intense social segregation, pushing lower-income populations toward urban fringes and the hills adjacent to the port zone.
From the second half of the twentieth century onward, the region entered a process of decline. The modernization of maritime transport systems, the use of containers, and deindustrialization led to economic emptying of the area, aggravated by the construction of the Perimetral Elevated Highway, which physically isolated the port from the rest of the city (Silva; Silva, 2014; Colchete Filho; Costa; Jesus, 2019). The result was the obsolescence of large spaces and the abandonment of historic buildings, even in areas protected by the SAGAS Project and by urban conservation legislation.
The turn of the twenty-first century marked the return of public and private interest in the region. The launch of the Porto Maravilha project in 2009 inserted Rio de Janeiro into the global logic of large urban projects (Sarue, 2018) and waterfront developments (Monié; Silva, 2015), which articulate the State and financial-real estate capital through public–private partnerships. Inspired by the reforms of Barcelona and Buenos Aires, the project proposed the requalification of the port zone through the Urban Consortium Operation (Complementary Law No. 101/2009), with substantial investments in infrastructure, mobility, and cultural facilities, such as the Museum of Tomorrow and the Rio Art Museum, as well as the demolition of the Perimetral Elevated Highway and the implementation of the Light Rail Vehicle (VLT) system (Ferreira; Pizzolante; Viriato, 2024).
These transformations profoundly altered the urban landscape and the city’s collective imagination. The region, once marginalized, became a showcase of strategic planning and tourism, marked by new architectural symbols and the landscape treatment of the Olympic Boulevard (Carlos, 2020). However, the process revealed contradictions: gentrification and rising land values restricted access for traditional populations, threatening the permanence of historic communities in the neighborhoods of Saúde and Gamboa (Carlos, 2020). Urban revitalization, rather than promoting an “integrated conservation” that aligned heritage, housing, and inclusion, ultimately reinforced the mercantile character of the city, subordinated to the neoliberal logic of spectacle and real estate valorization (Harvey, 2005; Jacques, 2003 apud Carlos, 2020).
As pointed out by Ferreira, Pizzolante, and Viriato (2024), Porto Maravilha should be understood as part of a broader metropolitan dynamic in which urban space is produced as a commodity and guided by financial strategies and control policies. From this perspective, the current port landscape expresses both continuities, such as the economic and symbolic centrality of the port, and ruptures, by representing a new form of urbanization marked by inequalities, spectacularization, and spatial selectivity.
Thus, the history of Rio de Janeiro’s port region reveals a trajectory of constant urban and landscape reconfigurations, in which modernization has often meant exclusion. From the old colonial wharf to the contemporary “Porto Maravilha,” this territory remains a mirror of the tensions between memory and market, between heritage and capital. Recognizing these historical layers is fundamental to envision more inclusive and sustainable futures for an area that, more than being requalified, needs to be truly reintegrated into the city and its population.
3 Materials and methods
The present study is configured as a quantitative case study, with a spatio-temporal analysis approach. The methodology was fundamentally based on remote sensing techniques, geoprocessing, and exploratory statistical analysis for monitoring land cover change in the Porto Maravilha AEIU.
3.1 Study area
The study area addressed in this research corresponds to the Special Urban Planning Interest Area (AEIU) of Porto Maravilha (Figure 1), whose perimeter was formally established by Complementary Law No. 101/2009. This law instituted the Urban Consortium Operation (OUC) of the Port of Rio de Janeiro region and adjacent areas within the AEIU, comprising a set of coordinated interventions led by the Municipality and other entities of the Municipal Public Administration, with the participation of landowners, residents, users, and investors, aiming to achieve structural urban transformations, social improvements, and environmental enhancement in the region.
According to the Municipal Master Plan, an AEIU is an area “intended for specific projects of structuring or restructuring, urban renewal, and revitalization.” The purpose of the OUC, as stated in Article 2 of the aforementioned law, is to “promote the urban restructuring of the AEIU through the expansion, articulation, and requalification of public open spaces, aiming at improving the quality of life of its current and future residents.”
The total area of the operation covered nearly 500 square hectares, fully encompassing the historic neighborhoods of Gamboa, Santo Cristo, and Saúde, as well as portions of Caju, Centro, Cidade Nova, São Cristóvão, and Vasco da Gama. Prior to the project, the area was perceived as a degraded space, where the main physical barrier was the Perimetral Elevated Highway, whose demolition was one of the interventions foreseen in Annex II of the law.
Recently, the Porto Maravilha AEIU was expanded by Complementary Law No. 267/2023, encompassing localities not included in this study. The boundaries adopted in this research were obtained from the open data portal of the Municipality of Rio de Janeiro, DATA Rio.
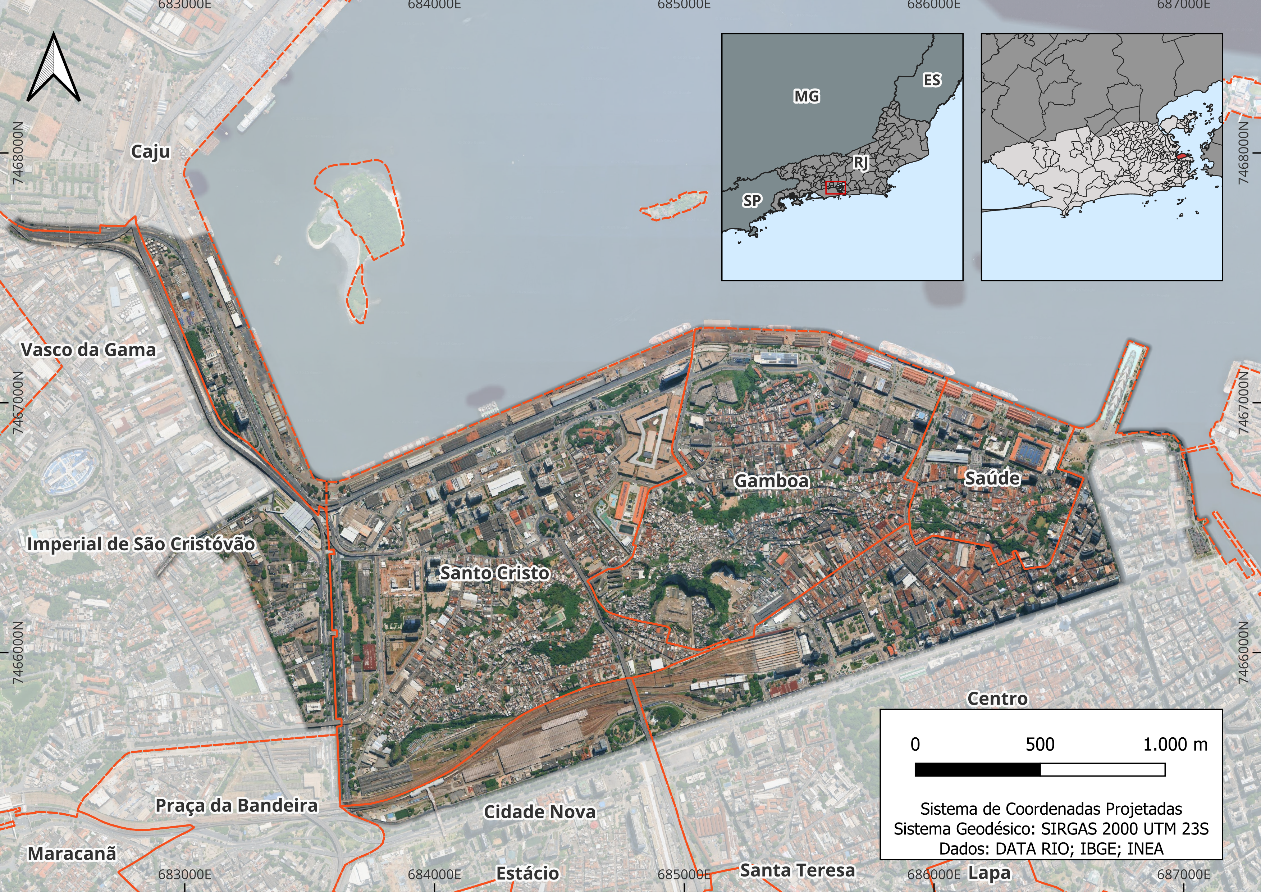
Figure 1: Location of the Porto Maravilha AEIU in the municipality of Rio de Janeiro.
Source: The authors.
3.2 Acquisition of orbital images and digital processing
The orbital image acquisition stage was conducted with the aim of ensuring continuous temporal coverage for the period of interest, corresponding to the years from 2009 to 2024, which spans from the beginning of construction works in the Porto Maravilha AEIU to the present. For this purpose, the Landsat 5 (TM), Landsat 7 (ETM+), and Landsat 8 (OLI/TIRS) satellites were selected, which together enabled the construction of a historical series of multispectral data with a spatial resolution of 30 meters.
The images were accessed through the Google Earth Engine (GEE) platform, using the LANDSAT/LT05/C02/T1_L2 collection for Landsat 5, the LANDSAT/LE07/C02/T1_L2 collection for Landsat 7, and the LANDSAT/LC08/C02/T1_L2 collection for Landsat 8.
In order to ensure comparability among years and sensors, a standardized pre-processing procedure was adopted in GEE. This procedure included: (i) filtering images by cloud cover (< 75% in critical years), (ii) application of a cloud and shadow masking function using QA_PIXEL, (iii) correction using official USGS scaling factors, and (iv) generation of annual composites using the median of pixels throughout the year. The result consisted of a set of annual images representative of the entire time series, clipped to the AEIU geometry and exported in GeoTIFF format.
3.3 Spectral band algebra
Although it is possible to perform algebraic operations between spectral bands directly within GEE, the calculations were carried out in QGIS 3.40 LT software, using the Raster Calculator tool. This choice was made due to the flexibility in handling the exported images and the possibility of maintaining an integrated environment with other stages of cartographic processing.
Two indices were selected for temporal analysis: the Normalized Difference Vegetation Index (NDVI) and the Normalized Difference Built-up Index (NDBI). Both are widely used in studies of urban dynamics and land occupation (Roy; Bari, 2022; Cetin et al., 2024), as they allow the discrimination of vegetated areas and anthropogenic surfaces, respectively.
NDVI was obtained from the ratio between the difference and the sum of reflectance values in the near-infrared (NIR) and red (RED) bands, according to Equation 1:
 (1)
(1)
NDBI was calculated from the ratio between the difference and the sum of the shortwave infrared (SWIR) and near-infrared (NIR) bands, according to Equation 2:
 (2)
(2)
Table 1 below specifies the band of each satellite used in the algebraic operations.
Table 1: Spectral band combinations for the indices.
Index | Landsat 5 and 7 | Landsat 8 |
1st Band | 2nd Band | 1st Band | 2nd Band |
NDVI | 4 | 31 | 5 | 4 |
NDBI | 5 | 4 | 6 | 5 |
Source: Adapted from Roy; Bari (2022).
3.4 Statistical analyses
To understand the relationship between the NDVI and NDBI indices, descriptive statistics and correlation analyses were conducted using R software, with the support of the raster package for geospatial data manipulation and ggplot2 for visualization. Correlation was calculated on a year-by-year basis, comparing pixel values from the NDBI raster image with the corresponding pixel values from the NDVI raster image. For this purpose, Pearson’s Correlation Analysis was employed to examine the interdependence and interrelationship in the distribution of these values. Pearson’s correlation coefficient (r) is expressed by the following formula:
 (3)
(3)
Where:
 = Pearson correlation coefficient;
 = Total number of sampled pixels;
 = Value of pixel i in the NDBI image;
 = Value of pixel i in the NDVI image;
 = Mean pixel value of the NDBI image;
 = Mean pixel value of the NDVI image.
4 Results
The analysis of the spectral index time series (2009–2024) made it possible to identify distinct patterns of land cover transformation in the Porto Maravilha AEIU, expressed by the inverse variations between NDBI and NDVI. The data reveal two markedly different periods in the spectral behavior of the urban landscape, as shown in Figure 2 below.

Figure 2: Temporal evolution of the mean NDBI and NDVI indices.
Source: The authors.
4.1 Period I – Intensive transformation (2009–2016)
The first interval characterizes the most dynamic phase of works of the Urban Consortium Operation, coinciding with the implementation of structural interventions and the demolition of the Perimetral Elevated Highway. Mean NDBI values show an increasing trend between 2009 (0.03) and 2014–2016 (0.04–0.05), while NDVI demonstrates a progressive decline over the same interval, decreasing from 0.18 (2009) to 0.14 (2012) and 0.15 (2014). This behavior evidences the replacement of vegetated surfaces by construction materials and paving, resulting in higher reflectance in the shortwave infrared and reduced response in the near-infrared.
The maximum NDBI peak in 2016 (0.61) reinforces the apex of physical transformations in the landscape and the densification of anthropogenic surfaces, while the expressive minimum of NDVI in the same year reflects the point of greatest vegetation suppression, as shown in Tables 2 and 3. The stronger negative correlation between both indices observed during this period indicates the process of direct conversion of vegetation cover into urbanized areas, as also reported by Roy and Bari (2022) and Yasin et al. (2022).
Table 2: Descriptive statistics of NDBI.
Year | Minimum | Maximum | Mean | Median | Standard Deviation |
2009 | -0.63 | 0.30 | 0.03 | 0.05 | 0.12 |
2010 | -0.68 | 0.32 | 0.02 | 0.04 | 0.13 |
2011 | -0.63 | 0.32 | 0.03 | 0.05 | 0.12 |
2012 | -0.76 | 0.33 | 0.05 | 0.07 | 0.12 |
2013 | -0.43 | 0.42 | 0.04 | 0.06 | 0.10 |
2014 | -0.46 | 0.35 | 0.05 | 0.06 | 0.11 |
2015 | -0.46 | 0.30 | 0.04 | 0.06 | 0.09 |
2016 | -0.49 | 0.61 | 0.03 | 0.04 | 0.10 |
2017 | -0.52 | 0.56 | 0.04 | 0.04 | 0.10 |
2018 | -0.53 | 0.30 | 0.03 | 0.04 | 0.11 |
2019 | -0.51 | 0.34 | 0.02 | 0.03 | 0.11 |
2020 | -0.53 | 0.63 | 0.03 | 0.04 | 0.12 |
2021 | -0.56 | 0.64 | 0.02 | 0.03 | 0.11 |
2022 | -0.53 | 0.30 | 0.02 | 0.03 | 0.12 |
2023 | -0.48 | 0.39 | 0.01 | 0.02 | 0.11 |
2024 | -0.49 | 0.32 | 0.02 | 0.03 | 0.11 |
Source: The authors.
4.2 Period II – Stabilization and relative recovery (2017–2024)
From 2017 onward, a change in the variation pattern of the indices can be observed. NDBI stabilizes with mean values between 0.02 and 0.04, suggesting the consolidation of built-up areas and a reduction in new urban expansions. In parallel, NDVI shows signs of gradual recovery, especially after 2018, with mean values reaching 0.20–0.21 in 2022–2023. This positive trend may be associated with landscape requalification and the creation of public green spaces, such as squares and tree-lined corridors, planned in the reurbanization project.
Table 3: Descriptive statistics of NDVI.
Year | Minimum | Maximum | Mean | Median | Standard Deviation |
2009 | -0.29 | 0.75 | 0.18 | 0.15 | 0.14 |
2010 | -0.30 | 0.78 | 0.19 | 0.16 | 0.15 |
2011 | -0.29 | 0.72 | 0.16 | 0.14 | 0.12 |
2012 | -0.27 | 0.73 | 0.14 | 0.12 | 0.12 |
2013 | -0.60 | 0.81 | 0.17 | 0.15 | 0.15 |
2014 | -0.65 | 0.80 | 0.15 | 0.14 | 0.15 |
2015 | -0.53 | 0.79 | 0.16 | 0.13 | 0.14 |
2016 | -0.70 | 0.81 | 0.17 | 0.14 | 0.15 |
2017 | -0.52 | 0.82 | 0.17 | 0.15 | 0.15 |
2018 | -0.43 | 0.88 | 0.19 | 0.16 | 0.16 |
2019 | -0.38 | 0.85 | 0.20 | 0.17 | 0.15 |
2020 | -0.79 | 0.88 | 0.19 | 0.17 | 0.18 |
2021 | -0.80 | 0.89 | 0.19 | 0.17 | 0.18 |
2022 | -0.45 | 0.86 | 0.21 | 0.18 | 0.17 |
2023 | -0.53 | 0.84 | 0.21 | 0.18 | 0.17 |
2024 | -0.51 | 0.82 | 0.19 | 0.16 | 0.16 |
Source: The authors.
The spatial distribution maps of the indices (Figures 3 and 4) allow visualization of the progressive replacement of vegetated areas by anthropogenic surfaces. In general, higher NDVI values were concentrated in the central portion of the AEIU.
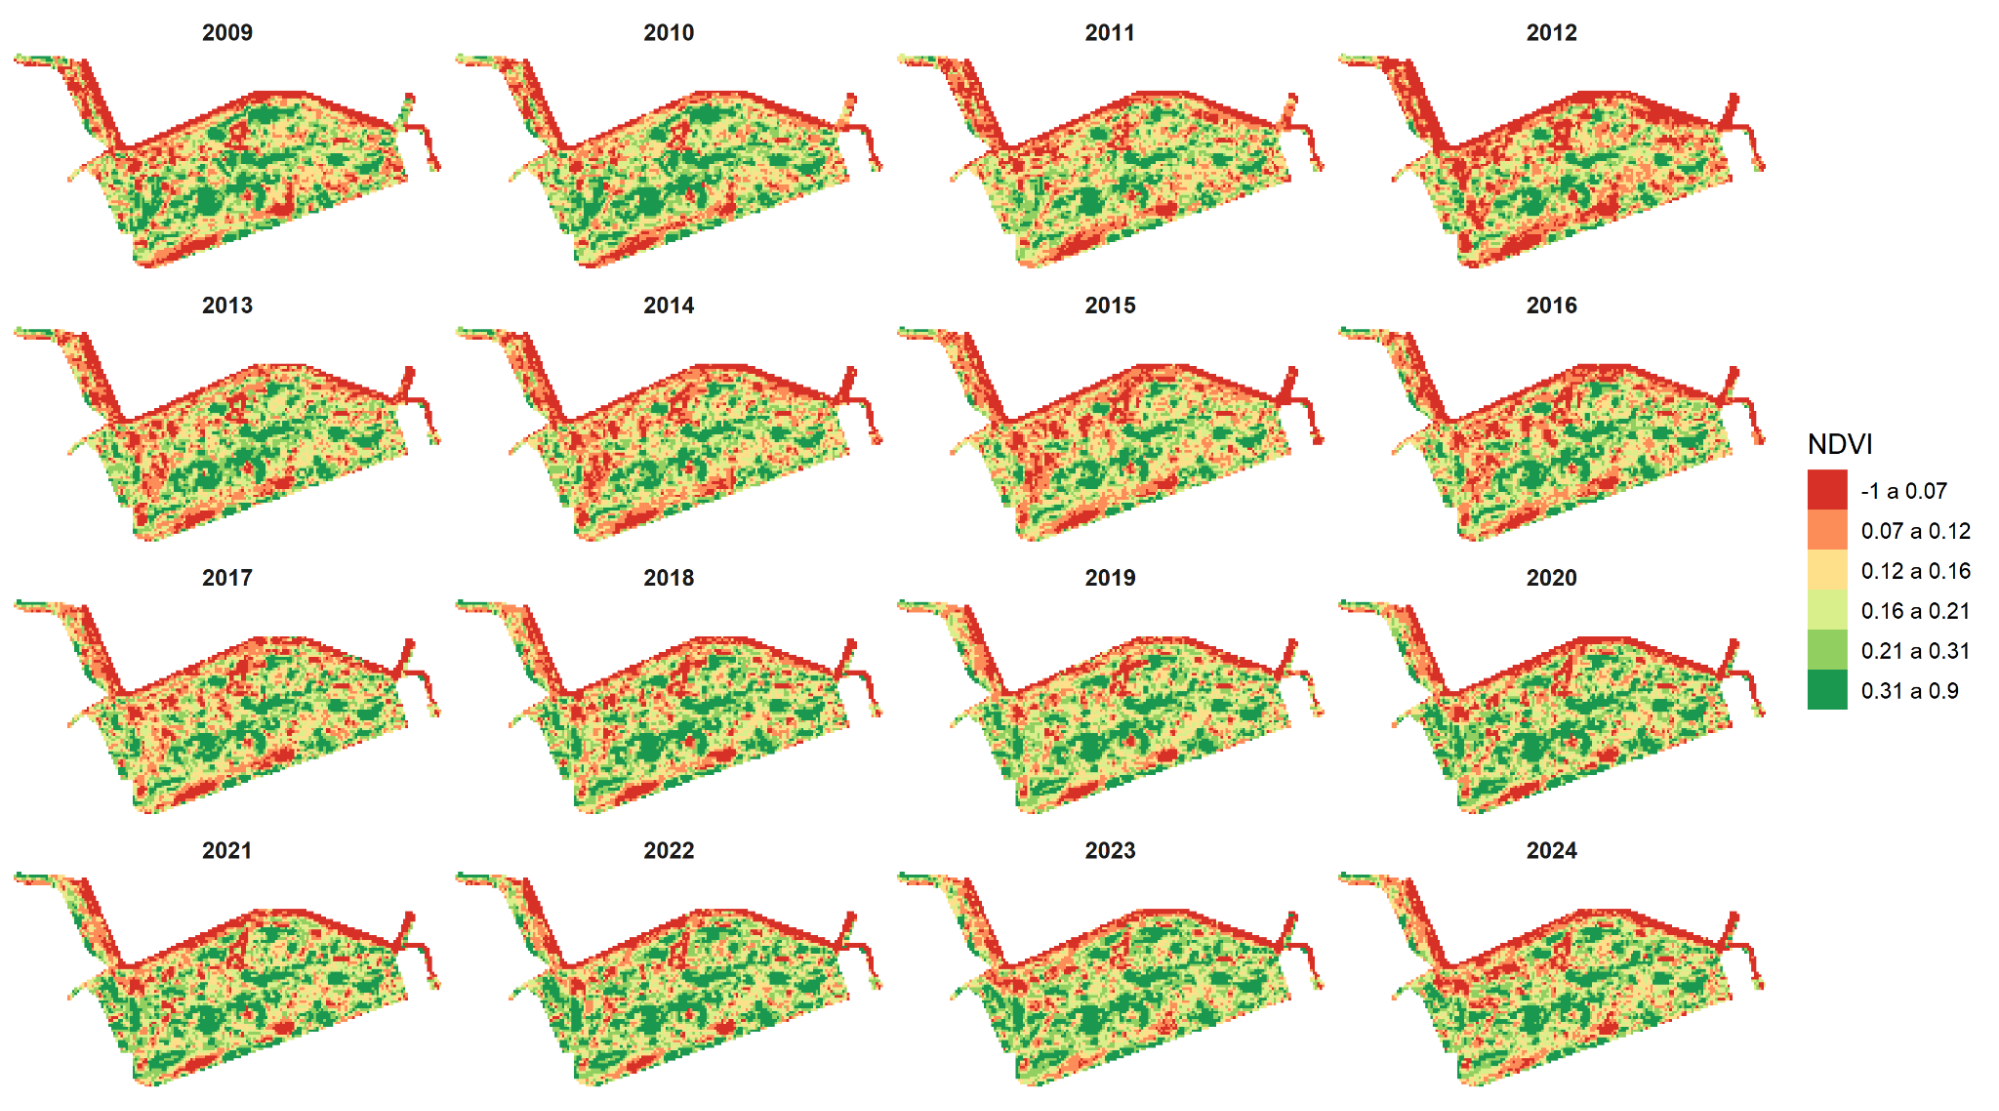 Figure 3: Spatial distribution of the NDVI index in the Porto Maravilha AEIU (2009–2024).
Source: The authors.
In 2012, a possible reduction of green areas can be observed along the vicinity of Avenida Rodrigues Alves and the port axis crossed by the Marcelo Alencar and Rio 450 Anos tunnels, expressed by the concentration of negative index values in this section. In the same year, the spatial distribution of NDBI also reveals an advance of built-up surfaces toward the interior of the AEIU. After 2017, the homogenization of index values indicates stabilization of the urban fabric, with reduced dispersion of extreme values. Locally, NDVI patches intensify again in 2021 and 2023.
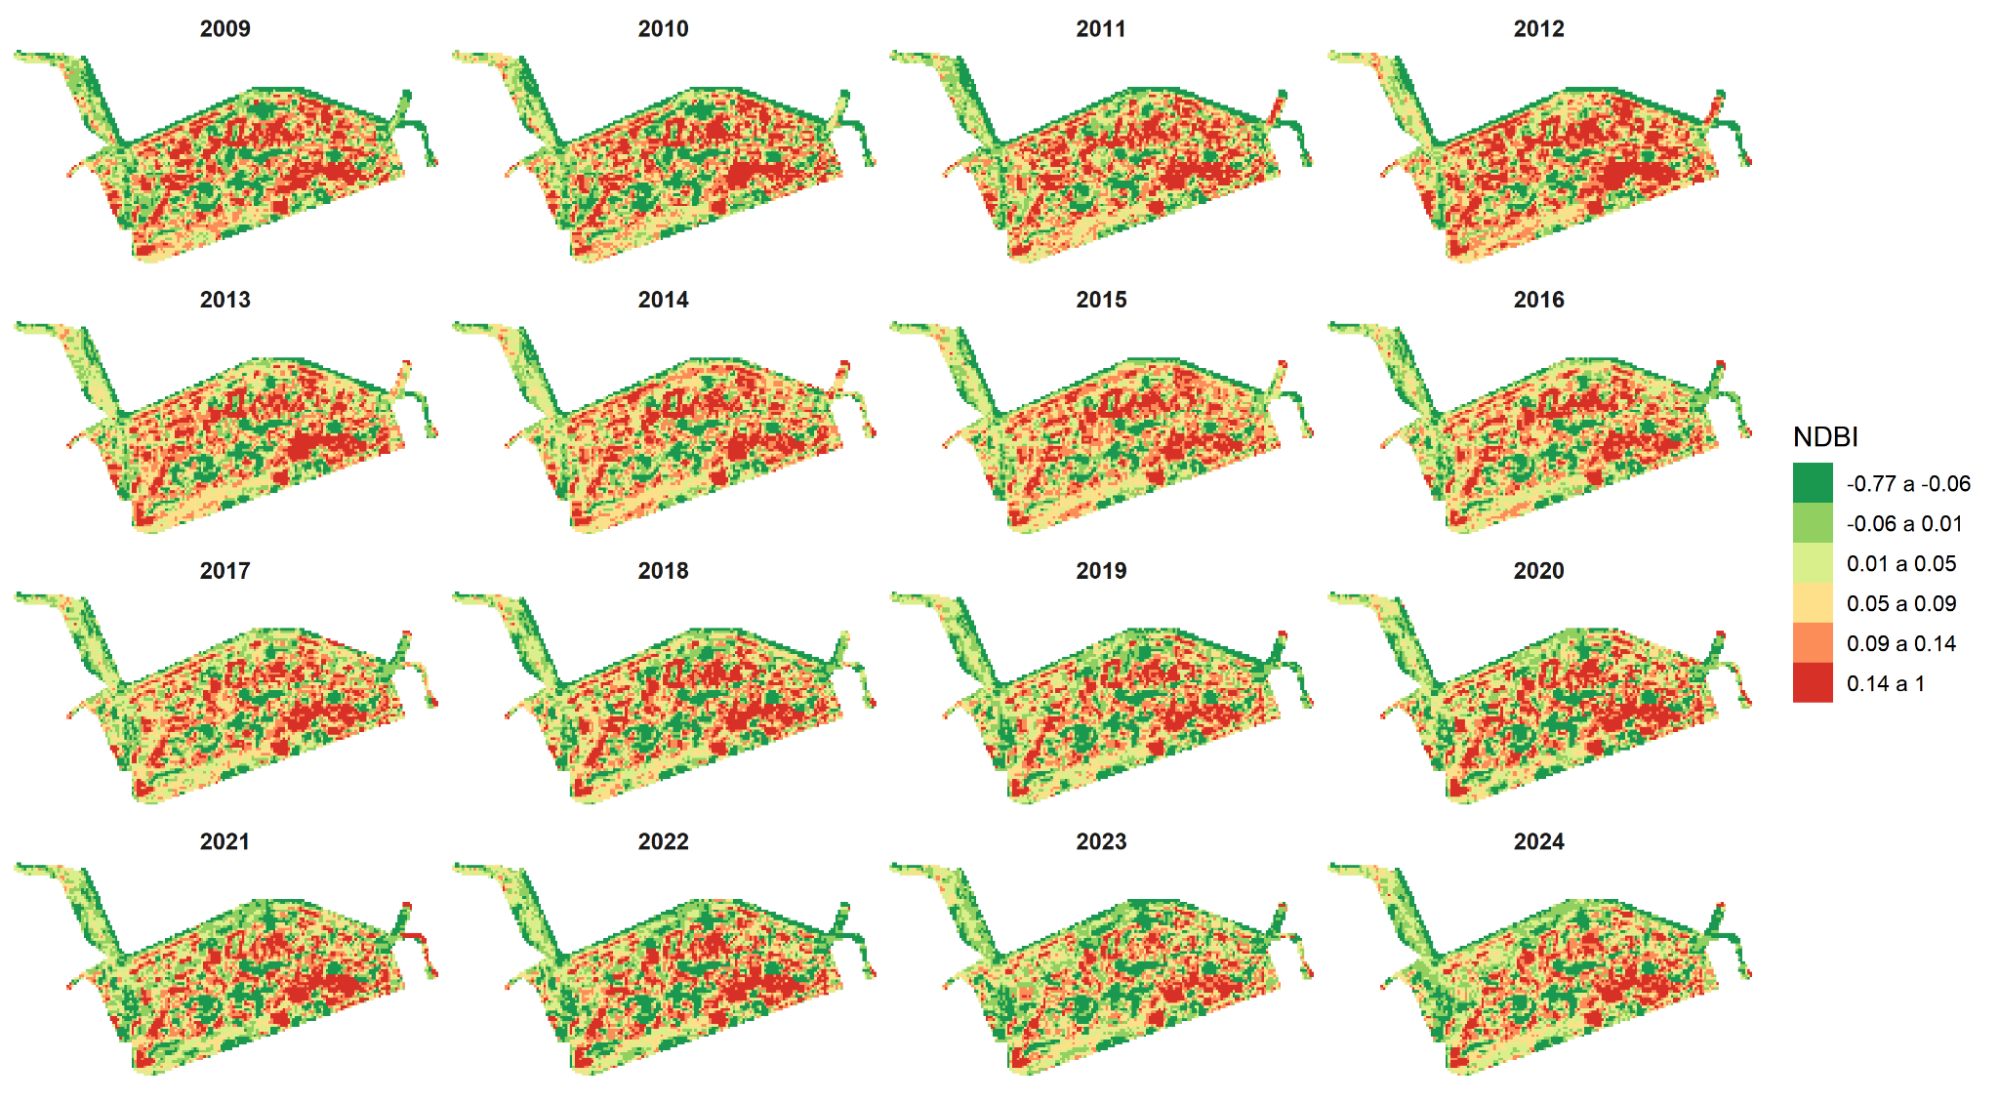
Figure 4: Spatial distribution of the NDBI index in the Porto Maravilha AEIU (2009–2024).
Source: The authors.
Figure 5 presents the histogram of pixel distribution for the NDBI index. The highest concentration of values occurred near zero, in the range between 0 and 0.20. A shift and increase of the bars toward more positive values to the right was observed over the years, until a point where there is also a renewed increase in values between −0.20 and 0, suggesting stabilization of land cover in these areas.
Figure 6, corresponding to NDVI, indicates a concentration of pixels in the value range between 0 and 0.25. However, histogram peaks are associated with values approximately between 0.10 and 0.15, which, according to França, Pereira, and Galvíncio (2012), indicate low vegetation cover under stress conditions, relatively sparse in nature.
As observed in Figure 3, higher NDVI values tend to be spatially distributed in the central zone of the AEIU, and this is not coincidental. This region contains relevant vegetation fragments located on Morro da Providência, Machado de Assis Park, the English Cemetery, around the Valongo Observatory (UFRJ), and in the section between Pinto and Nabuco de Freitas streets.
Outside this central area, slightly denser vegetation is observed over the Nina Rabha Tunnel, along Morro da Saúde, and at the São Bento Monastery. Urban tree cover occurs sporadically, with the presence of few individual trees.
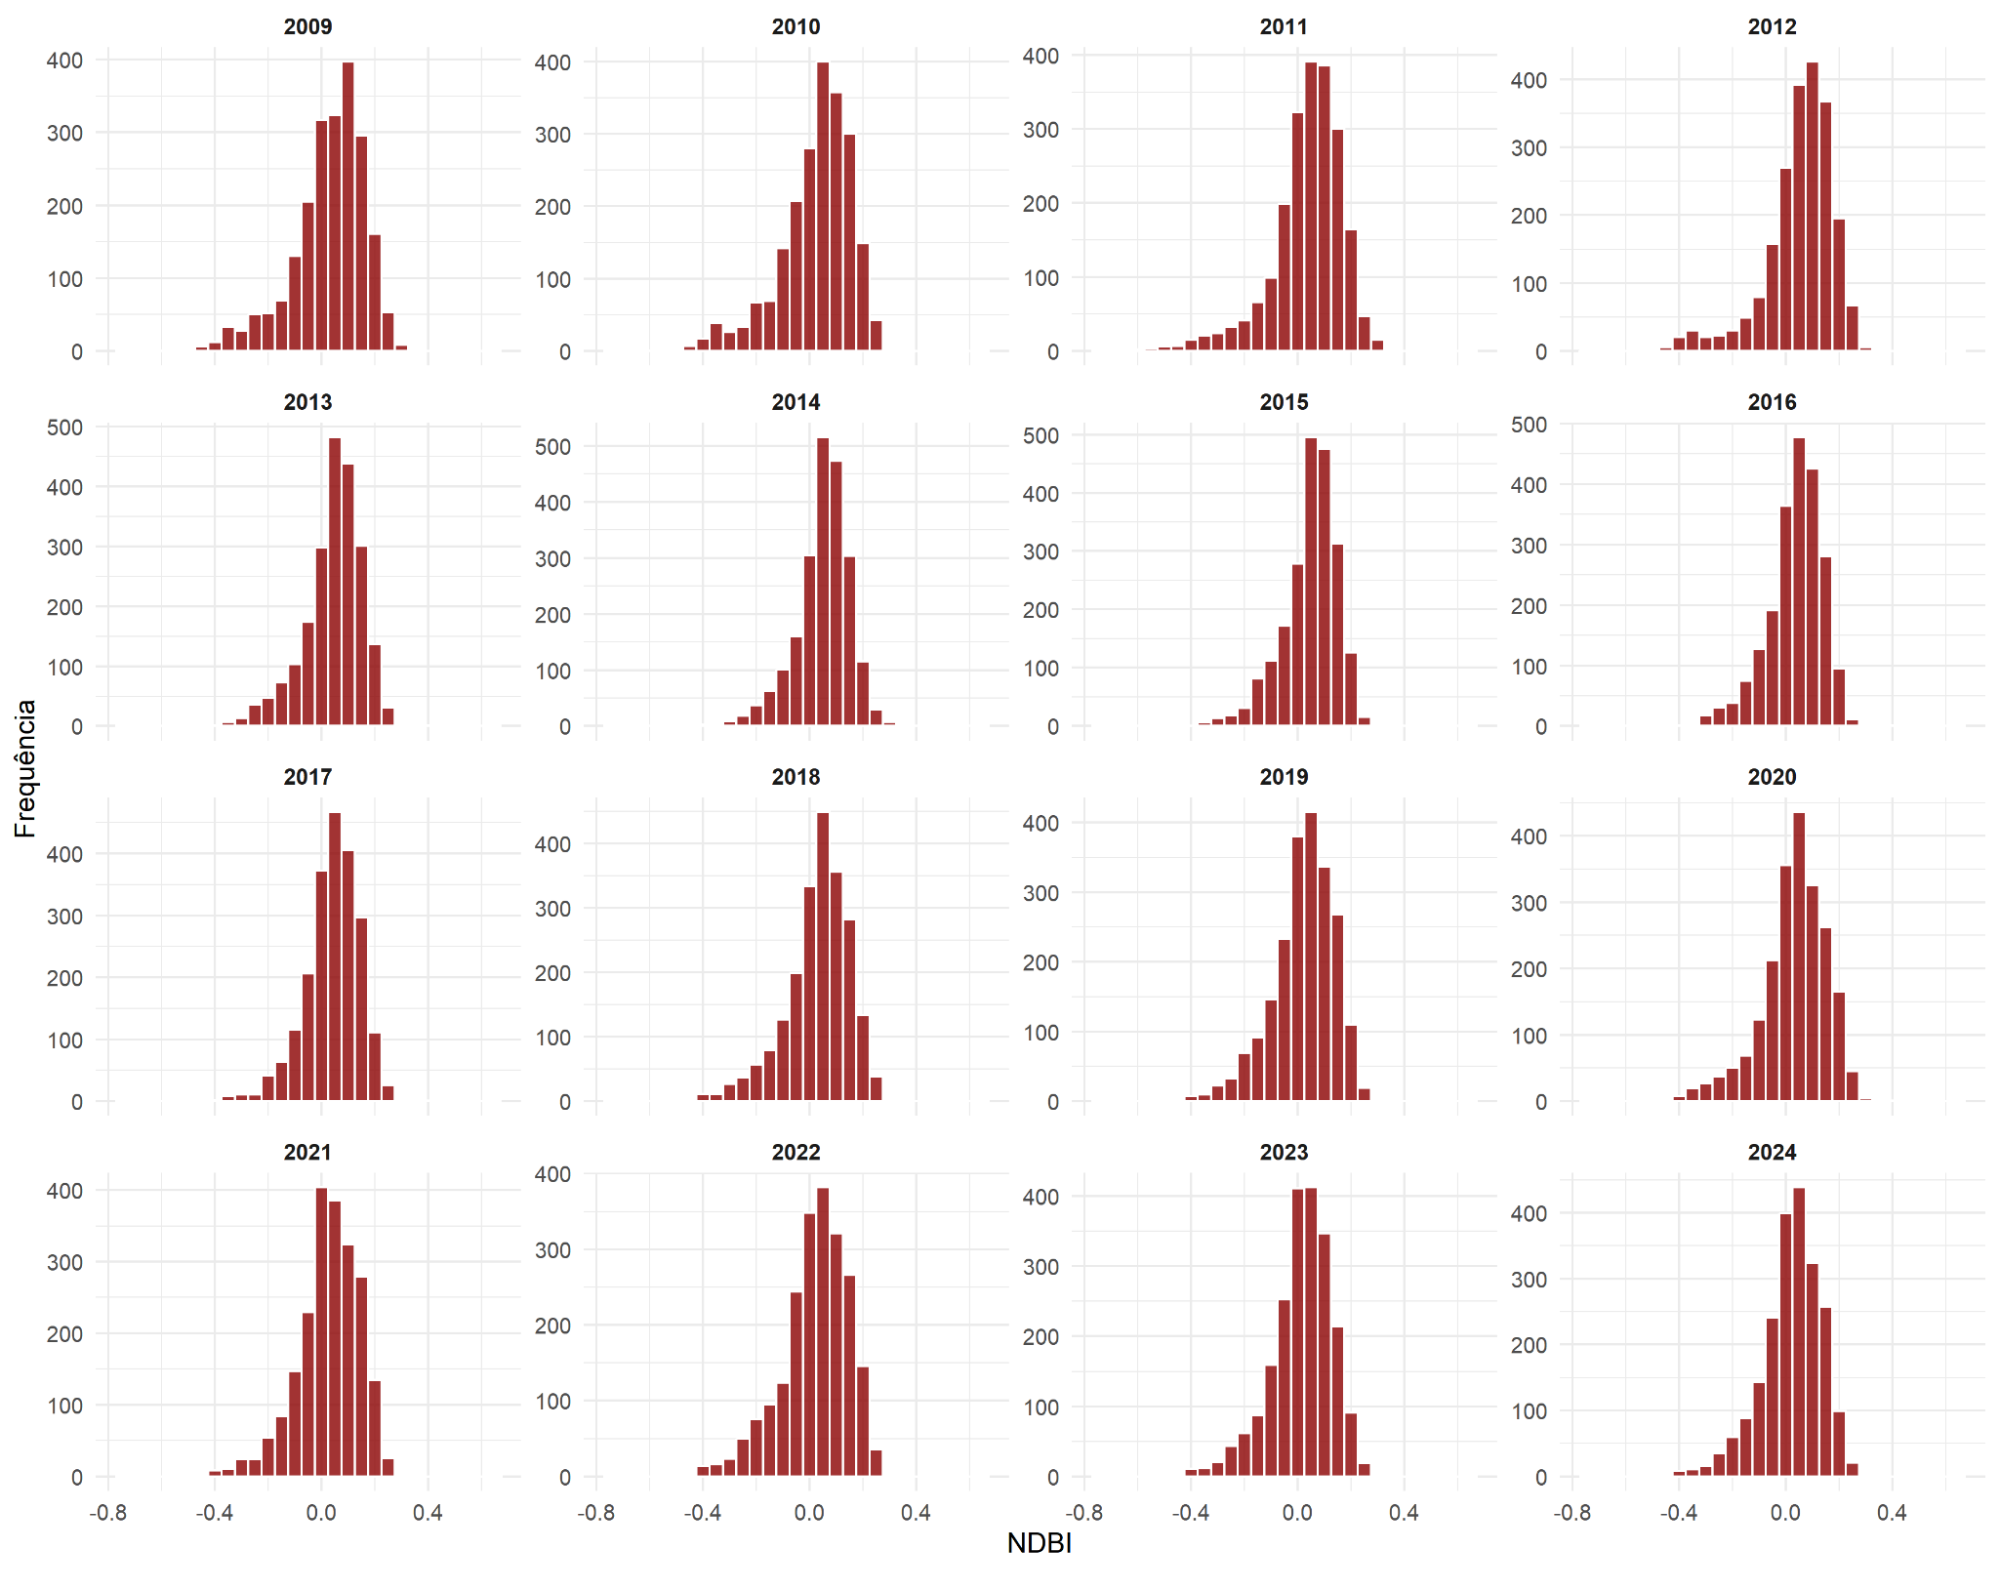
Figure 5: Histogram of pixel distribution for the NDBI index.
Source: The authors.
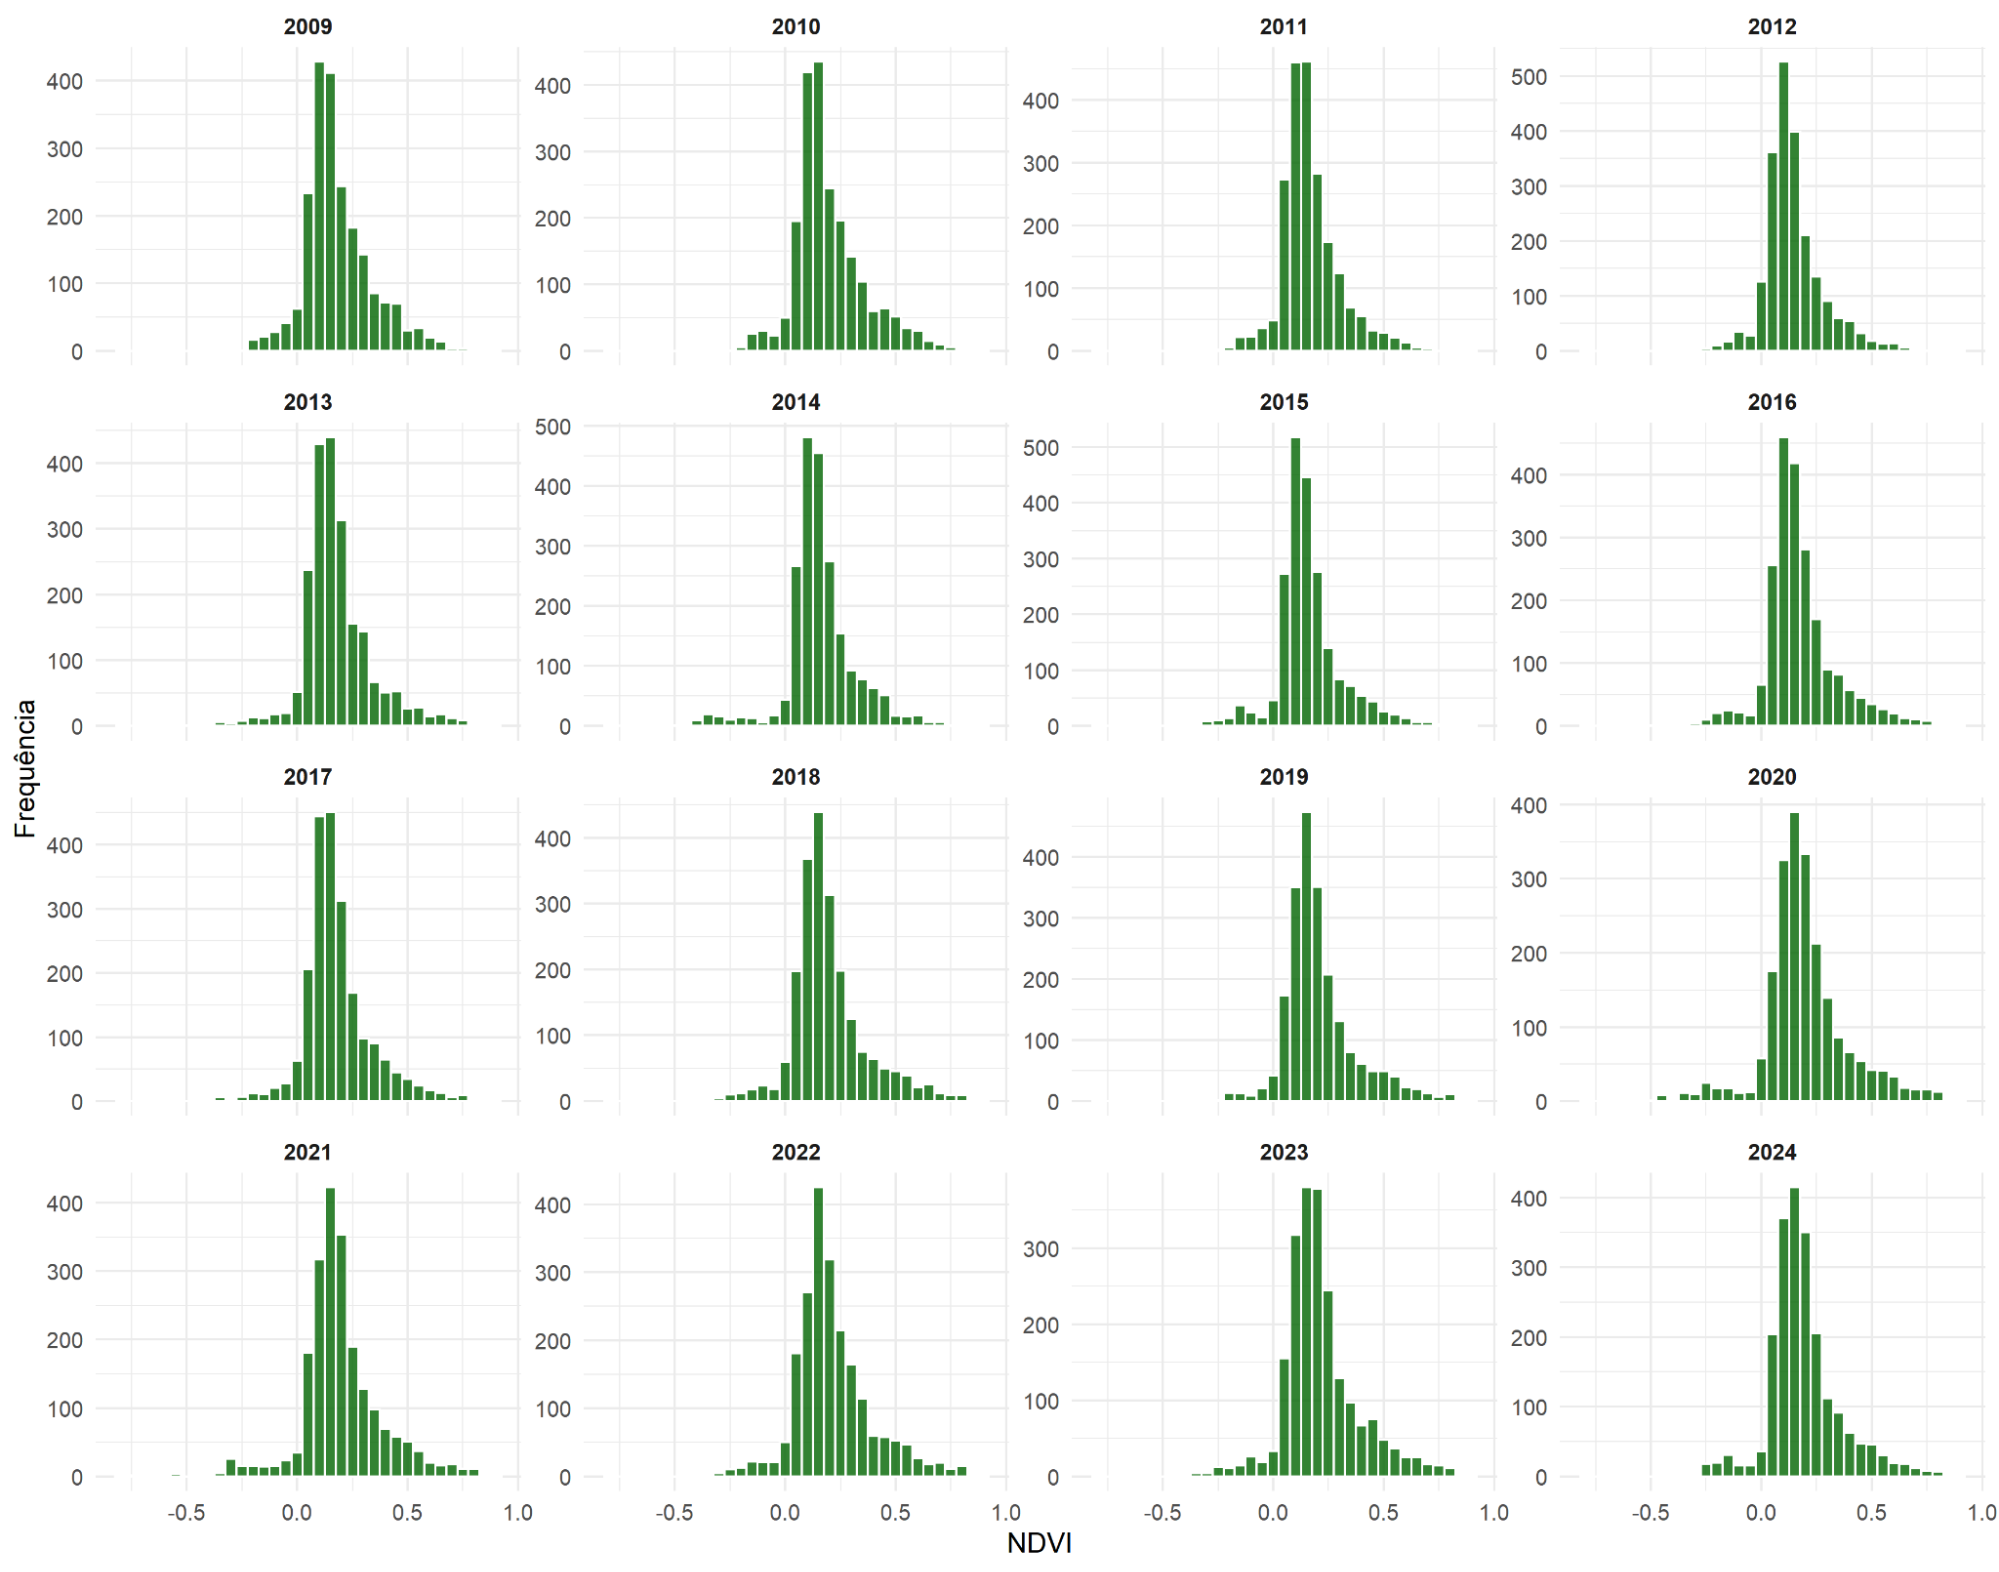
Figure 6: Histogram of pixel distribution for the NDVI index.
Source: The authors.
The inverse relationship between the two indices is confirmed by Pearson’s correlation analysis, which showed a negative correlation. This negative association between NDBI and NDVI is discussed as an indicator of the urbanization process and land cover replacement (Roy; Bari, 2022; Yasin et al., 2022).
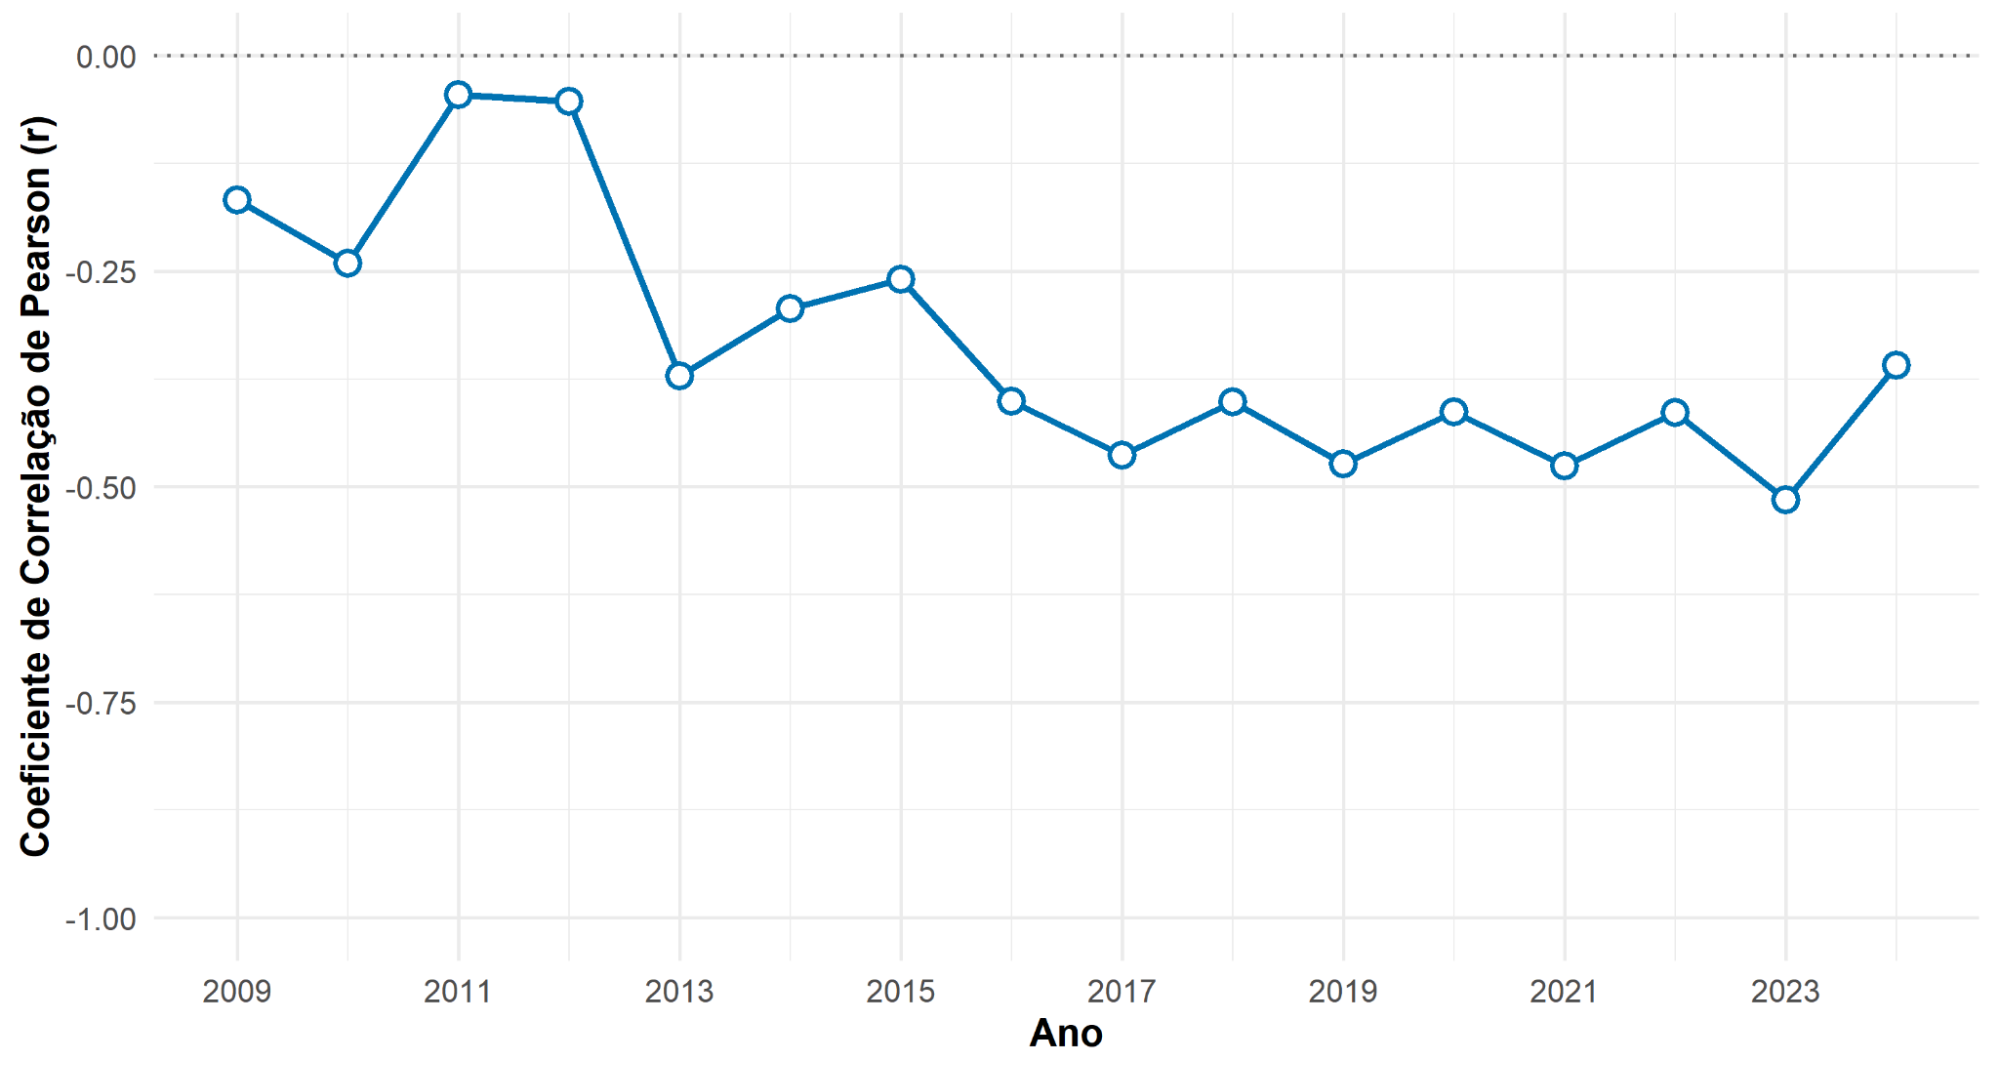
Figure 7: Evolution of the annual correlation between NDBI and NDVI (2009–2024).
Source: The authors.
Annual fluctuations in the strength of this correlation (ranging from weak to moderate) suggest that the replacement process was not linear, but occurred in bursts, corresponding to different phases of the project. These documented changes in land cover have direct environmental implications. Studies show that reductions in NDVI and increases in NDBI are strongly correlated with increases in Land Surface Temperature (LST), contributing to the intensification of urban heat islands (Luo, 2023; Drešković; Đug; Osmanović, 2024).
5 Conclusion
This study demonstrated the effectiveness of remote sensing for monitoring and quantitatively assessing land cover changes resulting from a large-scale urban intervention. The results confirmed the hypothesis that the implementation of the Porto Maravilha project promoted the densification of anthropogenic surfaces at the expense of green areas, mainly expressed during the period between 2009 and 2016, which corresponds to the most intense phase of construction activities.
The spatio-temporal analysis of this period provided objective evidence of the densification of built-up surfaces in the study area, reflected in the increase in NDBI values and the corresponding decrease in NDVI values.
The methodology employed, aligned with reference studies, proved to be a dynamic and efficient tool for outlining a preliminary diagnosis of landscape transformations, offering valuable data that not only document the physical impacts of the project but also allow inferences about its environmental consequences, such as changes in the local microclimate, as observed in other studies.
For future research, more detailed nuances of the variation in spectral indices in response to land cover changes within the AEIU could be accessed by increasing the sampling frequency, for example, by generating monthly compositions based on the median of pixel values instead of the annual composition adopted in this study.
However, this procedure would significantly increase the volume of generated data, from 32 to 384 raster images, requiring greater processing power and analytical capacity from researchers. The automation of batch routines, using tools such as PyQGIS in the Python terminal to perform spectral band algebra, would be a viable strategy to overcome the challenge of processing this large volume of data, thereby facilitating access to the resulting information.
References
ARIF, N.; TOERSILOWATI, L. Monitoring and predicting development of built-up area in sub-urban areas: A case study of Sleman, Yogyakarta, Indonesia. Heliyon, v. 10, n. 14, 2024. DOI: https://doi.org/10.1016/j.heliyon.2024.e34466
CARLOS, C. L. A outra face do Projeto Porto Maravilha: Área Portuária do Rio de Janeiro. Revista Latino-americana de Ambiente Construído & Sustentabilidade, v. 1, n. 2, 2020.
CETIN, M. et al. Determination of land surface temperature and urban heat island effects with remote sensing capabilities: the case of Kayseri, Türkiye. Natural Hazards, v. 120, [S.n.], 2024. DOI: https://doi.org/10.1007/s11069-024-06431-5
COLCHETE FILHO, A. F. .; COSTA, L. M. S. A. .; JESUS, K. D. de . Porto Maravilha-RJ: comércio, espetáculo e cidade. Tríades em Revista: Transversalidades, Design e Linguagens, [S. l.], v. 8, n. 1, p. 79–93, 2019.
DREŠKOVIĆ, N.; ĐUG, S.; OSMANOVIĆ, M. NDVI and NDBI Indexes as Indicators of the Creation of Urban Heat Islands in the Sarajevo Basin. Geographica Pannonica, v. 28, n. 1, p. 34-43, mar. 2024. DOI: 10.5937/gp28-48216
FERREIRA, A.; PIZZOLANTE, H.; VIRIATO, M. O projeto “Porto Maravilha” no Rio de Janeiro: inspiração em Barcelona, representações e produção a serviço do capital. Geo UERJ, n. 46, p. 2-5, 2024. DOI: 10.12957/geouerj.2024.86553
HARVEY, D. A produção capitalista do espaço. São Paulo: Annablume, 2005.
HEROLD, M.; SCEPAN, J.; CLARKE, K. C. The Use of Remote Sensing and Landscape Metrics to Describe Structures and Changes in Urban Land Uses. Environment and Planning A: Economy and Space, v. 34, n. 8, p. 1443-1458, 2002. DOI: 10.1068/a3496
LIU, Y. Application of remote sensing technology in smart city construction and planning. Journal of Physics: Conference Series. v, 2608, 2023. DOI 10.1088/1742-6596/2608/1/012052
LUO, J. Study on the Impact of MODIS-derived NDVI and NDBI on Land Surface Temperature. Highlights in Science, Engineering and Technology, [S. l.], v. 69, p. 249–258, 2023. DOI: 10.54097/hset.v69i.11911.
MONIÉ, F.; SANTOS DA SILVA, V. O projeto Porto Maravilha de revitalização da área portuária do Rio de Janeiro entre inovações e retrocessos na produção do espaço urbano. Revista Transporte y Territorio, Buenos Aires, n. 12, p. 110-126, 2015.
RIO DE JANEIRO (Cidade). Lei Complementar nº 101, de 23 de novembro de 2009. Modifica o Plano Diretor, autoriza o Poder Executivo a instituir a Operação Urbana Consorciada da Região do Porto do Rio e dá outras providências. Diário Oficial do Município, Rio de Janeiro, RJ, 24 nov. 2009. Available at: http://leis.org/cmisp. Accessed on: 15 aug. 2025.
RIO DE JANEIRO (Cidade). Lei Complementar nº 267, de 20 de dezembro de 2023. Altera a Lei Complementar nº 101, de 23 de novembro de 2009, para expandir a Operação Urbana Consorciada da Região do Porto do Rio de Janeiro e a Lei nº 5.780, de 22 de julho de 2014, e dá outras providências, 2023. Available at: http://leis.org/10gd3. Accessed on: 15 oct. 2025.
RIO DE JANEIRO (Cidade). AEIU - Porto Maravilha: Área de Especial Interesse Urbanístico do Porto Maravilha. Rio de Janeiro: Data.Rio, [S.d.]. Available at: https://www.data.rio/datasets/aeiu-porto-maravilha/explore. Accessed on: 15 oct. 2025.
ROY, B.; BARI, E. Examining the relationship between land surface temperature and landscape features using spectral indices with Google Earth Engine. Heliyon, v. 8, e10668, 2022. DOI: 10.1016/j.heliyon.2022.e10668
SARUE, B. Quando grandes projetos urbanos acontecem? Uma análise a partir do Porto Maravilha no Rio de Janeiro. Revista Dados, v. 61, n. 3, p. 581-616, 2018. DOI: 10.1590/001152582018168
SHUMILO, L. et al. Remote Sensing Data usage for Smart City Greening Strategy Planning. IEEE EUROCON 2021 - 19th International Conference on Smart Technologies. Lviv, Ukraine, 2021, p. 92-97, doi: 10.1109/EUROCON52738.2021.9535595
SILVA, M. R.; SILVA, M. L. A transformação espacial da Zona Portuária do Rio de Janeiro: o projeto Porto Maravilha como instrumento de segregação espacial. In: Congresso Brasileiro de Geógrafos, 7., 2014, Vitória. Anais [...]. Vitória: AGB, 2014.
YASIN, M. Y. et al.. Landsat observation of urban growth and land use change using NDVI and NDBI analysis. In: IOP Conference Series: Earth and Environmental Science, v. 1067, 012037, 2022. DOI: 10.1088/1755-1315/1067/1/012037
ZHA, Y.; GAO, J.; NI, S. Use of normalized difference built-up index in automatically mapping urban areas from TM imagery. International Journal of Remote Sensing, v. 24, n. 3, p. 583-594, 2003. DOI: 10.1080/01431160304987
About the Authors
Ayrton Durães Manso is a Geographer graduated from the Federal University of Rio de Janeiro (UFRJ), a specialist in Environmental Management from the Federal Institute of Rio de Janeiro (IFRJ), holds a Master’s degree in Geography from the State University of Rio de Janeiro (UERJ), and is currently a PhD candidate in the Graduate Program in Geosciences (UERJ). He conducts research in the areas of remote sensing, geoprocessing, and hydrological modeling, with a focus on surface runoff and erosion on urban slopes. He also works on environmental monitoring and territorial management projects linked to the Piabanha Committee.
Caio Gabriel Santana Bacelar is a Geographer graduated from the State University of Rio de Janeiro (UERJ), with an emphasis on Pedology. He is currently an undergraduate student in Geophysics at the Fluminense Federal University (UFF).
Alexandra de Souza Rodrigues holds a degree in History from the Federal University of the State of Rio de Janeiro (UNIRIO). She conducts research in the field of Brazilian History, focusing on slavery, the experiences of enslaved women and children, and the dynamics of freedom in the eighteenth and nineteenth centuries.
Hugo Portocarrero is a Geographer graduated from the State University of Rio de Janeiro (UERJ), holds a Master’s degree in Physical Geography from the Federal University of Rio de Janeiro (UFRJ), a PhD in Civil Engineering/Geotechnics from the Pontifical Catholic University of Rio de Janeiro (PUC-Rio), and a postdoctoral degree in Civil Engineering/Geotechnics from the Pontifical Catholic University of Rio de Janeiro (PUC-Rio). He is an Associate Professor in the Department of Applied Geology at the Faculty of Geology of UERJ and a permanent faculty member of the National Network Professional Master’s Program in Water Resources Management and Regulation (ProfÁgua).
Pablo Ritto Koehler is a Geographer graduated from the Federal University of Santa Catarina (UFSC) and holds a Master’s degree in Environmental Engineering from the Federal University of Santa Catarina (UFSC). He is Director of Operations at the Carioca Partnerships and Investments Company (CCPar).
Author Contributions
Conceptualization, [A.D.M., C.G.S.B.]; methodology, [A.D.M.]; software, [A.D.M.]; validation, [A.D.M., H.P.]; formal analysis, [A.D.M.]; investigation, [A.D.M., C.G.S.B.]; data curation, [A.D.M.]; writing—original draft preparation, [A.D.M., A.S.R.]; writing—review and editing, [A.D.M., C.G.S.B., A.S.R., H.P.]; supervision, [H.P., P.R.K.]. All authors have read and agreed to the published version of the manuscript.
Conflicts of Interest
The authors declare no conflicts of interest.
About Coleção Estudos Cariocas
Coleção Estudos Cariocas (ISSN 1984-7203) is a publication dedicated to studies and research on the Municipality of Rio de Janeiro, affiliated with the Pereira Passos Institute (IPP) of the Rio de Janeiro City Hall.
Its objective is to disseminate technical and scientific production on topics related to the city of Rio de Janeiro, as well as its metropolitan connections and its role in regional, national, and international contexts. The collection is open to all researchers (whether municipal employees or not) and covers a wide range of fields — provided they partially or fully address the spatial scope of the city of Rio de Janeiro.
Articles must also align with the Institute’s objectives, which are:
- to promote and coordinate public intervention in the city’s urban space;
- to provide and integrate the activities of the city’s geographic, cartographic, monographic, and statistical information systems;
- to support the establishment of basic guidelines for the city’s socioeconomic development.
Special emphasis will be given to the articulation of the articles with the city's economic development proposal. Thus, it is expected that the multidisciplinary articles submitted to the journal will address the urban development needs of Rio de Janeiro.