
Volume 13 Issue 4 *Corresponding author evelyncastroporto@gmail.com Submitted 13 Nov 2025 Accepted 19 Jan 2026 Published 28 Jan 2026 Citation COSTA, E. C. P.; VICENS, R. S. Wetlands of the Municipality of Rio de Janeiro: characterization and flooding regime of Carioca marsh landscapes. Coleção Estudos Cariocas, v. 13, n. 4, 2026.
DOI 10.71256/19847203.13.4.191.2025 The article was originally submitted in PORTUGUESE. Translations into other languages were reviewed and validated by the authors and the editorial team. Nevertheless, for the most accurate representation of the subject matter, readers are encouraged to consult the article in its original language.


| Wetlands of the Municipality of Rio de Janeiro: characterization and flooding regime of Carioca marsh landscapes Os wetlands do município do Rio de Janeiro: caracterização e regime de inundação das paisagens pantanosas cariocas Los humedales del municipio de Río de Janeiro: caracterización y régimen de inundación de los paisajes pantanosos cariocas Evelyn de Castro Porto Costa1 and Raúl Sánchez Vicens2 1Universidade do Estado do Rio de Janeiro (UERJ), Rua Arízio Gomes da Costa, s/n - Jardim Flamboyant, Cabo Frio - RJ, ORCID 0000-0001-7648-6949, evelyncastroporto@gmail.com 2Universidade Federal Fluminense (UFF), Av. Gal. Milton Tavares de Souza, s/nº. BLOCO O, Campus da Praia Vermelha Boa Viagem – Niterói/RJ, ORCID 0000-0002-4429-806X, rsvicens@id.uff.br
AbstractThis research addresses the multitemporal identification and classification of wetlands in the municipality of Rio de Janeiro, using images from Sentinel-1 (SAR) and Sentinel-2 (optical) satellites integrated through the Random Forest machine learning algorithm. The results indicate that approximately 13% of Rio de Janeiro's territory is composed of permanently or seasonally flooded areas, predominantly located in coastal plains and bays. The research highlights the ecological relevance of wetlands in water regulation, biodiversity, and climate change mitigation, emphasizing the need to delineate these areas for city planning and management purposes. Keywords: wetlands, random forest, flood regime ResumoA pesquisa aborda a identificação e classificação multitemporal dos wetlands do município do Rio de Janeiro, utilizando imagens dos satélites Sentinel-1 (SAR) e Sentinel-2 (óptico) integradas por meio do algoritmo de aprendizado de máquina Random Forest. Os resultados indicam que cerca de 13% do território carioca é composto por áreas inundadas de forma permanente ou sazonal, predominantemente localizada nas áreas planícies costeiras e baías. A pesquisa evidencia a relevância ecológica dos wetlands na regulação hídrica, na biodiversidade e na mitigação das mudanças climáticas, ressaltando a necessidade de delimitação desses objetos para fins de planejamento e gestão da cidade. Palavras-chave: áreas úmidas, random forest, regime de inundação
ResumenEsta investigación aborda la identificación y clasificación multitemporal de humedales en el municipio de Río de Janeiro, utilizando imágenes de los satélites Sentinel-1 (SAR) y Sentinel-2 (óptico) integradas mediante el algoritmo de aprendizaje automático Random Forest. Los resultados indican que aproximadamente el 13% del territorio de Río de Janeiro está compuesto por áreas inundadas de forma permanente o estacional, ubicadas principalmente en llanuras costeras y bahías. La investigación destaca la relevancia ecológica de los humedales en la regulación hídrica, la biodiversidad y la mitigación del cambio climático, enfatizando la necesidad de delimitar estas áreas para la planificación y gestión urbana. Palabras clave: humedales, random forest, régimen de inundaciones |
1 Introduction
Wetlands can be understood, in a broader sense, as areas covered by shallow waters (Russi et al., 2013). Moore (2008) points out that wetlands occupy 6% of the world’s surface, generally distributed in small patches across a very wide area, which contributes to their high degree of fragmentation, increasing their vulnerability.
The main global milestone for the preservation of wetlands occurred through the Ramsar Convention, in February 1971, in the city of Ramsar, Iran. This was recognized as an intergovernmental treaty that entered into force in 1975, fostering cooperation among countries for the conservation and rational use of wetlands.
In Brazil, wetlands are also popularly known as wet areas or swamps. In Brazilian legislation, the concept of wet areas can be found in the Brazilian Forest Code, approved by Law No. 12,651 of May 25, 2012. In the Law, wetlands are understood as wet areas, defined as “swamps and terrestrial surfaces periodically covered by water, originally covered by forests or other forms of vegetation adapted to flooding” (Brazil, 2012), corroborating the international conceptualization of these environments.
In 1993, Brazil signed the Ramsar Convention treaty, formalizing its accession through Decree No. 1,905 of May 16, 1996, by which Brazil promulgated the Convention’s guidelines within its legal framework.
In Brazil, Decree No. 10,141 of November 28, 2019 established the National Committee on Wetlands in Brazil. This permanent committee has among its objectives: proposing actions, contributing to the sustainable use of wet areas, suggesting and evaluating new sites of international importance, supporting and disseminating the Ramsar Convention in Brazil, among others.
Junk et al. (2014) point out that wetlands are present in approximately 20% of Brazilian territory. The authors also note that, in the country, coastal wet areas have been suppressed or directly impacted by urban expansion and in response to demands for beachfront or scenic housing.
The fact that most Brazilian wet areas dry out periodically differentiates Brazil from countries with cold and temperate climates, which show a high percentage of permanently wet wetlands with stable water levels or permanently waterlogged soils, such as different types of peatlands (Junk et al., 2014). Therefore, there is a need for a classification adapted to national characteristics, based on regional peculiarities.
According to Brazilian studies developed by Junk et al. (2014) and Cunha et al. (2014), which consider the country’s specificities and physical characteristics, wetlands in Brazil are considered according to the following definition:
Wet Areas are ecosystems at the interface between terrestrial and aquatic environments, continental or coastal, natural or artificial, permanently or periodically flooded or with waterlogged soils. The waters may be fresh, brackish, or saline, with plant and animal communities adapted to their hydrological dynamics. (Junk et al., 2014, p. 12)
Among the many potentialities of wetlands, their importance in the water cycle stands out. Global and local water cycles are strongly dependent on wet areas, with wetlands being a fundamental part of hydrological cycles due to their influence on nutrients and carbon present in wet areas (Russi et al., 2013), in addition to contributing significantly to climate change mitigation.
Moore (2008) highlights that there are different types of wetlands, which makes it difficult to define a single concept; however, the presence of water constitutes the common element among all of them. These zones can be considered as areas with permanent or temporary flooding conditions, with fresh or saline water.
To support terrestrial systems studies, a wide diversity of data is currently available, also referred to by authors in the geoinformation field as Big (EO) Data, corresponding to large volumes of Earth observation data. These data are characterized by high volume, variety, and velocity, as well as great value and veracity, as pointed out by Longley et al. (2013).
In this context, the classification and mapping of wetlands using remote sensing data constitute a relevant methodological challenge, since these environments present strong temporal variability in spectral responses throughout the year. Changes between dry and wet periods, associated with atmospheric interferences, hinder the accurate detection of these areas.
Thematic classification in land use and land cover studies should be continuously debated, since legends adopted in official mappings do not always contemplate the complexity of ecosystems such as wetlands. This limitation reinforces the need for methodologies capable of adequately representing their spatiotemporal dynamics.
A methodological possibility aimed at supporting this challenge involves radar images from the Synthetic Aperture Radar (SAR) of the Sentinel-1 satellite, associated with Sentinel-2 images (optical sensor). A distinguishing feature of radar imaging is data acquisition that is almost independent of atmospheric conditions, allowing its application in areas with constant cloud cover, or even acquiring information on the Earth’s surface during periods of intense precipitation, without cloud interference (Paradella et al., 2005; Silva et al., 2021). This characteristic favors the construction of continuous time series, essential for monitoring flood dynamics.
In this context, this article aims to propose and evaluate a multitemporal approach for the classification of wetlands in the municipality of Rio de Janeiro, using optical and radar remote sensing data. It is assumed that the dynamic behavior of wetlands should be understood as an inherent property of the specificity of this object, considering its occurrence in space and time.
Thus, the relevance of this research is related to multitemporal investigations within the scope of Remote Sensing techniques, in addition to enabling the understanding of the spatial, temporal, and descriptive components of Rio de Janeiro’s wetlands, in order to contribute to their inclusion as a thematic class in environmental studies. The results obtained may support territorial planning and assist conservation strategies for these environments, especially in the context of climate change.
1.1 Wetlands in the municipality of Rio de Janeiro
Wet areas can act as giant sponges, absorbing excess water and releasing it slowly into rivers, from which it can be extracted for use in agricultural irrigation, industrial processes, or domestic consumption (Moore, 2008).
As these are sensitive environments, it is important to highlight the problems of occupying, intervening in, or modifying wet areas without proper planning and knowledge of their dynamics. The occupation processes of these areas can directly impact changes in the hydrogeological system, since many of these areas are zones of exudation or aquifer recharge.
In addition, soil impermeabilization hampers the natural drainage of water, intensifying the occurrence of floods and inundations. Beyond economic losses, it is important to mention the risk of disease transmission and even loss of human life that these events can cause to local residents (Seabra and Rocha-Leão, 2019).
According to Junk et al. (2014), increased population density and accelerated transformations in land use forms, especially in aquatic environments, constitute the main mechanisms of degradation and loss of Brazilian wet areas, such as: (1) drainage for agriculture and livestock; (2) construction of residential areas, urban infrastructure, and industrial use; (3) pollution by sewage and domestic, industrial, and mining waste; (4) construction of hydroelectric plants, which flood wet areas upstream of dams, interrupt longitudinal connectivity, and alter the flood pulse downstream; (5) construction of waterways; (6) construction of dikes that interfere with lateral connectivity by separating wet areas from rivers; (7) improper exploitation of natural resources (fisheries, timber and non-timber resources, and biodiversity); (8) global climate change.
Junk et al. (2014) point out that among the most threatened wet areas in Brazil are wetlands located in the Atlantic Forest, for which there is little information. These examples can be found in the municipality of Rio de Janeiro, being quite frequent in coastal and fluvial plain landscapes.
It is noteworthy that the presence of wetlands in Rio de Janeiro is specifically restricted to areas with flatter relief, that is, fluviomarine plains, deltaic, alluvial, aeolian-marine plains, valley bottoms, and depressions. The existence of wetlands in the study area is restricted to these spatial units, as these are where flood concentration can be maintained due to low slope. In addition, in bay areas, the identification of estuaries and vegetation adapted to flooding, as well as specific fauna and flora, is quite frequent.
Many localities with wetlands in the State of Rio de Janeiro have undergone major changes in recent decades, mainly regarding channel rectification for urban growth purposes. In the municipality of Rio de Janeiro, the surroundings of Guanabara Bay and the Jacarepaguá lagoon systems (Figure 1) and Rodrigo de Freitas stand out, among other regions in the northern and western zones.
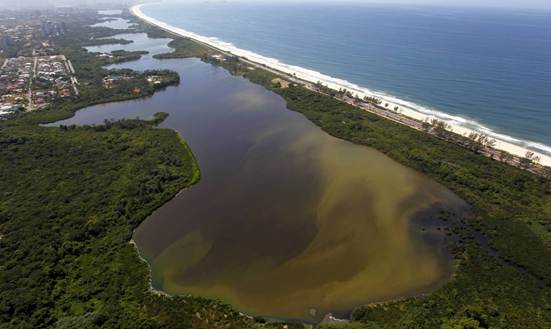
Figure 1: Examples of a wetland located in Barra da Tijuca.
Source: Custódio Coimbra/O Globo (2012)
2 Materials and Methods
2.1 Study Area
According to data from the 2022 census (IBGE, 2022), the municipality of Rio de Janeiro has a population of 6,211,223 inhabitants and a population density of 5,174.6 inhabitants per km², being the municipality with the largest population in the state and the second largest in the country.
Given this high level of complexity, adequate planning that is inherent to the city’s demands is required. In this sense, Complementary Law No. 111 of February 1, 2011 (PCRJ, 2011), establishes the Urban and Environmental Policy of the Municipality and institutes the Sustainable Urban Development Master Plan of the Municipality of Rio de Janeiro, defining the territorial units that support the planning and control of urban development in the municipality:
I – Planning Areas (AP), established through the division of the municipal territory based on criteria of environmental compartmentalization, historical-geographical characteristics, and land use and occupation; II – Planning Regions, established by grouping Administrative Regions and by subdividing the Planning Areas according to specific homogeneity criteria, aiming to support information organization and the integration of decentralized action by municipal agencies in the implementation of sectoral public policies. (PCRJ, 2011, p. 17)
Planning Areas (APs) are of great importance for environmental analysis surveys, since their environmental compartmentalization allows consideration of the different types of wetlands present in the landscape of Rio de Janeiro. In conjunction with them, Planning Regions also contribute to subdividing the municipal territory into smaller portions (Figure 2).
 Figure 2: Location of the administrative areas of the municipality of Rio de Janeiro.
Source: the authors (2025).
The municipality is divided into five Planning Areas (APs): AP-1, corresponding to the Central area; AP-2, encompassing the South Zone and Tijuca; AP-3, composed of Ramos, Méier, Madureira, Inhaúma, Penha, Pavuna, and Ilha do Governador; AP-4, which includes Jacarepaguá and Barra da Tijuca; and AP-5, formed by Bangu, Campo Grande, Santa Cruz, and Guaratiba (Table 1).
Table 1: Description of Planning Areas (APs) and Planning Regions (RPs) of the municipality of Rio de Janeiro.
AP | RP | Planning Region | Area (km²) |
1 | 1.1 | Centro | 34,40 |
2 | 2.1 | Zona Sul | 45,27 |
2.2 | Tijuca | 55,17 |
3 | 3.1 | Ramos | 15,57 |
3.2 | Méier | 30,35 |
3.3 | Madureira | 46,08 |
3.4 | Inhaúma | 13,84 |
3.5 | Penha | 24,52 |
3.6 | Pavuna | 31,67 |
3.7 | Ilha do Governador | 41,45 |
4 | 4.1 | Jacarepaguá | 120,23 |
4.2 | Barra da Tijuca | 173,56 |
5 | 5.1 | Bangu | 116,63 |
5.3 | Santa Cruz | 164,08 |
5.4 | Guaratiba | 152,58 |
5.2 | Campo Grande | 138,76 |
Source: Instituto Pereira Passos (2025).
Complementary Law No. 111 of February 1, 2011 (PCRJ, 2011) also reinforces the importance of conserving wet environments in the territorial and environmental planning of the municipality. Article 172 highlights the need to protect water resources, and item V emphasizes the need to “protect areas adjacent to watercourses in municipal land-use interventions, in order to safeguard flood-prone areas and preserve wet lowland forests” (PCRJ, 2011, p. 66).
Article 178 (PCRJ, 2011) guides the promotion of ecological reforestation aimed at restoring the Atlantic Forest and associated ecosystems, including wet and marshy areas. Item I of this article emphasizes “promoting the implementation and maintenance of ecological reforestation aimed at restoring the Atlantic Forest and associated ecosystems, as well as wet and marshy areas” (PCRJ, 2011, p. 69)
These guidelines highlight the strategic role of wetlands for the municipality, as these environments act in regulating the hydrological regime, aquifer recharge, sediment retention, and biodiversity maintenance, ensuring environmental sustainability and water security for the city, especially in the face of challenges posed by urbanization and climate change.
2.2 Multisensor remote sensing and machine learning
The mapping and classification of wetlands through remote sensing have been widely discussed in the literature, especially in tropical and coastal environments, where high spatiotemporal variability and frequent cloud cover impose significant methodological challenges. In this context, the integration of sensors with different characteristics has been highlighted as a strategy to represent the hydrological and ecological dynamics of these environments.
Synthetic Aperture Radar (SAR) data from the Sentinel-1 mission have recognized suitability for wetland monitoring, as radar backscatter is sensitive to the presence of free water, soil moisture, and vegetation structure. In Brazilian coastal regions and Atlantic Forest areas, characterized by seasonal flooding regimes and high cloudiness, the use of SAR imagery has proven essential for detecting periodically flooded areas and monitoring extreme hydrological events (Paradella et al., 2005; Silva et al., 2021; Slagter et al., 2020).
The spatial resolution of the Sentinel-1 constellation, at 10 meters, allows the construction of dense time series, which is particularly relevant in tropical wetlands, where alternation between dry and wet periods occurs rapidly and irregularly. Studies applied to Brazilian territory indicate that this characteristic favors the identification of dynamic flooding patterns that are difficult to capture using optical sensors alone (Junk et al., 2014; Mahdianpari et al., 2018).
In turn, Sentinel-2 optical imagery plays an essential complementary role, especially in the spectral discrimination of vegetation associated with wetlands and in differentiating land cover types. Studies conducted in coastal areas and tropical biomes demonstrate that visible, near-infrared, and shortwave infrared bands are effective in identifying phenological variations, moisture gradients, and vegetation responses to flooding regimes (Jamali et al., 2021; Slagter et al., 2020).
Jamali et al. (2021) point out that despite the excellent results obtained from optical data, a synergistic methodology developed based on the integration of Sentinel-1 SAR data and Sentinel-2 optical data was more efficient for wetland mapping in Canada (Mahdianpari et al., 2019) and South Africa (Slagter et al., 2019). Thus, the integration of Sentinel-1 and Sentinel-2 has been highlighted as a robust hybrid approach for wetland mapping, combining the atmospheric-condition stability of SAR data with the spectral detail of optical sensors.
Associated with this multisensor approach, the use of machine learning algorithms has significantly expanded the analytical potential of orbital image time series. Among these algorithms, Random Forest stands out in the literature for its ability to handle large data volumes, integrate multiple variables, and reduce overfitting issues, showing high performance in land use and land cover classification studies (Breiman, 2001; Belgiu and Drăguţ, 2016).
Time series image analysis and machine learning methods have been widely used for land use and land cover classification and change detection with good results (Maus et al., 2016). In applications focused on wetland mapping, Random Forest has been employed in tropical, coastal, and highly heterogeneous environmental contexts, including Atlantic Forest areas and Brazilian wetlands. Studies indicate that the algorithm is particularly efficient in capturing nonlinear patterns associated with hydrological dynamics, in addition to enabling the assessment of the relative importance of spectral, temporal, and radar backscatter variables used in the classification process (Cutler et al., 2012; Mahdianpari et al., 2018; Jamali et al., 2021).
Thus, the integration of Sentinel-1 SAR data, Sentinel-2 optical imagery, and the Random Forest classification algorithm aligns with a trend in both international and national literature, especially in studies aimed at mapping and characterizing wetlands in tropical and coastal environments. This approach has proven particularly suitable for representing the dynamic nature of these ecosystems, contributing to their better inclusion as a thematic class in environmental and territorial planning studies.
2.3 Classification of optical and SAR images using Random Forest
The execution of the preprocessing and classification stages of orbital images was carried out using scenes obtained and processed through the Google Earth Engine (GEE) digital platform[1]. GEE is a cloud-based geospatial processing platform for large-scale environmental monitoring and analysis, providing access to petabytes of remote sensing imagery, enabling parallel processing of machine learning algorithms, and offering an Application Programming Interface (API) library with development environments that support popular coding languages such as JavaScript and Python (Tamiminia, 2020).
Carvalho Júnior (2018) highlights the extensive use of remote sensing imagery, both optical and radar, in surface water detection. The author also discusses the potential of cloud processing, the use of high temporal resolution imagery, and the development of new algorithms for classifying flood-prone areas. There is a large body of work in Brazil that uses SAR imagery for classifying floodable areas, also referred to as wetlands, especially in biomes such as the Amazon and the Pantanal, as seen in Magalhães (2022), Cardoso (2023), Silva (2020), and Teixeira (2011).
Research in other continents also reinforces the use of SAR imagery for wetland classification. However, Jamali et al. (2021) point out that despite the excellent results obtained from optical data, a synergistic methodology based on the integration of Sentinel-1 SAR data and Sentinel-2 optical data was more efficient for wetland mapping in Canada (Mahdianpari et al., 2019) and South Africa (Slagter et al., 2019).
Thus, as a methodology for wetland classification, the Random Forest machine learning algorithm was adopted, associated with Sentinel-1 (SAR sensor) and Sentinel-2 (MSI sensor) time series. It should be noted that a multitemporal classification was performed, considering dry and wet periods, in order to provide greater accuracy to the thematic class to be mapped.
For this research, the period from 2019 to 2021 was adopted, making it possible to map interannual differences, considering years of higher and lower rainfall, without seasonal interruptions. In this way, the interseasonal flood pulse was considered, aiming to avoid losses in the understanding of this dynamic. These data can contribute to identifying wetland flood pulses according to moisture conditions and their persistence during different times of the year, supporting the selection of time series to be classified.
In GEE, two separate scripts were developed: the first for classifying SAR images and the second for classifying optical images. In the first script, the Sentinel-1 image collection (corresponding to the Sentinel-1A and Sentinel-1B missions) of the GRD (Ground Range Detected) type was used, considering the following filtering characteristics: Interferometric Wide Swath (IW) mode; descending orbit pass; spatial resolution of 10 meters; and selection of VH and VV polarizations. In addition to filtering by location and start and end dates, spatial filtering was applied to reduce speckle noise using a 3×3 Lee filter (Lee, 1980).
In the second script, Sentinel-2 time series were used, for which the main challenge is atmospheric interference, especially cloud presence, which is frequent in tropical regions and intensified during the rainiest summer months. To address this problem, two strategies were adopted: (i) filtering images with up to 40% cloud cover and (ii) applying a mask to remove affected areas. Another factor that hindered classification was the presence of steep areas, such as hills and mountains, as well as shadows, which were mistakenly identified as wetlands due to high spectral absorption. To correct these inconsistencies, a slope mask derived from the Shuttle Radar Topography Mission (SRTM) digital elevation model version 3.0 (SRTM Plus) was incorporated, preventing steep terrain from being included in the mapping. In addition, the script incorporated the calculation of metrics aimed at obtaining the median values of the Blue (B02), Green (B03), Red (B04), and Near-Infrared (B08) bands, as well as the NDWI index, for generating monthly composites.
Both scripts, referring to Sentinel-1 and Sentinel-2 time series, were subjected to the same processing procedures, aiming to create better conditions for constructing monthly composites representing the average of cloud-free pixels for each month. The use of composites, widely employed in time series analyses, allows the synthesis of information from multiple images into a single image, optimizing analysis over large areas (Griffiths et al., 2019).
For the sampling stage, binary samples were used (0 = non-wetlands and 1 = wetlands), encompassing the diversity of types present in the study area. Classification was performed in Google Earth Engine using the Random Forest (RF) algorithm, configured with 500 decision trees and an unlimited number of nodes, using 4,901 samples representative of invariant classes between 2019 and 2021.
After the Sentinel-1 and Sentinel-2 image classifications were performed separately, a series of statistical processing steps was required to unify the generated data and conduct spatial and statistical analyses of the classifications. In this context, the R programming language was used to perform intersections between the monthly classifications produced by the sensors. Finally, a temporal segmentation of the classifications was carried out in order to obtain results on the sequential trajectory of wetlands. This segmentation was of utmost importance for identifying wetland flooding regimes in a continuous manner and understanding seasonal patterns of flooding regimes.
For mapping validation, a stratified random sampling methodology was adopted in the GEE platform, known as AREA2. This sampling design offers the option to control sample size in classes that occupy a small proportion of the area in order to reduce standard errors of class-specific accuracy estimates (Olofsson et al., 2014). Thus, the adopted stratified random sampling design considered the number of samples according to their territorial extent within the study area.
3 Results and discussions
3.1 Flooding regime
The classifications derived from radar and optical sensors were unified and jointly validated. Based on the results obtained from the validation of the mapping (Table 2), it is possible to highlight the excellent performance of the mapping of wetlands located in the State of Rio de Janeiro. Through the error matrix generated by the mapping validation, it is possible to observe that the commission error was higher than the omission error, and that, overall, the mapping achieved a highly expressive result in its validation.
Table 2: Error matrix of wetland classification using Sentinel-1 and Sentinel-2 images.
Classification S1 + S2 | Classification/Model | Total |
Classes | Wetland | Not Wetland |
Reference/ Ground Truth | Wetland | 112 | 28 | 140 |
Not Wetland | 4 | 96 | 100 |
Total | 116 | 124 | 240 |
Source: the authors (2025).
Commission errors refer to the erroneous classification of water in shadowed areas. Among the 240 validation points, only 32 were incorrectly classified, with 28 due to omission errors and 4 due to commission errors. This result indicates a low number of commission and omission errors in the classification.
The errors were present in shadowed areas and rocky outcrops, which were incorrectly classified as wetlands, thus constituting commission errors. This error occurred at some validation points due to the mapping scale and the scale of the slope mask used in the classification, since the slope data were derived from the SRTM digital elevation model, which has a spatial resolution of 30 meters, whereas the classification was based on images with 10-meter spatial resolution. Consequently, some noise was introduced into the classification due to this scale inconsistency.
Omission errors, in turn, correspond to flat areas that should have been classified as wetlands but were not. This noise may be a reflection of the patterns used in the classification, as well as the spectral indices that supported the classification. Nevertheless, it should be emphasized that these omission errors were considered low and not very significant for the validation result, which achieved good performance values.
Regarding the metrics, the validation of the mapping indicated good performance results, with an overall accuracy of 0.87. Producer’s accuracy, associated with omission error, reached 0.80, while user’s accuracy, associated with commission error, reached 0.97. The F-score reached 0.88, which is considered high as it approaches 1 and reflects validation performance. Meanwhile, the IoU, which refers to the overlap between the classified area and ground truth, reached a high value of 0.78 (Table 3).
Table 3: Validation results of the final wetland classification.
Validation metrics | Classification validation |
Overall accuracy | 0.87 |
Kappa Index | 0.73 |
Producer Accuracy (Precision/Omission) | 0.80 |
User Accuracy (Recall/Comission) | 0.97 |
F-score | 0.88 |
IoU | 0.78 |
Source: the authors (2025).
The Kappa index is an indicator developed by Landis and Koch (1977) and can be defined as a measure of association used to describe and test the degree of agreement, that is, reliability and accuracy in classification. The Kappa index of the mapping presented a value of 0.73. According to the index scale, this value is considered a very good classification result, corroborating its applicability in environmental research.
The need to use both time series arose due to their complementary performance, since radar images showed excellent performance for open water surfaces, while optical images were successful in classifying areas with vegetation and moisture. Another aspect that should be mentioned regarding the choice of Sentinel-2 (optical) together with Sentinel-1 (radar) refers to the possibility of achieving a spatial resolution of 10 meters, considering the characteristics and potential uses of both sensors, as well as their high temporal resolution, which allows a more comprehensive analysis of a phenomenon that is dynamic and varies in coverage over short time spans.
The final classification allows the analysis of the spatio-temporal dynamics of wetlands in Rio de Janeiro, that is, data related to the flooding regime of floodable landscapes located in the municipality of Rio de Janeiro (Figure 3). It is estimated that 13% of the city’s territory is covered by wetlands. This percentage is quite significant and is primarily located in the coastal portion of the municipality, in plain areas associated with bays, lagoons, and estuaries, showing significant variations in flooding periods and frequencies.
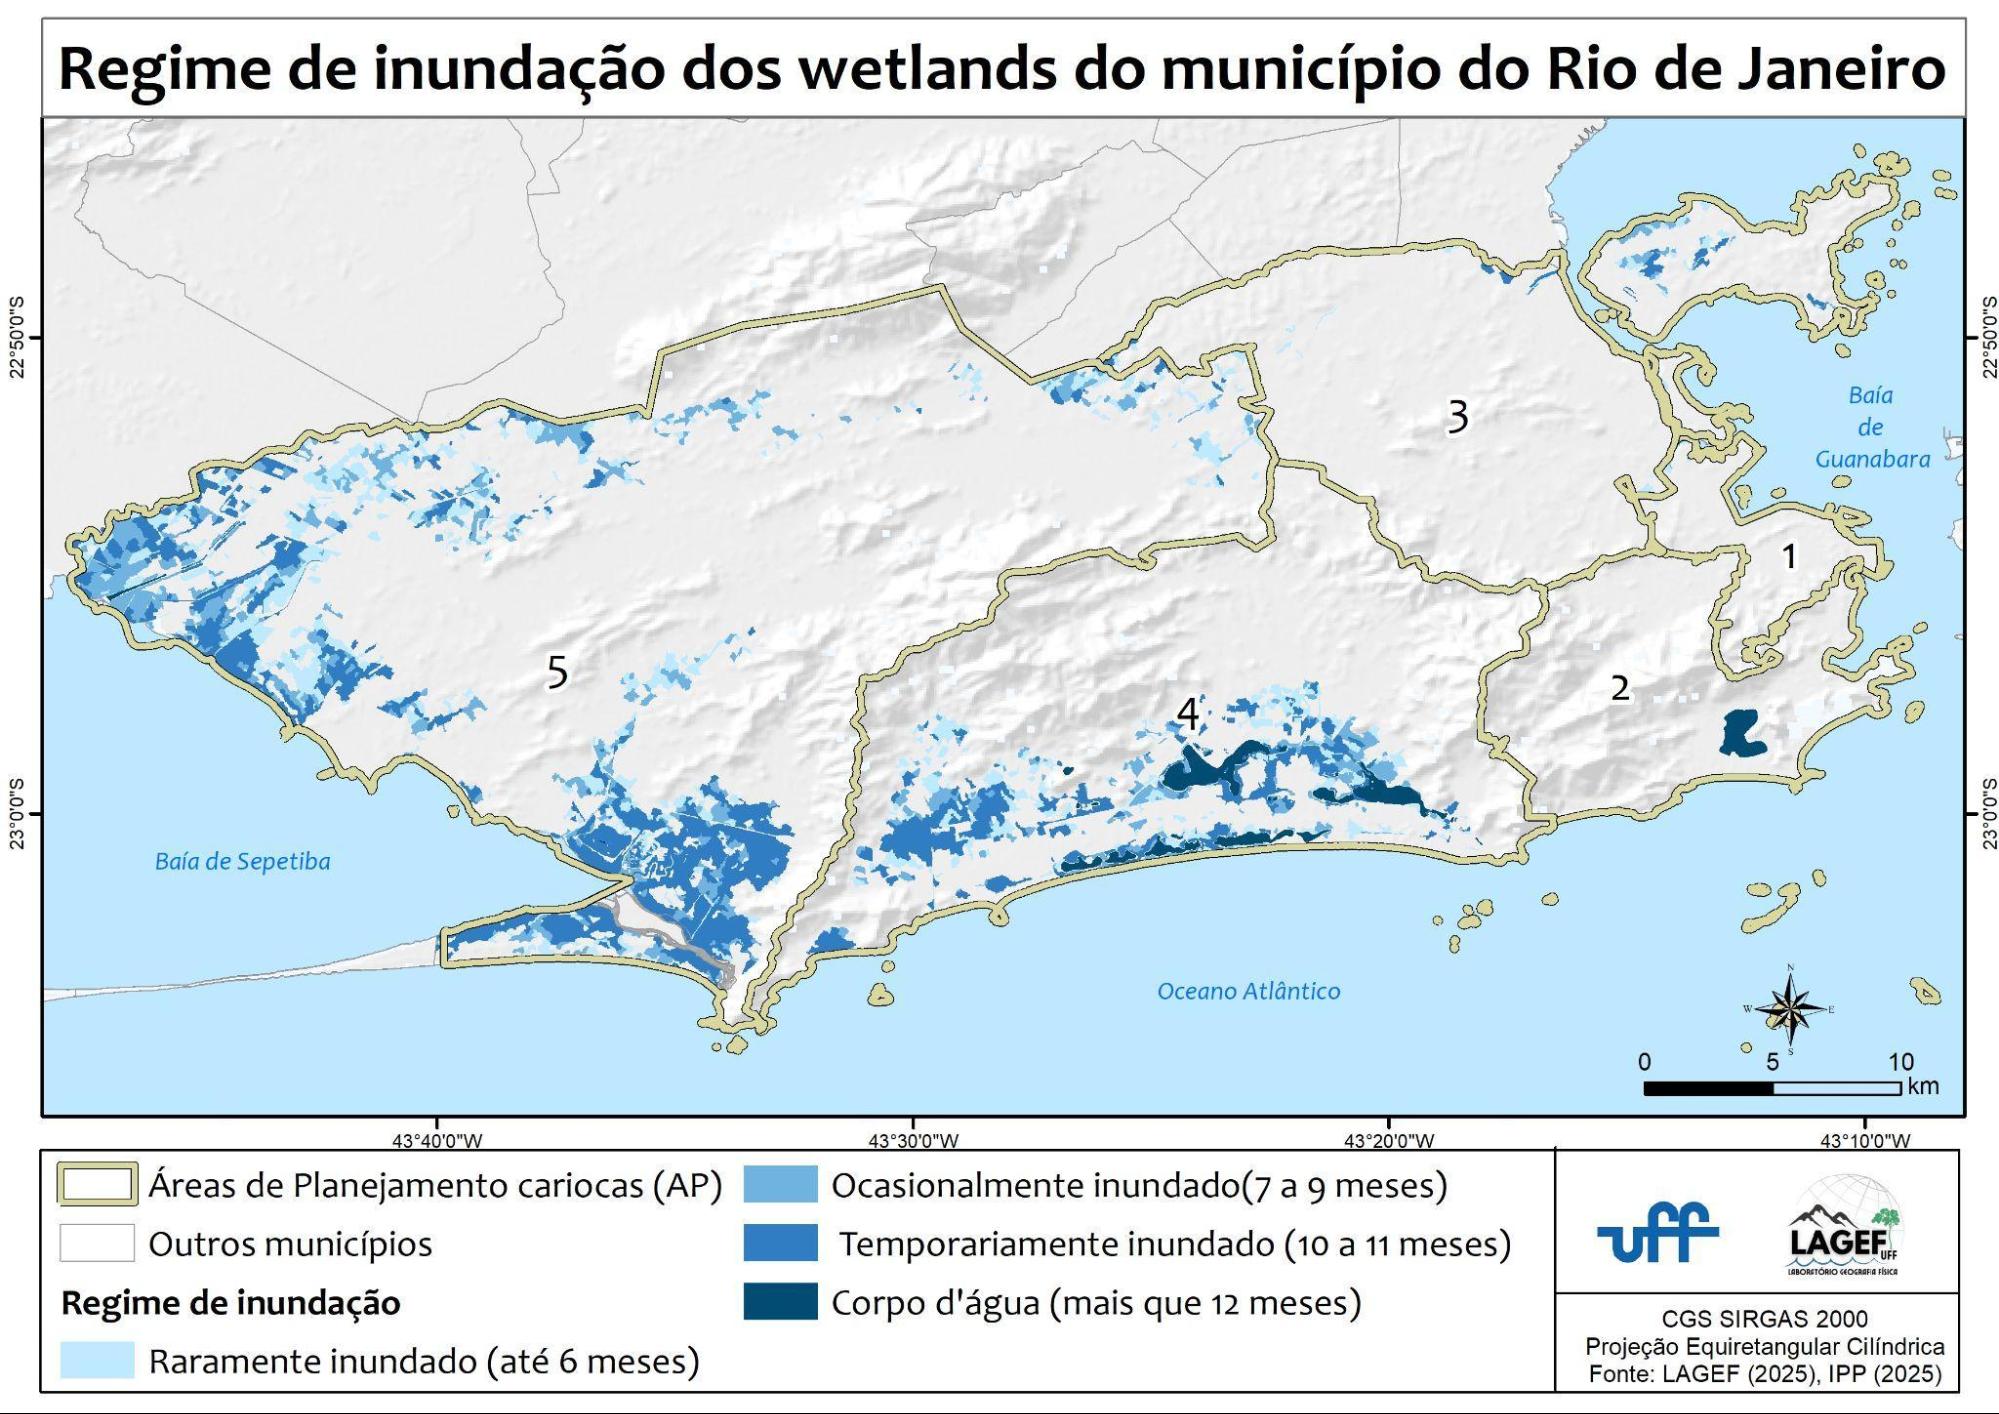
Figure 3: Flooding regime of wetlands in Rio de Janeiro.
Source: the authors (2025).
Regarding the flooding regime, as adapted from Costa (2025), a clear spatial gradation is observed: permanently flooded areas are surrounded by temporarily flooded zones, followed by occasionally and rarely flooded areas, which are distributed in more distant portions. Temporarily flooded areas represent the largest extent, totaling 5.79% of the municipal territory, followed by rarely flooded (3.73%) and occasionally flooded areas (3.42%). Permanent water bodies, which include lagoons, channels, and river stretches, account for less than 1% of the landscape, constituting the most stable cores of the hydrological system (Table 4).
Table 4: Quantification of the flooding regime of wetlands in the municipality of Rio de Janeiro.
Classes | Area (km²) | % |
Rarely flooded (up to 6 months) | 44.96 | 3.73 |
Occasionally flooded (7 to 9 months) | 41.17 | 3.42 |
Temporarily flooded (10 to 11 months) | 69.69 | 5.79 |
Water body (36 months) | 10.56 | 0.88 |
Total wetland area | 166.37 | 13.82 |
Total area of other land covers | 1 037.78 | 86.18 |
Total municipal area | 1 204.15 | 100.00 |
Source: the authors (2025)
These results show that the floodable landscapes of Rio de Janeiro are organized as a dynamic mosaic of seasonality. The predominance of temporarily and occasionally flooded areas reinforces the role of wetlands as transition zones between aquatic and terrestrial environments, which are fundamental for surface runoff control, water recharge, and the maintenance of local biodiversity.
As their occurrence is limited by factors such as moisture, wetlands are considered dynamic terrestrial systems, especially in tropical areas such as Rio de Janeiro, which presents a large thermal amplitude throughout the year. Moore (2008) highlights that wetlands are dynamic ecosystems that are in a constant state of change. In this sense, the occurrence of wetlands is conditioned by a dynamic temporality of terrestrial systems.
3.2 Wetlands by Planning Area
The quantification of wetlands across the different Planning Areas (PAs) of the municipality reveals variations in both extent and flooding regime. The largest proportions of wetlands are concentrated in PA5 (19.1%) and PA4 (16.2%), followed by PA3 (3.2%), while PA1 and PA2 show marginal participation, accounting for 1.6% and 2.1% of the total area, respectively (Table 5). This distribution highlights the predominance of swamp landscapes and aquatic systems in the coastal and low-lying portions of the territory, especially in plains associated with bays and lagoon systems.
Table 5: Flooding regime classes by Planning Areas of Rio de Janeiro
Class | AP 1 | AP 2 | AP 3 | AP 4 | AP 5 |
km² | % | km² | % | km² | % | km² | % | km² | % |
Rarely flooded (up to 6 months) | 0.5 | 1.3 | - | - | 2.6 | 1.3 | 11.4 | 3.9 | 30.4 | 5.3 |
Occasionally flooded (7 to 9 months) | 0.1 | 0.2 | - | - | 1.8 | 0.9 | 8.9 | 3.0 | 30.3 | 5.3 |
Temporarily flooded (10 to 11 months) | 0.0 | 0.1 | 0.1 | 0.1 | 2.1 | 1.0 | 19.0 | 6.5 | 48.2 | 8.4 |
Water body (more than 12 months) | - | - | 2.0 | 2.0 | 0.0 | 0.0 | 8.2 | 2.8 | 0.3 | 0.0 |
|
|
|
|
|
|
|
|
|
|
|
Wetlands total | 0.6 | 1.6 | 2.1 | 2.1 | 6.6 | 3.2 | 47.6 | 16.2 | 109.1 | 19.1 |
Not wetland | 33.8 | 98.4 | 98.3 | 97.9 | 196.9 | 96.8 | 246.2 | 83.8 | 462.9 | 80.9 |
Total area of planning areas | 34.4 | 100.0 | 100.4 | 100.0 | 203.5 | 100.0 | 293.8 | 100.0 | 572.0 | 100.0 |
Source: the authors (2025)
With regard to the types of existing swamp landscapes, wetlands of different origins and physical characteristics are observed. In the marginal zones of the Planning Areas and bay environments, mainly located in AP3 and AP5, coastal wetlands predominate, characterized by mangrove vegetation and restinga formations adapted to salinity variations and tidal regimes. These areas represent transitional ecosystems between terrestrial and marine environments, playing an essential role in sediment retention and shoreline protection.
In AP5, the presence of Sepetiba Bay (Figure 4) stands out, hosting extensive estuarine systems and mangroves that are fundamental for maintaining biological productivity and the hydrological balance of the region. In PA3, mangrove areas located along the margins of Linha Vermelha, especially near Ilha do Fundão, are noteworthy, representing significant remnants of coastal ecosystems within a consolidated urban fabric.
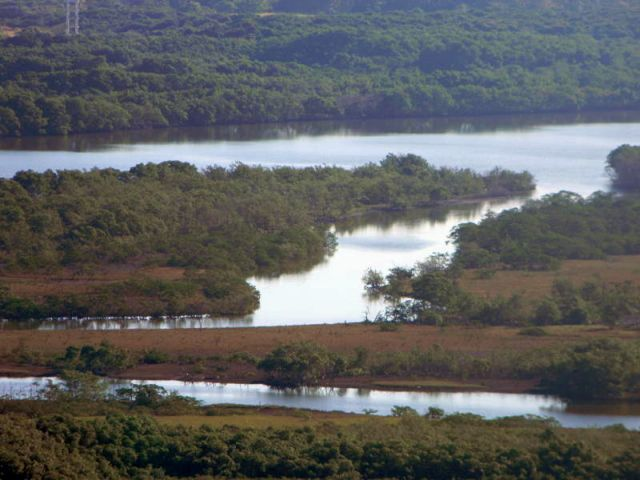
Figure 4: Wetlands located in marginal zones and bay areas in Guaratiba.
Source: Oeco/Inea (2011).
In APs 1, 2, and 3, few wetland areas were identified, reflecting intense urbanization and hydraulic interventions that have altered the natural flooding dynamics. Nevertheless, flooding events are common during periods of heavy rainfall, particularly in PA1 and PA3, where extensive fluvial plains connect to the Baixada Fluminense and present a history of channelization and river straightening.
In AP2, Lagoa Rodrigo de Freitas stands out as the main natural water body still preserved, while most other rivers are channelized and show little or no occurrence of natural flooding regimes. This situation highlights the degree of anthropization in the central and mid-slope areas of the municipality, where urban expansion has significantly reduced both the presence and ecological functionality of wetlands.
In floodplain areas located in low-lying portions of the different Planning Areas, especially in the northern and western zones, fluvial wetlands are identified. These wetlands form in periodically flooded areas covered by herbaceous and shrub vegetation adapted to seasonal waterlogging. In these environments, temporarily and occasionally flooded classes predominate, totaling 27.9 km² (9.5% of AP4), reflecting the seasonal behavior of the local hydrological regime.
In the areas where the extensive lagoon systems of Barra da Tijuca, Jacarepaguá, and Marapendi (AP4) develop (Figure 5), a marked predominance of rarely, occasionally, and temporarily flooded wetlands is observed, jointly totaling 47.3 km², corresponding to approximately 16.1% of AP4. In addition, permanent water bodies stand out, covering 8.2 km² (2.8%), underscoring the hydrological and ecological importance of these lagoon complexes. These regions host rich hydrophilic vegetation, including aquatic macrophytes, rushes, cattails (Typha domingensis), and flood-tolerant grasses, as well as transition zones with herbaceous and shrubby restinga. This flora contributes to water quality maintenance through nutrient filtration and sediment retention, while local fauna consists of aquatic birds, fish, amphibians, and reptiles that use these areas for shelter, reproduction, and feeding.
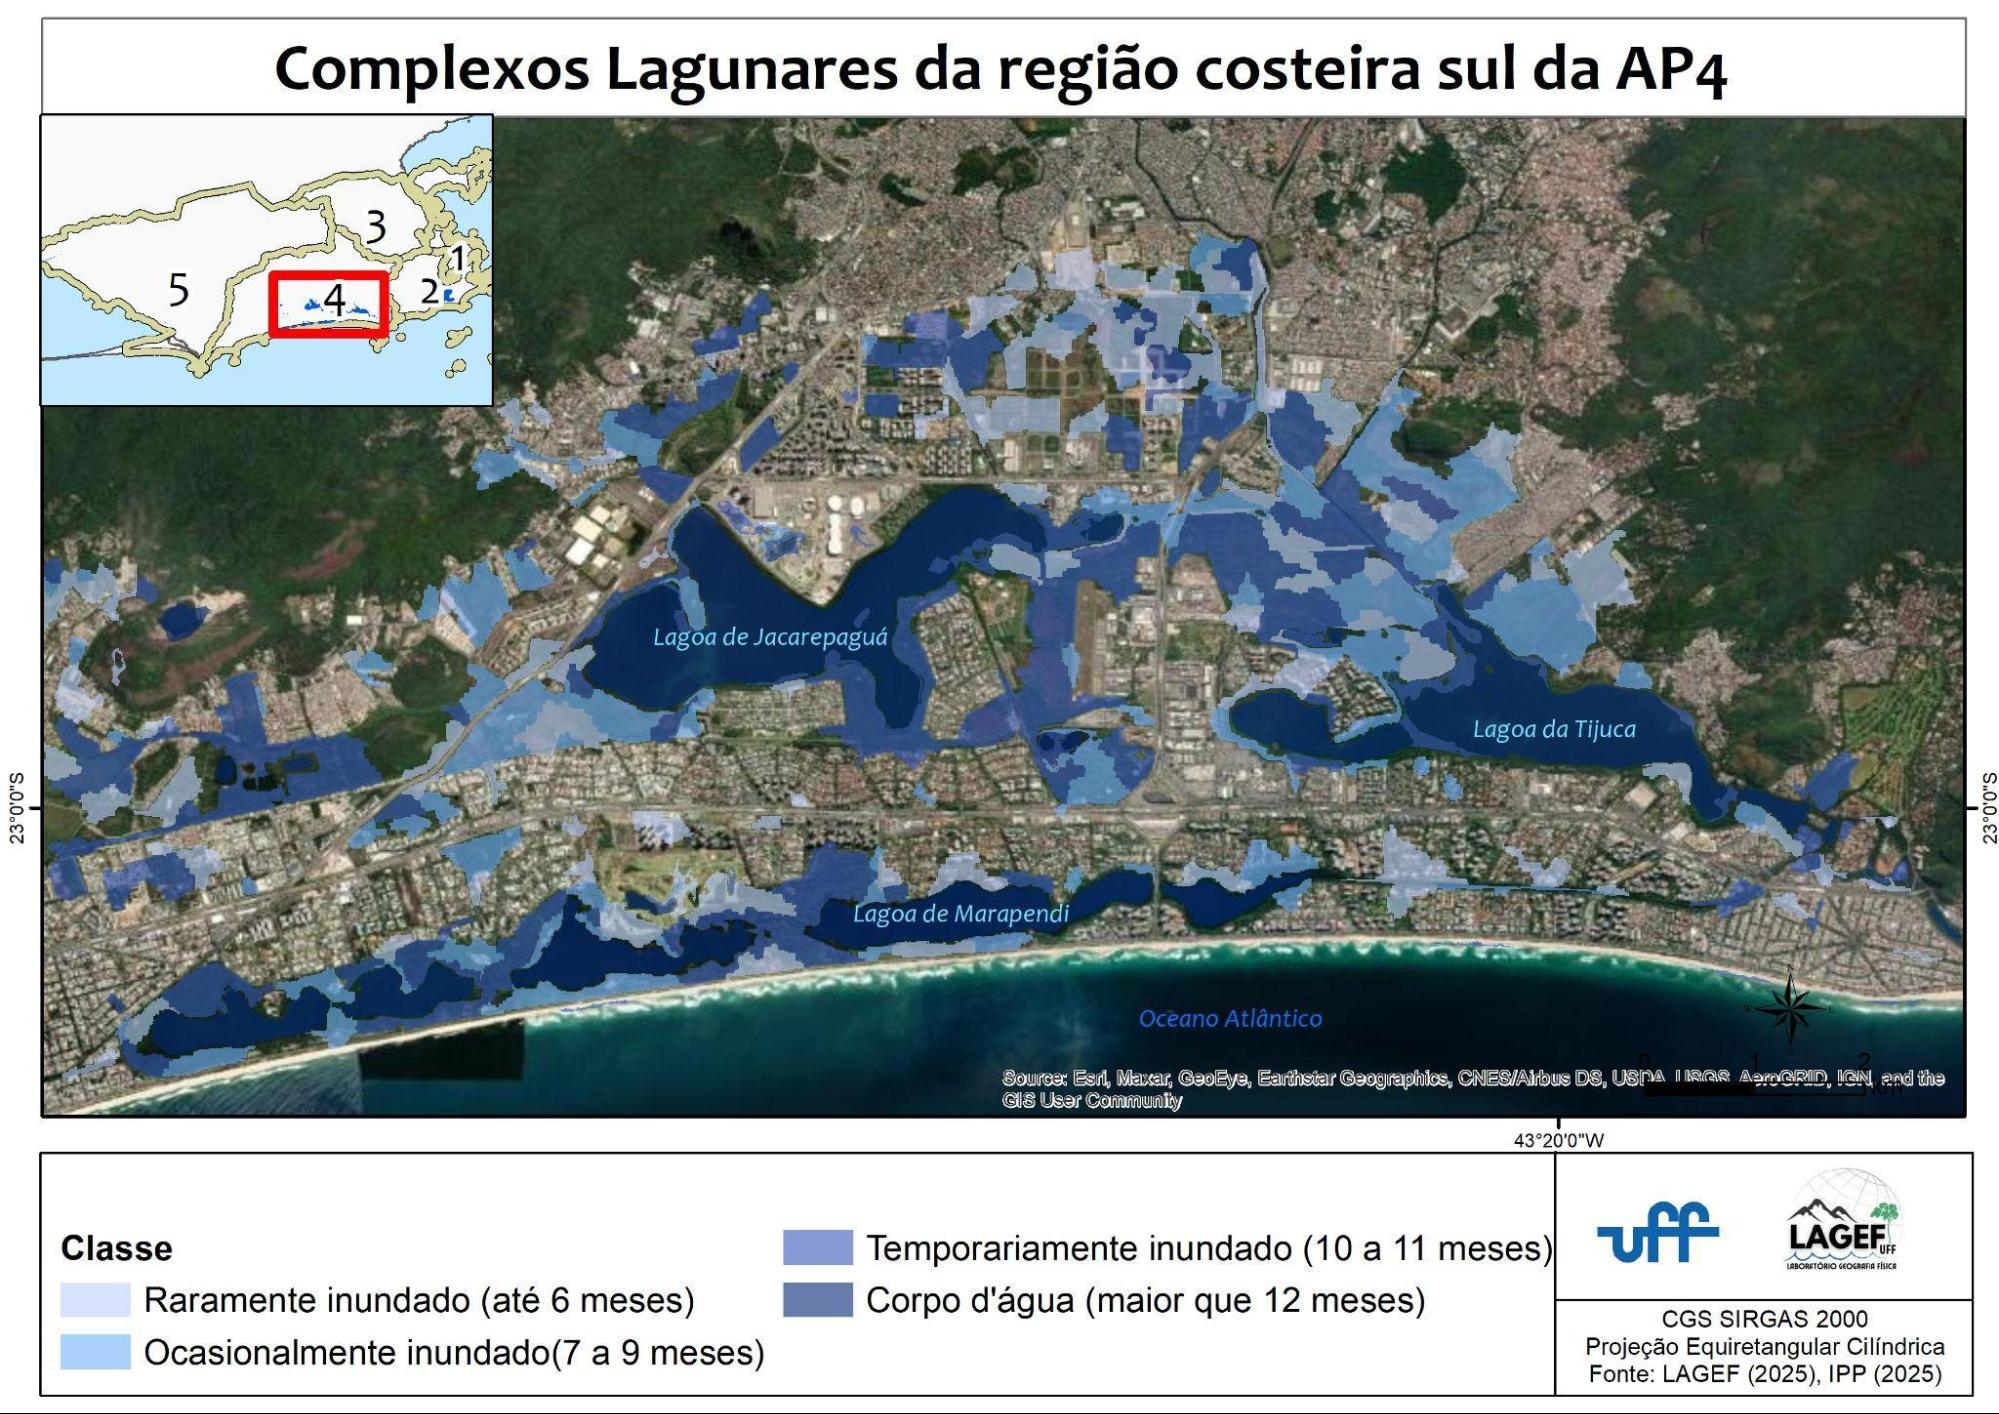
Figure 5: Detailed flooding regime in PA4, highlighting the lagoon complexes of the coastal region.
Source: the authors (2025).
Despite their high ecological value, the lagoon complexes of PA4 have been experiencing increasing pressure from urban growth, associated with real estate expansion, irregular landfills, river channelization, and the discharge of domestic and industrial effluents. These processes have led to siltation, reduction of floodable areas, and deterioration of water quality, directly affecting aquatic ecosystems and species dependent on these environments. As a result, the wetlands of the Barra region constitute one of the most representative, and simultaneously most vulnerable, wetland systems in the municipality of Rio de Janeiro, requiring urgent environmental management and ecological restoration strategies.
This diversity of wetland typologies underscores the ecological importance of these environments in hydrological balance, biodiversity conservation, and the landscape dynamics of the city of Rio de Janeiro. Positioned at the interface between the rapid urban and economic growth of recent decades and the complexity of natural flooding regimes, these ecosystems have been increasingly pressured by unplanned occupation, landfilling, soil sealing, and alterations to natural water flows. The overlap between urban expansion zones and floodplains highlights the need to integrate urban planning with wetland conservation in order to ensure environmental resilience and the ecological functioning of these systems amid ongoing transformations of the Carioca territory.
4 Conclusion
The results demonstrate that wetlands are widely distributed across the landscapes of Rio de Janeiro, with occurrences strongly associated with coastal, fluvial, lagoon, and bay plains. This distribution highlights the close relationship between these environments and the geomorphological and hydrological dynamics of the municipality of Rio de Janeiro. Mapping based on the seasonal flooding regime allowed for a more precise delineation of these environments in thematic maps, emphasizing their ecological and functional relevance.
The significant presence of wetlands reinforces their importance in hydrological regulation, aquifer recharge, and biodiversity conservation, as well as their contribution to mitigating risks associated with extreme events, providing essential ecosystem services in the face of increasing urbanization and climate change impacts.
The integration of SAR and optical data proved effective in identifying seasonal flooding variations, confirming the potential of remote sensing techniques and machine learning approaches for the mapping and continuous monitoring of wetlands at the municipal scale. The methodological approach adopted enhanced the accuracy, consistency, and representativeness of thematic mappings, contributing to a better understanding of the spatiotemporal dynamics of wetlands within the Carioca territory.
In this context, the need to incorporate wetlands into land-use policies and urban planning strategies for the municipality of Rio de Janeiro is emphasized. Monitoring these ecosystems can be considered a priority climate adaptation strategy, given the multiple environmental and social services these environments provide to society.
One of the main challenges in image classification at this level of detail is related to the presence of noise and the need to ensure compatibility between the results and the cartographic scale of analysis. In this regard, the mappings produced by this research were made available at a compatible scale of up to 1:50,000, adopting 1 hectare as the minimum mapping unit, in order to ensure greater spatial consistency and reduce excessive fragmentation effects.
Another challenge encountered in the hybrid classification approach concerns the limitations imposed by the use of optical imagery with a spatial resolution of 10 meters, which restricted the analysis to a single radiometric index (NDWI) and to bands located exclusively within the visible and near-infrared spectral ranges. This limitation resulted from the need to integrate data from different sensors, optical (MSI) and radar (SAR), in a combined manner, while respecting the original spatial resolution of both datasets, fixed at 10 meters.
As future developments of this research, relevant perspectives for advancing knowledge and improving wetland management are highlighted. One of these involves analyzing the spatial connectivity among wetlands to identify areas more vulnerable to fragmentation, as well as those with potential for the formation of ecological corridors, which are essential for maintaining biodiversity and ecological flows. Another possibility lies in the analysis and quantification of ecosystem services provided by different wetland typologies, such as carbon sequestration and storage, which play a fundamental role in addressing climate change. Furthermore, the operational application of the proposed model may contribute to the continuous monitoring of these environments, optimizing environmental management actions and supporting decision-making processes in territorial planning.
References
BELGIU, M.; DRAGUT, L. Random forest in remote sensing: A review of applications and future directions. ISPRS Journal of Photogrammetry and Remote Sensing, v. 114, p. 24-31, 2016. https://doi.org/10.1016/j.isprsjprs.2016.01.011.
BRASIL. Código Florestal Brasileiro - Lei nº 12.651, de 25 de maio de 2012. Dispõe sobre a proteção da vegetação nativa e dá outras providências. Diário Oficial da República Federativa do Brasil, Brasília, DF, 2012. Available at: http://www.planalto.gov.br/ccivil_03/_ato2011-2014/2012/lei/l12651.htm. Accessed on: 16 jul. 2020.
BRASIL. Decreto nº 1.905, de 16 de maio de 1996. Promulga a Convenção Relativa às Zonas Úmidas de Importância Internacional, especialmente como Habitat de Aves Aquáticas (Convenção de Ramsar), de 2 de fevereiro de 1971. Diário Oficial da República Federativa do Brasil, Brasília, DF, 17 mai. 1996.
BRASIL. Decreto nº 10.141, de 28 de novembro de 2019. Dispõe sobre a implementação da Convenção sobre Zonas Úmidas de Importância Internacional, especialmente como Habitat de Aves Aquáticas (Convenção de Ramsar), e dá outras providências. Diário Oficial da República Federativa do Brasil, Brasília, DF, 29 nov. 2019.
BRASIL. Recomendação CNZU n. º 07, de 11 de junho de 2015. Brasília, DF. 2015. Available at: https://antigo.mma.gov.br/comunicacao/item/10872-comit%C3%AA-nacional-de-zonas-%C3%BAmidas.html. Accessed on: 20 apr. 2022.
CARDOSO, Daniel da Silva. Uso de séries temporais do sensor Sentinel-1 SAR na análise de áreas inundáveis nos rios Madeira e Canumã no estado do Amazonas, Brasil. Monografia de Bacharel em Geografia, Universidade de Brasília, Brasília, 2022.
CARVALHO JÚNIOR, O.A.C. Aplicações e perspectivas do Sensoriamento Remoto para o mapeamento de áreas inundáveis. Revista de Geografia (Recife), v. 35, n. 4, 2018.
COSTA, Evelyn de Castro Porto. Wetlands do Estado do Rio de Janeiro: Identificação, Classificação e Estado Ambiental das Paisagens Pantanosas. 2025. 177 f.: il. Tese (Doutorado em Geografia) – Programa de Pós-Graduação em Geografia, Universidade Federal Fluminense, Niterói, 2025.
CUNHA, C.N; PIEDADE, M.T.F; JUNK, W. J. (Ed.). Classificação e delineamento das áreas úmidas brasileiras e de seus macrohabitats. Cuiabá: EdUFMT, 2014.
CUTLER, Adele; CUTLER, D. Richard; STEVENS, John R. Random forests. In: Ensemble machine learning: Methods and applications, p. 157-175, 2012.
EMBRAPA. Sentinel: Missão Sentinel. Available at: https://www.embrapa.br/satelites-de-monitoramento/missoes/sentinel. Accessed on: 25 jan. 2024.
EUROPEAN SPACE AGENCY (ESA). Sentinel online. User Guides. Available at: https://sentinel.esa.int/web/sentinel/user-guides. Accessed on: 25 jan. 2024.
IBGE. Censo Demográfico 2022: resultados gerais da população e dos domicílios. Rio de Janeiro: IBGE, 2023. Available at: https://censo2022.ibge.gov.br/. Accessed on: 10 nov. 2025.
JAMALI, Ali et al. Deep Forest classifier for wetland mapping using the combination of Sentinel-1 and Sentinel-2 data. GIScience & Remote Sensing, v. 58, n. 7, p. 1072-1089, 2021.
JUNK, W.J et al. Brazilian wetlands: their definition, delineation, and classification, for research, sustainable management, and protection. Aquatic Conservation: Marine and Freshwater Ecosystems. v. 24, n. 1, p. 5-22, 2014.
LONGLEY, P.A.; GOODCHILD, M. F.; MAGUIRE, D. J.; RHIND, D. W. Sistemas e Ciência da Informação Geográfica. Porto Alegre. Bookman, 2013.
MAGALHÃES, Ivo Augusto Lopes. Análise de inundações e classificação da cobertura vegetal no bioma amazônico usando séries temporais sentinel-1 SAR e técnicas de Deep Learning. 2022. 122 f., il. Tese (Doutorado em Geografia) — Universidade de Brasília, Brasília, 2022.
MAHDIANPARI, Masoud et al. The first wetland inventory map of newfoundland at a spatial resolution of 10 m using Sentinel-1 And Sentinel-2 data on the Google Earth Engine cloud computing platform. Remote Sensing, v. 11, n. 1, p. 43, 2018.
MAUS, V.; CÂMARA, G.; CARTAXO, R.; SANCHEZ, A.; RAMOS, F.M.; de QUEIROZ, G.R. A Time-Weighted Dynamic Time Warping Method for Land-Use and Land-Cover Mapping. IEEE Journal of Selected Topics in Applied Earth Observations and Remote Sensing, 2016, 9, 3729–3739.
MOORE, Peter D. Ecosystems: Wetlands. Revised Edition. New York, NY, 2005.
MOREIRA, Maurício Alves. Fundamentos do sensoriamento remoto e metodologia de aplicação. 4. ed., Viçosa, MG, Editora UFV, 2011.
OLOFSSON, Pontus et al. Good practices for estimating area and assessing accuracy of land change. Remote Sensing of Environment, v. 148, p. 42-57, 2014.
PARADELLA, Waldir Renato et al. Radares imageadores nas Geociências: estado da arte e perspectivas. Revista Brasileira de Cartografia, v. 57, n. 1, p. 56-62, 2005.
PCRJ - Prefeitura da cidade do Rio de Janeiro. Plano Diretor da Cidade. Lei Complementar n°111 de 1 de fevereiro de 2011.
PONZONI, Flávio Jorge; SHIMABUKURO, Yosio Edemir; KUPLICH, Tatiana Mora. Sensoriamento remoto da vegetação. Oficina de textos, 2015.
RUSSI, D. et al. The Economics of Ecosystems and Biodiversity for Water and Wetlands. IEEP, London; Brussels; Gland: Ramsar Secretariat, Gland, 2013.
SEABRA, V. S. ; ROCHA-LEÃO, O. M. Razões para as enchentes e inundações no residencial carlos marighella: uma análise multitemática da bacia do rio do vigário, em Maricá-RJ. Revista da ANPEGE, v. 15, n. 26, p. 114-137, 2019.
SILVA, Fabricio Sousa; PESTANA, Adauto Luis Moraes. Mapeamento da cobertura hídrica da microrregião da Baixada Maranhense com dados do sensor SAR Sentinel 1A. Revista Brasileira de Sensoriamento Remoto, v. 1, n. 2, 2021.
SLAGTER, Bart et al. Mapping wetland characteristics using temporally dense Sentinel-1 and Sentinel-2 data: A case study in the St. Lucia wetlands, South Africa. International Journal of Applied Earth Observation and Geoinformation, v. 86, p. 102009, 2020.
TAMIMINIA, Haifa et al. Google Earth Engine for geo-big data applications: A meta-analysis and systematic review. ISPRS journal of photogrammetry and remote sensing, v. 164, p. 152-170, 2020.
TEIXEIRA, S. G. Radar de abertura sintética aplicado ao mapeamento e reconhecimento de zonas úmidas costeiras. 2011. 127p. Tese (Doutorado em Geologia). Instituto de Geociências, Universidade Federal do Pará, Belém, 2011.
About the Authors
Evelyn de Castro Porto Costa is a postdoctoral researcher in Geography at the Federal University of Rio de Janeiro (UFRJ). She holds a PhD in Geography from the Federal Fluminense University (UFF), a Master’s degree from the State University of Rio de Janeiro (UERJ/FFP), a teaching degree from UERJ/FFP, and a Bachelor’s degree in Geography from UFF. She is currently an Associate Professor of Geosciences/Geotechnologies in the Geography Teacher Education Department at the Institute of Geography of the State University of Rio de Janeiro – Cabo Frio Campus (UERJ/CF). She is a member of the Space Laboratory for Remote Sensing and Environmental Studies (UFRJ) and the Physical Geography Laboratory (UFF). Her research focuses on geoinformation, cartography, remote sensing, and geotechnologies applied to territorial and environmental planning, as well as geography education.
Raúl Sánchez Vicens holds a Bachelor’s degree in Geography from the University of Havana (1991), a Master’s degree in Geography from the Federal University of Rio de Janeiro (1997), and a PhD in Geography from the Federal University of Rio de Janeiro (2003). He is currently a Full Professor at the Federal Fluminense University. He has extensive experience in the field of Geosciences, with an emphasis on Remote Sensing, working mainly on the following topics: vegetation cover and land use monitoring; landscape dynamics, evolution, and stability; and landscape classification and cartography.
Author Contributions
Conceptualization, [E.C.P.C., R.S.V.]; methodology, [E.C.P.C., R.S.V.]; validation, [E.C.P.C., R.S.V.]; formal analysis, [E.C.P.C., R.S.V.]; writing—original draft preparation, [E.C.P.C., R.S.V.]; writing—review and editing, [E.C.P.C., R.S.V.]; supervision, [R.S.V.]. All authors have read and agreed to the published version of the manuscript.
Funding
This research was supported by the Coordination for the Improvement of Higher Education Personnel – Brazil (CAPES) – Finance Code 001.
Data Availability
The data used in this research may be available upon request.
Conflicts of Interest
The authors declare no conflicts of interest.
About Coleção Estudos Cariocas
Coleção Estudos Cariocas (ISSN 1984-7203) is a publication dedicated to studies and research on the Municipality of Rio de Janeiro, affiliated with the Pereira Passos Institute (IPP) of the Rio de Janeiro City Hall.
Its objective is to disseminate technical and scientific production on topics related to the city of Rio de Janeiro, as well as its metropolitan connections and its role in regional, national, and international contexts. The collection is open to all researchers (whether municipal employees or not) and covers a wide range of fields — provided they partially or fully address the spatial scope of the city of Rio de Janeiro.
Articles must also align with the Institute’s objectives, which are:
- to promote and coordinate public intervention in the city’s urban space;
- to provide and integrate the activities of the city’s geographic, cartographic, monographic, and statistical information systems;
- to support the establishment of basic guidelines for the city’s socioeconomic development.
Special emphasis will be given to the articulation of the articles with the city's economic development proposal. Thus, it is expected that the multidisciplinary articles submitted to the journal will address the urban development needs of Rio de Janeiro.
[1] The scripts used in Google Earth Engine (GEE) were developed prior to the change in the platform’s access policies, which came into effect on November 13, 2024. As of that date, the creation of a project linked to the Google Cloud Platform has become mandatory for all users, including those with non-commercial projects, in order to access GEE.