
Volume 13 Issue 4 *Corresponding author lcteixeiracoelho@prefeitura.rio Submitted 14 Nov 2025 Accepted 06 Dec 2025 Published 30 Dec 2025 Citation TEIXEIRA COELHO, L. C. et al. The upward expansion of Rio de Janeiro: analyzing vertical urbanization through elevation model change. Coleção Estudos Cariocas, v. 13, n. 4, 2025. DOI: 10.71256/19847203.13.4.193.2025. The article was originally submitted in ENGLISH. Translations into other languages were reviewed and validated by the authors and the editorial team. Nevertheless, for the most accurate representation of the subject matter, readers are encouraged to consult the article in its original language.


| The upward expansion of Rio de Janeiro: analyzing vertical urbanization through elevation model change A expansão em altura do Rio de Janeiro: analisando a urbanização vertical através de mudanças em modelos de elevação La expansión en altura de Río de Janeiro: analizando la urbanización vertical mediante cambios en modelos de elevación Luiz Carlos Teixeira Coelho1*, Felipe Cerbella Mandarino2, Leandro Gomes Souza3, Adriana Mendes de Pinho Vial4, and Vania Regina Amorim da Silva5 1Instituto Municipal de Urbanismo Pereira Passos, R. Gago Coutinho, 52 - Laranjeiras, Rio de Janeiro - RJ, 22221-070, ORCID 0000-0002-4466-9772, lcteixeiracoelho@prefeitura.rio 2Instituto Municipal de Urbanismo Pereira Passos, R. Gago Coutinho, 52 - Laranjeiras, Rio de Janeiro - RJ, 22221-070, ORCID 0000-0001-9576-5257, felipe.mandarino@prefeitura.rio 3Instituto Municipal de Urbanismo Pereira Passos, R. Gago Coutinho, 52 - Laranjeiras, Rio de Janeiro - RJ, 22221-070, ORCID 0009-0005-4384-6887, leandro.souza@prefeitura.rio 4Instituto Municipal de Urbanismo Pereira Passos, R. Gago Coutinho, 52 - Laranjeiras, Rio de Janeiro - RJ, 22221-070, ORCID 0009-0001-2626-0359, adriana.vial@prefeitura.rio 5Instituto Municipal de Urbanismo Pereira Passos, R. Gago Coutinho, 52 - Laranjeiras, Rio de Janeiro - RJ, 22221-070, ORCID 0009-0001-7222-9280, vaniaregina@prefeitura.rio
AbstractThis study analyzes vertical urban growth in Rio de Janeiro using digital elevation models from 2013, 2019, and 2024. Through geospatial processing and filtering, a unified raster dataset was created to identify demolition, construction, and stable areas. The methodology supports applications such as monitoring informal settlements, assessing environmental risks, 3D visualization, urban planning, and interactive mapping, providing a tool for comprehensive urban change analysis. Keywords: urban growth, digital elevation model, LiDAR, photogrammetry, Rio de Janeiro ResumoEste estudo analisa o crescimento urbano vertical no Rio de Janeiro utilizando modelos digitais de elevação de 2013, 2019 e 2024. Por meio de processamento geoespacial e filtragem, foi criado um conjunto de dados raster unificado para identificar áreas de demolição, construção e estabilidade. A metodologia apoia aplicações como o monitoramento de assentamentos informais, avaliação de riscos ambientais, visualização 3D, planejamento urbano e mapeamento interativo, fornecendo uma ferramenta para uma análise abrangente da mudança urbana. Palavras-chave: crescimento urbano, modelo digital de elevações, LiDAR, fotogrametria, Rio de Janeiro ResumenEste estudio analiza el crecimiento urbano vertical en Río de Janeiro utilizando modelos digitales de elevación de 2013, 2019 y 2024. Mediante procesamiento geoespacial y filtrado, se creó un conjunto de datos raster unificado para identificar áreas de demolición, construcción y estabilidad. La metodología sirve para aplicaciones como monitoreo de asentamientos informales, evaluación de riesgos ambientales, visualización 3D, planificación urbana y mapeo interactivo, proporcionando una herramienta para un análisis integral del cambio urbano. Palabras clave: crecimiento urbano, modelo digital de elevación, LiDAR, fotogrametría, Río de Janeiro |
Introduction
1.1 The impact of uncontrolled vertical urban growth in Rio de Janeiro
The city of Rio de Janeiro is characterized by a highly complex dynamic in its formal and informal real estate market. Composed of a mosaic of valleys and mountains, the plains have historically been privileged as areas of noble occupation, while irregular constructions have proliferated in areas of lower real estate interest, such as mountain slopes, swamps, and territories farther from the center. In recent years, this dynamic has become even more complex, as limitations on the horizontal expansion of favelas, subdivisions, and occupations have led to more pronounced verticalization—either through the addition of floors to existing buildings or through the irregular construction of multi-family buildings.
In the past, slums expanded in precarious ways, with new shacks added to deforested land. However, as available land has become scarce and organized crime has taken control of large informal settlements, patterns of irregular construction have begun to resemble those of middle-class condos and apartment buildings. Unfortunately, their structure is often not sound enough, leading to incidents such as the collapse of two five-story irregular buildings in the Muzema neighborhood, as depicted in Figure 1 and widely reported in the press.
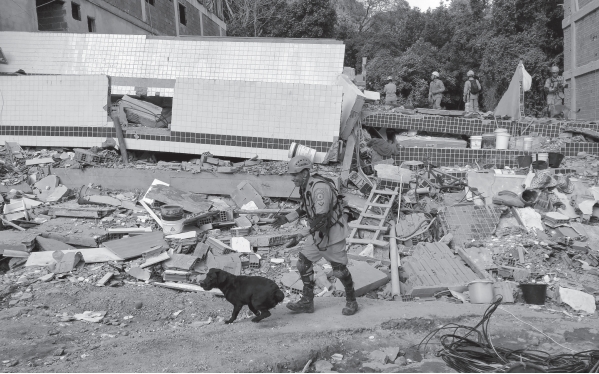 Figure 1: Collapse of two irregularly built buildings in the Muzema neighbourhood.
Source: Claudia Martini (under a Creative Commons license), 2019.
Such trends present formidable risks to residents, reduce urban green space and increase land surface temperature (Yuan et al., 2021). The precariousness of construction – especially in poor neighborhoods and slums – makes them prone to all sorts of accidents and natural hazards. Major stakeholders must have, at their disposal, tools that help understand not only how the city spreads horizontally but also how new storeys are added to extant construction.
Furthermore, Rio de Janeiro faces a challenge common across Latin America: informal expansion even within formal areas. This occurs as middle-class residents frequently self-build and modify their homes without seeking official permits from the municipality. Therefore, the management of informal urban expansion, a challenge Rio de Janeiro shares with many Latin American cities, is severely hampered by the absence of a modern cadastral system. This requires a continuously updated base map dynamically linked to a geodatabase that integrates administrative, fiscal, and territorial information.
1.2 The evolution of official favela cadasters in Rio de Janeiro
For over forty years, the Pereira Passos Institute has been monitoring the evolution of low‑income settlements in the city of Rio de Janeiro. In 1982, the first favela cadaster was established within the then IPLANRIO. Through the gradual introduction of improvements and new technological resources, this registry evolved into the Low‑Income Settlement System – SABREN, which is available on DATA.RIO for the entire City Administration and civil society.
From 1999 to 2019, only the horizontal expansion of favela areas was measured by comparing them with previous years. Vertical growth was not accounted for, despite being observed for some time in various parts of the city, especially in Planning Areas 1 and 2, which roughly comprise the city’s Downtown, Southern Zone and Greater Tijuca.. In the context of favelas, vertical growth results primarily from the lack of available land for horizontal expansion and insufficient public housing policies. It tends to occur in already densely occupied favelas where land values are higher.
This disorderly vertical growth causes various environmental and social problems, given that it is not always accompanied by adequate planning to ensure balanced urban development and preserve the quality of life of citizens. The environmental and social effects are largely negative and become even more intense in low‑income areas, since many of the constructions are unlicensed and located in environmentally fragile zones.
Among the most frequent environmental impacts are the shading of public spaces by buildings; thermal discomfort caused by poor air circulation, leading to heat islands; and increased air and noise pollution. In addition, there is a heightened risk of flooding and landslides, especially in more vulnerable areas, and increased demand for natural resources. In terms of social impacts, it creates pressure on infrastructure and public services, as well as negative repercussions for urban mobility. In other words, this type of growth can worsen existing urban problems, leading to infrastructure overload and safety risks for residents.
1.3 Three-dimensional geospatial data as a means of understanding urban growth
In the challenging context of Rio de Janeiro, where irregular construction is widespread and often occurs vertically, it is crucial for urban management to thoroughly understand the location and nature of this upward growth, particularly in informal settlements known as favelas. Conventional image classification methods tend to focus on horizontal urban expansion, but accurately assessing and comprehending vertical growth is essential for developing effective public policies that respond to the needs of a constantly evolving population.
Until recently, informal growth analyses relied solely on planimetric cartographic bases, such as orthoimage mosaics, which only allowed monitoring of the city’s horizontal expansion. Although elevation data from the last photogrammetric survey in 2013 was available (with building heights recorded as attributes in a database), this information lacked inherent spatial representation, posing a significant constraint for detailed vertical analysis.
This limitation was decisively overcome in 2019 with the execution of a comprehensive planialtimetric survey using high-resolution LiDAR technology. This advancement in data collection produced a detailed portrait that captured not only the natural terrain but also every engineered structure and building across the municipality. The subsequent 2024 survey, again covering the entire territory, provided a second, equally detailed three-dimensional surface model, finally enabling direct and precise temporal comparison of vertical growth.
This article presents a methodology for comparing 2013 building polygon data with the 2019 and 2024 LiDAR-derived Digital Elevation Models to assess multitemporal vertical growth in Rio de Janeiro. The challenges of integrating these disparate databases are addressed, and the feasibility of using this approach as a reliable information source is discussed. The article begins with a detailed description of each database, including accuracy and limitations. It then outlines the procedures and workflow adopted, followed by an analysis of the results obtained through geospatial algebraic operations. Finally, the potential applications of this data as a valuable resource for understanding urban growth in Rio de Janeiro are evaluated.
- Materials and Methods
The materials and methods used in this study are described below. For illustrative purposes, figures within this section depict the same area of Rocinha; however, the analysis was performed on the complete datasets covering the entire city of Rio de Janeiro.
2.1 Geospatial databases used for this study
This study utilized a series of geospatial databases, including building footprints, LiDAR point clouds, contour lines, digital elevation models, and orthoimagery.
2.1.1 Polygons of buildings obtained through photogrammetric restitution (referenced to 2013 and 2019)
Between 2015 and 2020, a comprehensive vector database of building footprints across Rio de Janeiro was compiled through photogrammetric restitution techniques (Coelho; Brito, 2007; Kraus, 1992), based on aerial imagery captured in 2013 (Topocart Aerolevantamentos, 2013). This dataset provides a detailed planimetric and altimetric representation of all buildings in the city as of that year. As illustrated in Figure 2, the database consists of vector polygons with height attributes stored as three-dimensional coordinates, offering a continuous representation of building elevations. The data conforms to the Brazilian PEC-PCD 1:2000 scale Class A accuracy standard for geospatial databases, with a vertical standard error of 0.17 m (Comissão Nacional de Cartografia, 2016).
All polygons are georeferenced to the UTM zone 23S coordinate system, using SIRGAS 2000 as the horizontal datum and the Imbituba tidal gauge for vertical reference. Furthermore, this building footprint database was updated in 2023. For such task, the 2019 aerial survey (orthoimages and digital elevation models) was used, thus producing an additional building footprint dataset (Figure 3).
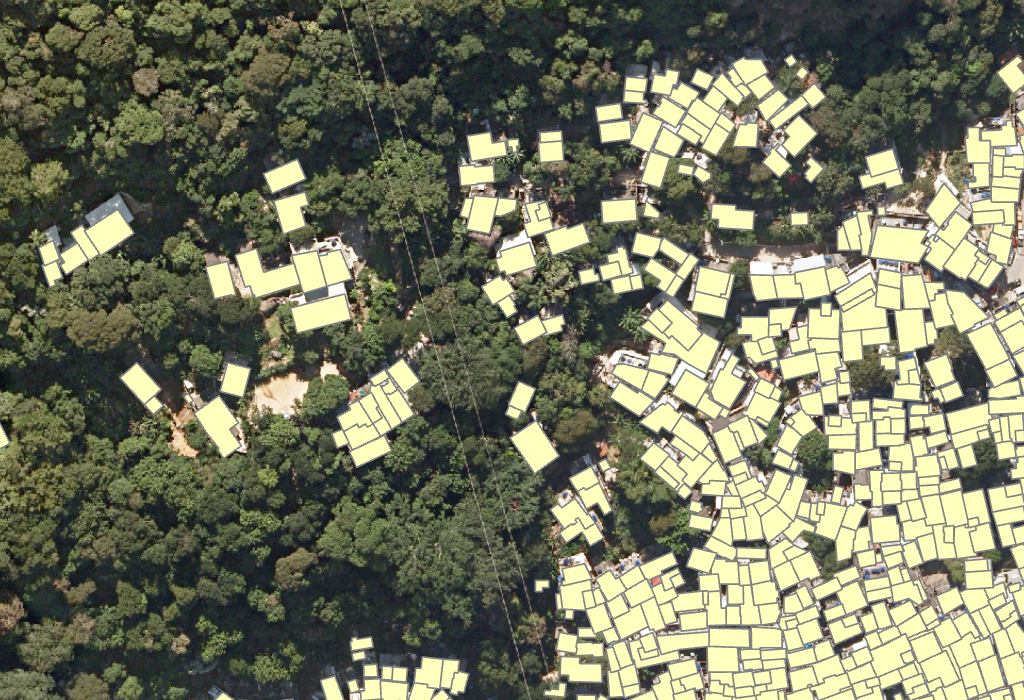 Figure 2: Building polygons derived from the 2013 photogrammetric restitution
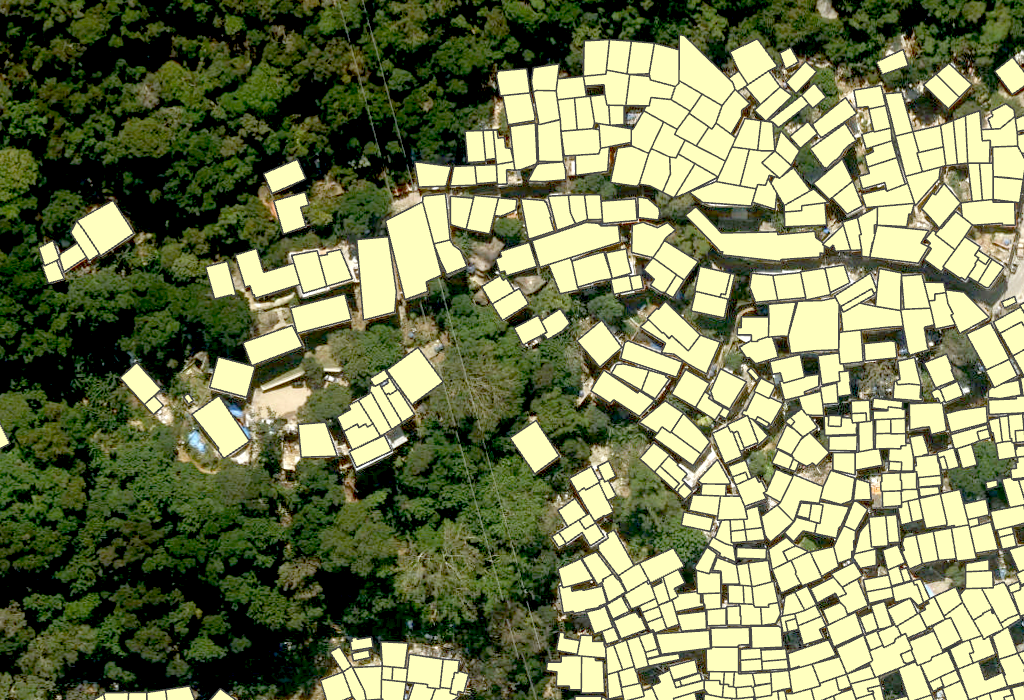 Figure 3: Building polygons updated according to the 2019 orthoimagery
2.1.2 Digital terrain model based on photogrammetric contour lines (referenced to 2013)
A digital terrain model (DTM) was generated in 2013 through stereoscopic correlation of optical aerial imagery (Kreiling, 2009). This process also produced 1:2000 scale maps and contour lines (Figure 4), which were subsequently interpolated into a continuous elevation model. The resulting DTM complies with the Brazilian PEC-PCD 1:2000 scale Class A accuracy standard, exhibiting a vertical standard error of 0.33 m (Comissão Nacional de Cartografia, 2016). The contour lines and DTM are referenced to the UTM zone 23S coordinate system (SIRGAS 2000 horizontal datum, Imbituba vertical datum).
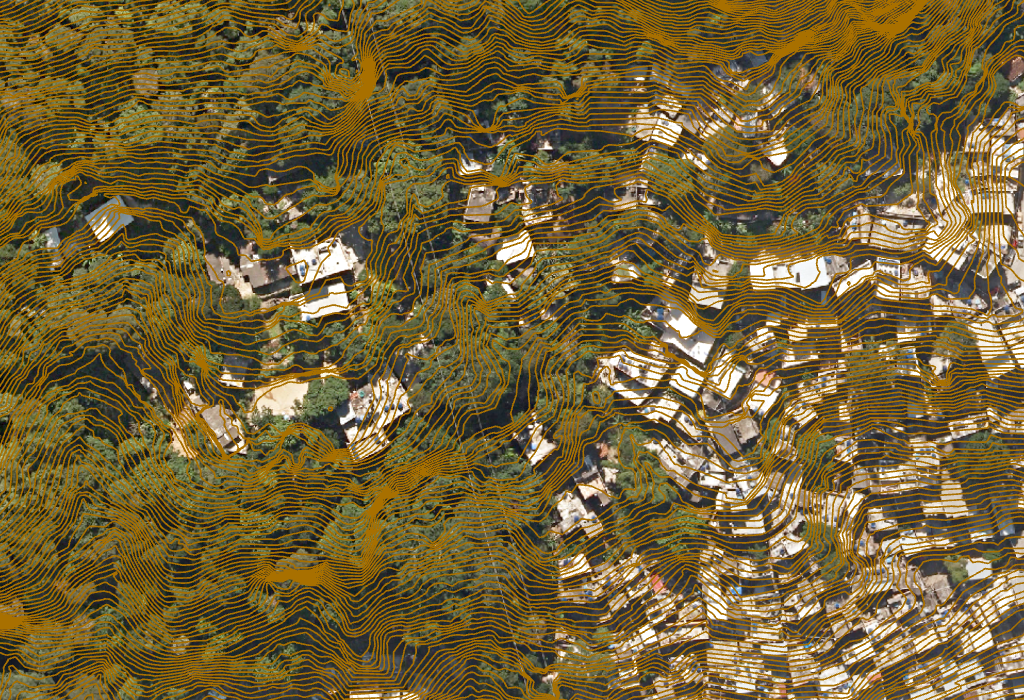 Figure 4: Contour lines derived from the 2013 photogrammetric restitution
2.1.3 Digital elevation model obtained by LiDAR (referenced to 2019)
In 2019, a city-wide LiDAR (Light Detection and Ranging) survey was conducted at a resolution of 8 points per m². This survey generated both digital terrain models (DTMs) and digital surface models (DSMs), capturing ground surfaces as well as elevated features such as buildings, vegetation, and infrastructure (Wolf; Dewitt; Wilkinson, 2014). The survey, performed by Topocart Aerolevantamentos using Trimble Harrier equipment (Topocart Aerolevantamentos, 2019), delivered data in both .LAS (point cloud) and raster formats. As shown in Figure 5, the products meet PEC-PCD Class A standards at 1:5000 scale, with a vertical standard error of 0.34 m for elevation data (Comissão Nacional de Cartografia, 2016).
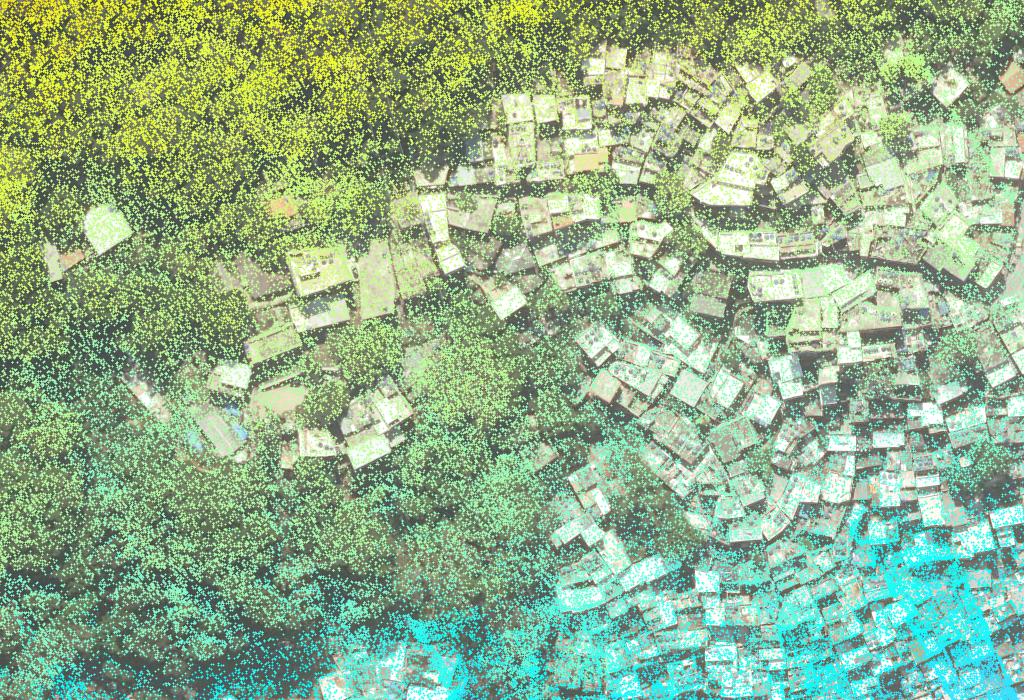
Figure 5: LiDAR point cloud (8 points/m²) overlaid on orthomosaic imagery, both acquired during the 2019 survey
2.1.4 Digital elevation model obtained by LiDAR (referenced to 2024)
A second city-wide LiDAR survey was conducted in 2024, maintaining the same resolution of 8 points per m². This survey similarly produced both DTMs and DSMs, ensuring methodological consistency with the 2019 campaign. Topocart Aerolevantamentos performed the survey using an Optech Galaxy Prime+ system (Topocart Aerolevantamentos, 2024). The delivered products—available in .LAS and raster formats (Figure 6)—comply with the same PEC-PCD Class A standards at 1:5000 scale (vertical standard error: 0.34 m), guaranteeing full compatibility between the two temporal datasets (Comissão Nacional de Cartografia, 2016).
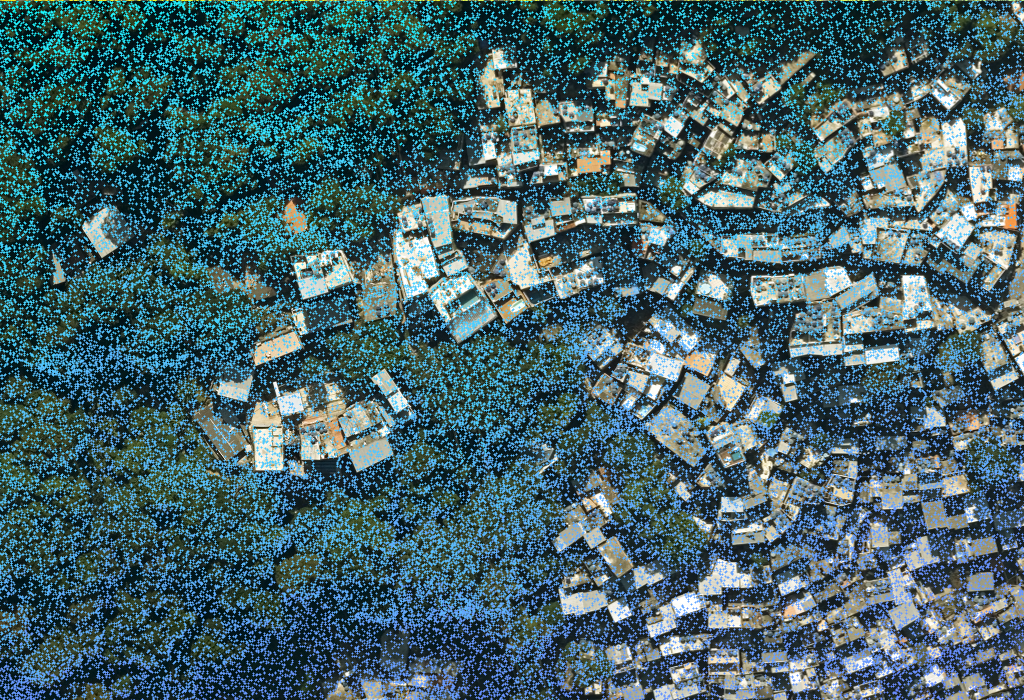 Figure 6: LiDAR point cloud (8 points/m²) overlaid on orthomosaic imagery, both acquired during the 2024 survey
2.1.5 True orthophotos (referenced to 2013, 2019 and 2024)
The aerial survey that produced the 2013 photogrammetric restitution also produced orthoimagery obtained through differential rectification of aerial images by using a digital terrain model and, as such, may not be considered "true orthophotos." Nevertheless, they were used mostly for analyzing the general distribution of the built environment in that year.
Figure 7 shows a sample of this product for the same area in Rocinha used for all sample geospatial products throughout this section. Simultaneous with the LiDAR surveys, panchromatic digital sensors captured aerial imagery of Rio de Janeiro in both 2019 and 2024. These images were orthorectified (Lerma García, 2002; Mikhail; Bethel; McGlone, 2001) using the corresponding LiDAR-derived elevation models to produce "true orthophotos" that effectively eliminate parallax distortions by accounting for terrain and object heights (Brito, 1997). The orthoimagery includes blue, green, red, and near-infrared spectral bands and conforms to PEC-PCD 1:5000 scale Class A accuracy standards, with a planimetric standard error of 0.85 m (Comissão Nacional de Cartografia, 2016). All images are georeferenced to UTM zone 23S (SIRGAS 2000) and use the Imbituba datum for vertical reference. Figures 8 and 9 demonstrate these orthophotos.
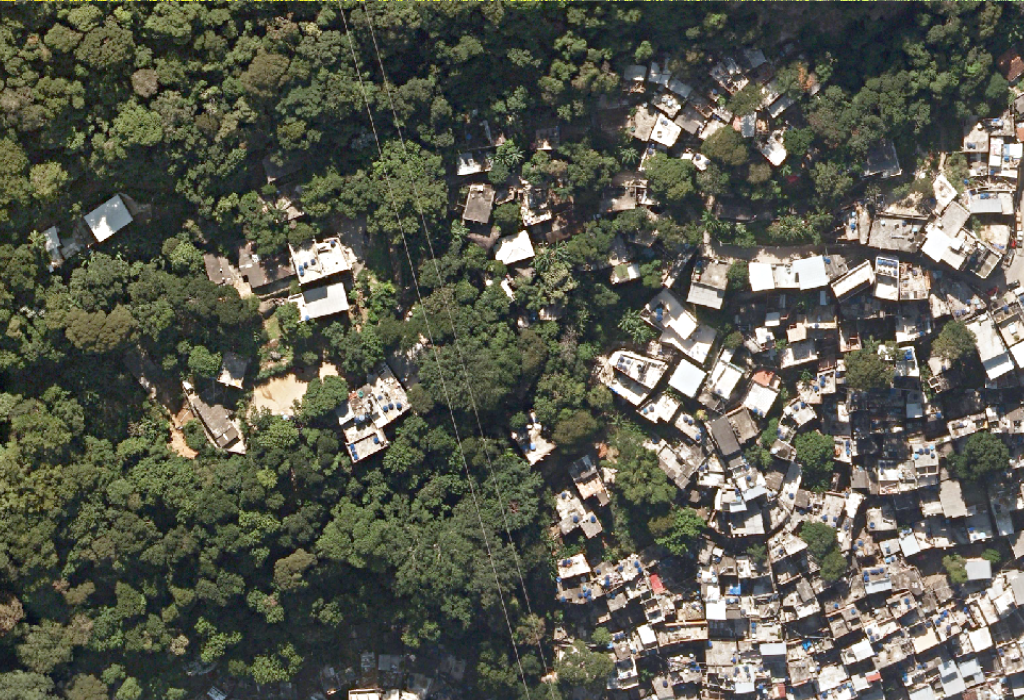 Figure 7: Orthoimagery obtained alongside the photogrammetric restitution for 2013
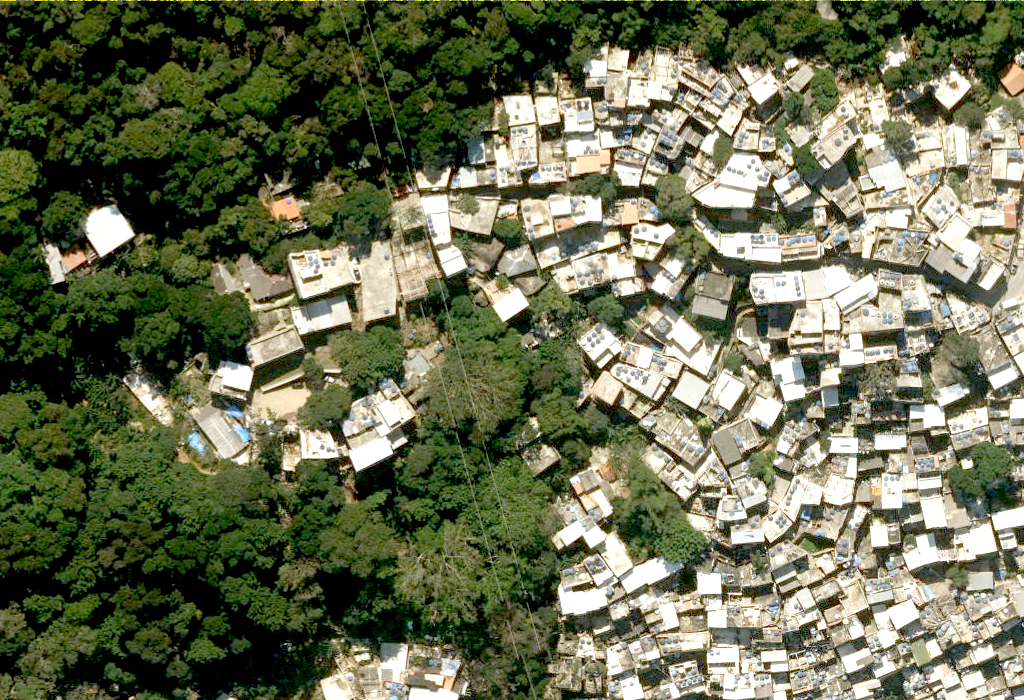 Figure 8: True orthoimagery obtained alongside the photogrammetric restitution for 2019
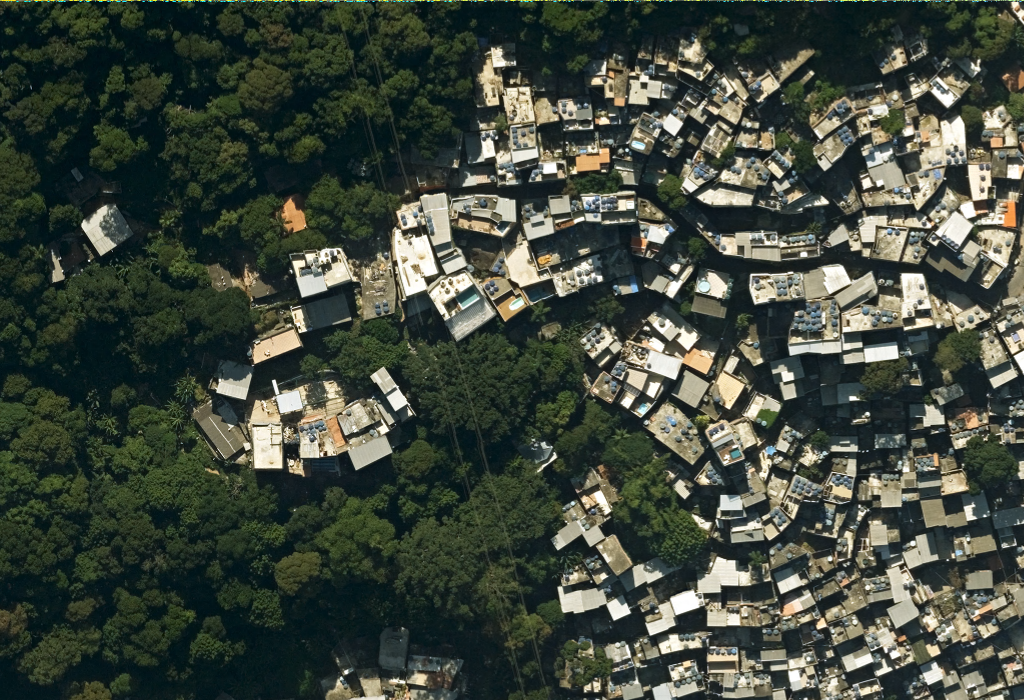 Figure 9: True orthoimagery obtained alongside the photogrammetric restitution for 2024
2.2 Methodology
This research sought to analyze the spatiotemporal patterns of vertical urban growth in Rio de Janeiro across three different years: 2013, 2019, and 2024. The proposed methodology involved a comparative analysis of digital elevation models (DEMs) using raster algebra. By sequentially subtracting earlier elevation models from subsequent ones, the process generated a differential surface. This output classifies urban change: positive values indicate new construction and vertical expansion, negative values signify the demolition of structures, and (close to) null values represent areas of stability with no vertical change.
Previous work has been carried out by comparing similar sets of panchromatic imagery and digital terrain models (Tian; Cui; Reinartz, 2014). In the Rio de Janeiro case, however, there are a few caveats to using methodologies conceived for comparing similar datasets. In this specific case, the 2013 products are rather different in nature, so a unique strategy had to be addressed. All methodological steps were performed in ArcGIS Pro 3.0 (and above) and are further explained below.
2.2.1 Generation of a 2013 building elevation model
A hybrid elevation model was generated for the entire municipality for 2013 by integrating extruded building vectors with a bare-earth digital terrain model (DTM). This synthetic model represents a built-surface elevation model (BEM), as it captures building heights while excluding vegetation and other non-building structures.
The processing workflow began with the photogrammetrically restituted 2013 building vectors. These 2D polygons were first converted into a 3D multipatch feature, extruding each building based on its recorded height attribute to create a continuous, three-dimensional representation that included complex architectural features such as porches, marquees, and terraces.
This 3D multipatch was then converted to a raster format with a spatial resolution of 0.5 m per pixel, resulting in a building elevation model (Figure 10). This resolution was selected to balance city-wide processing efficiency with the need to resolve individual buildings accurately.
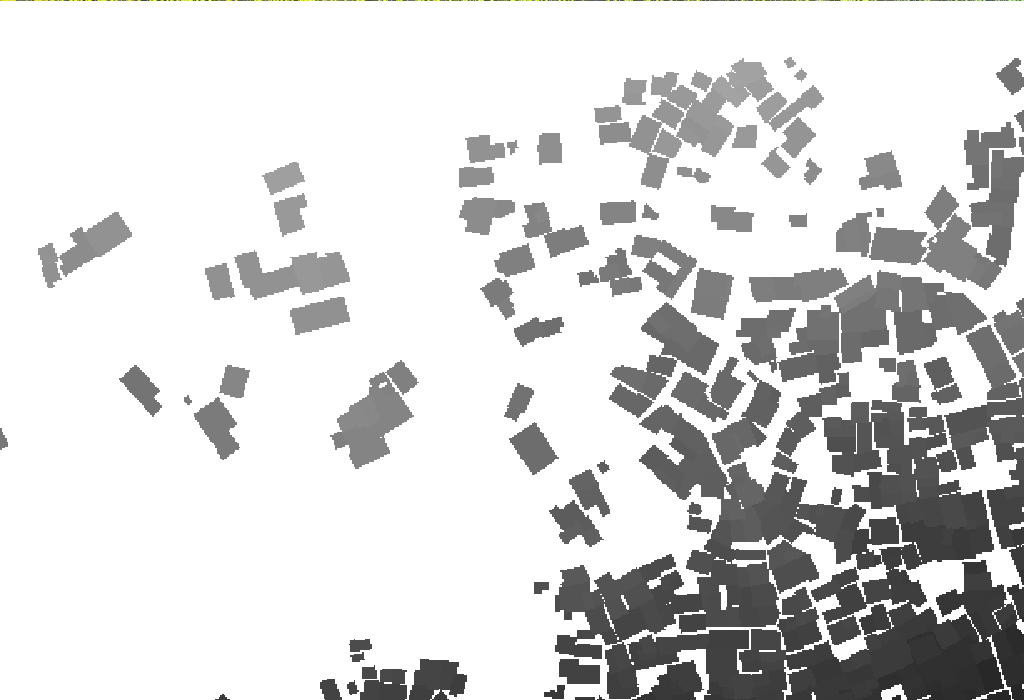 Figure 10: Extruded building footprints according to roof altitude
The final synthetic city model was created by merging this building elevation raster with a 0.5m-resolution DTM derived from 2013 photogrammetric contours. In this fusion, the building raster values superseded the DTM values at their corresponding locations, effectively placing the 3D buildings onto the terrain surface (Figure 11). The composite model was clipped to the official municipal boundary and resampled to a consistent 0.5 m/pixel resolution for analysis.
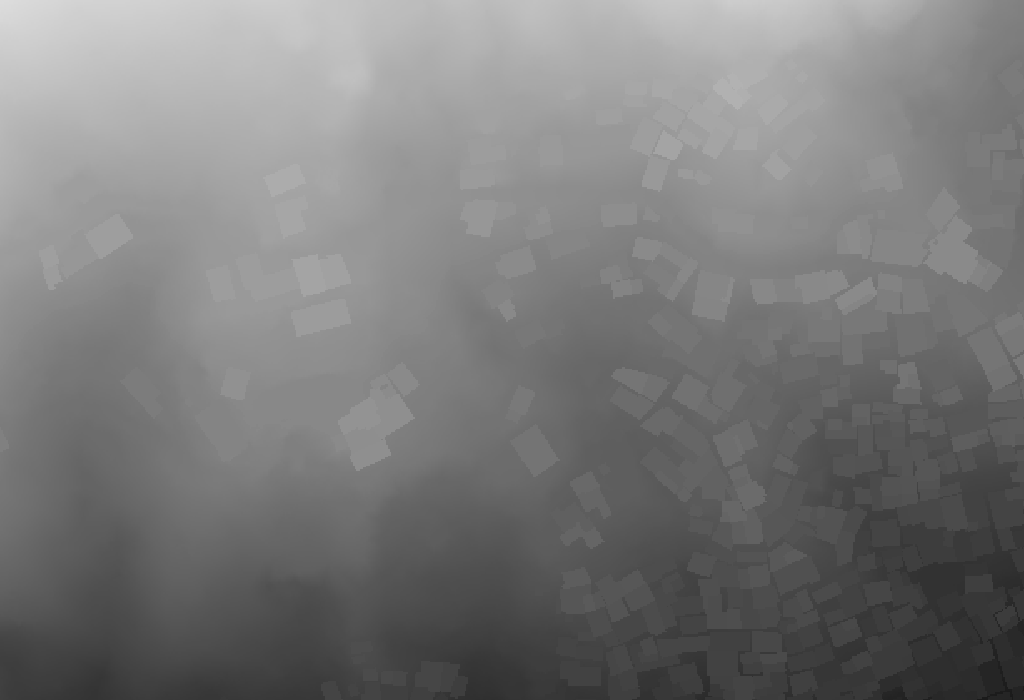 Figure 11: Building elevation model for 2013
2.2.2 Creation of building elevation models for 2019 and 2024
In contrast to the 2013 synthetic model, the 2019 and 2024 datasets were derived from LiDAR point clouds, which represent true surface models capturing buildings, terrain, vegetation, and other urban features. To ensure comparability with the 2013 building elevation model (BEM), the .LAS files were filtered to exclude points classified as medium and high vegetation (ASPRS, 2018). This process retained points classified as buildings, ground, and low vegetation—the latter of which exhibits an elevation profile similar to ground surfaces.
The filtered point clouds were then converted into seamless raster digital surface models (DSMs) at a 0.5 meter spatial resolution. Finally, these DSMs were clipped to the official municipal boundary. This resulted in two raster models (Figures 12 and 13) that were functionally compatible with the 2013 BEM for subsequent change detection analysis.
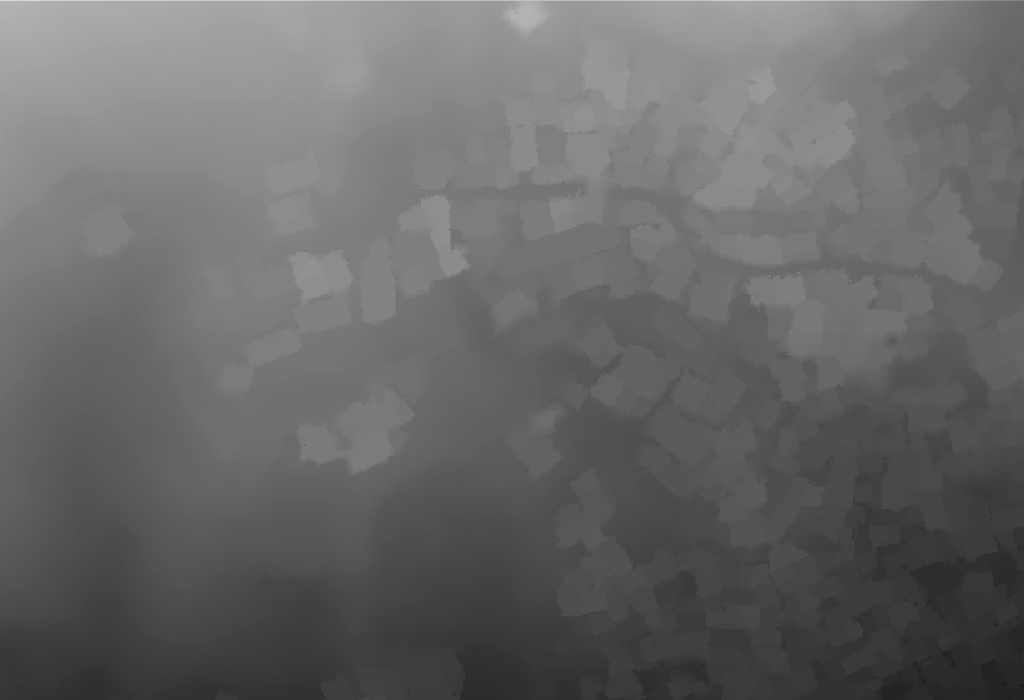 Figure 12: Building elevation model for 2019
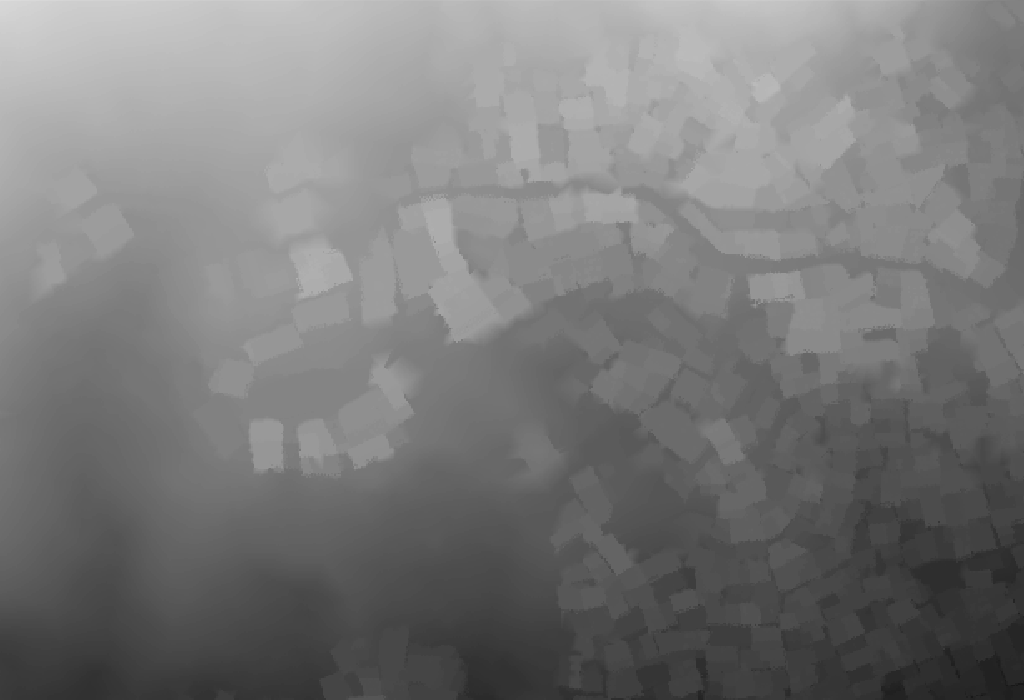 Figure 13: Building elevation model for 2024
2.2.3 Digital Elevation Model subtraction (map algebra)
Both raster datasets were subjected to a map algebra subtraction operation, which calculated the difference in heights of the overlapping pixels in the two images. The resulting output indicates the areas where there was a significant positive difference (indicating vertical growth), negative difference (indicating demolition), or no difference (indicating no vertical change). Figure 14 shows a diagram of possible outputs derived from model subtraction.
However, it is worth noting that the analysis may be affected by errors caused by vegetation cover and structures not classified as buildings, which can lead to inaccurate results. Also, minor errors may stem from raster misalignment, even though pixel sizes are small enough to guarantee this will not result in the capture of new building activity.
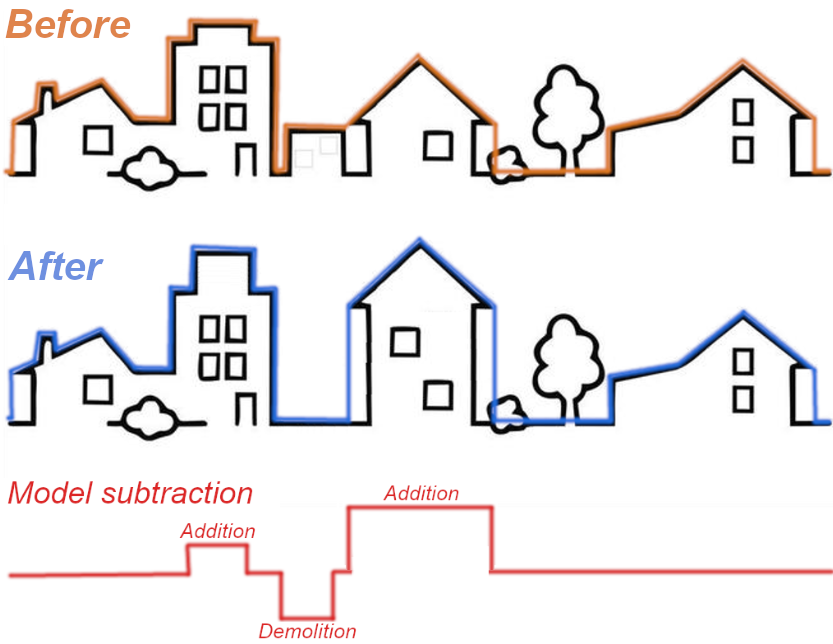 Figure 14: Schematic diagram of possible outputs derived from model subtraction
2.2.4 Filtering procedures
The NDVI index, which stands for normalized difference vegetation index, is used to identify healthy vegetation. It is calculated by subtracting the value of light reflected in the near-infrared band (NIR) from the value of light reflected in the red band (Red), and then dividing the result by the sum of both values, as shown in Equation 1 (Lillesand; Kiefer; Chipman, 2015). A pixel-to-pixel index is calculated for each pixel in the image, and the resulting values range from -1 to 1. A value above 0.4 indicates the presence of healthy vegetation.
 (1)
(1)
Using the NDVI values for the entire municipal territory, a binary mask was generated, assigning a value of 0 to pixels where the index is less than 0.4 and a value of 1 to pixels where the index is greater than or equal to 0.4. This mask was applied to the map subtraction result to eliminate most of the artifacts caused by the presence of trees in the 2019 and 2024 models, thus limiting the analysis to non-vegetated areas.
Additional procedures were also performed to clean the image of noise in rocky, asphaltic areas, and waterways. Rocky outcrops and water bodies were masked using the 2019 land use polygons, and morphological filtering (Ibid.) was applied through erosion of 1 pixel followed by dilation of 1 pixel.
Figure 15 shows how these procedures, in addition to NDVI filtering, helped to remove a considerable amount of noise from the original Digital Elevation Model.
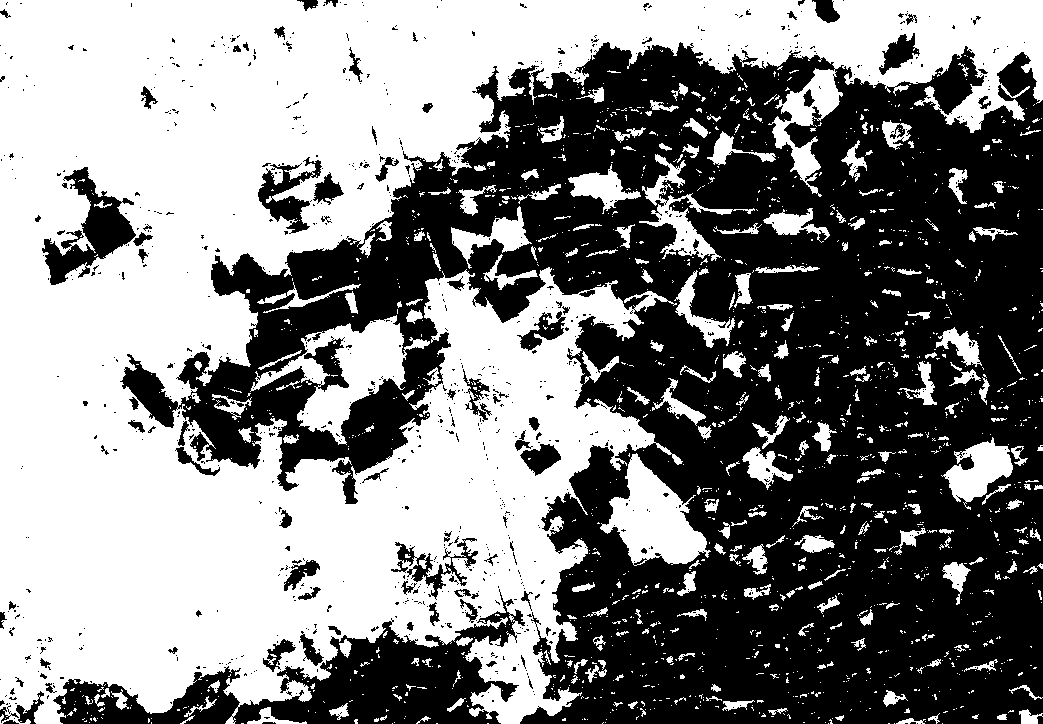 Figure 15: NDVI mask for 2019
2.2.5 Image classification and zonal statistics per building
Image classification based on elevation difference values, into the following classes:
- -3 – Elevation differences below -3m (demolition)
- 0 – Absolute elevation differences less than 3m (inconclusive: cannot determine
- addition or demolition)
- 3 – Elevation differences above 3m and below 6m (addition of 1 floor)
- 6 – Elevation differences above 6m and below 9m (addition of 2 floors)
- 9 – Elevation differences above 9m and below 12m (addition of 3 floors)
- 12 – Elevation differences above 12m and below 15m (addition of 4 floors)
- 15 – Elevation differences above 15m (addition of 5 or more floors)
These class intervals were defined based on a 3-meter threshold, which safely exceeds the typical height added (or demolished) per floor. This margin also reliably accounts for potential systematic errors in the same direction (even if all standard errors were combined, they would not exceed 1m) and, in most cases, eliminates elevation differences resulting solely from roof slope.
So far, the analysis has been entirely raster-based. To enhance this, zonal statistics — including measures of central tendency (mean, median, and mode) — were computed for each vector-based building footprint to estimate the mean vertical growth. However, due to the unavailability of building footprint datasets for 2024, this analysis was limited to building footprints in 2013 and 2019.
Nevertheless, converting the raster-based results into a vector format enables full integration into Geographic Information Systems (GIS) and facilitates advanced 3D visualization, significantly improving interpretability and supporting more sophisticated spatial analysis.
- Results
3.1 Raster datasets
Figures 16 and 17 illustrate the resulting vertical change maps for the periods 2019-2013 and 2024-2019, respectively. For clarity, both maps depict the same sample area within Rocinha.
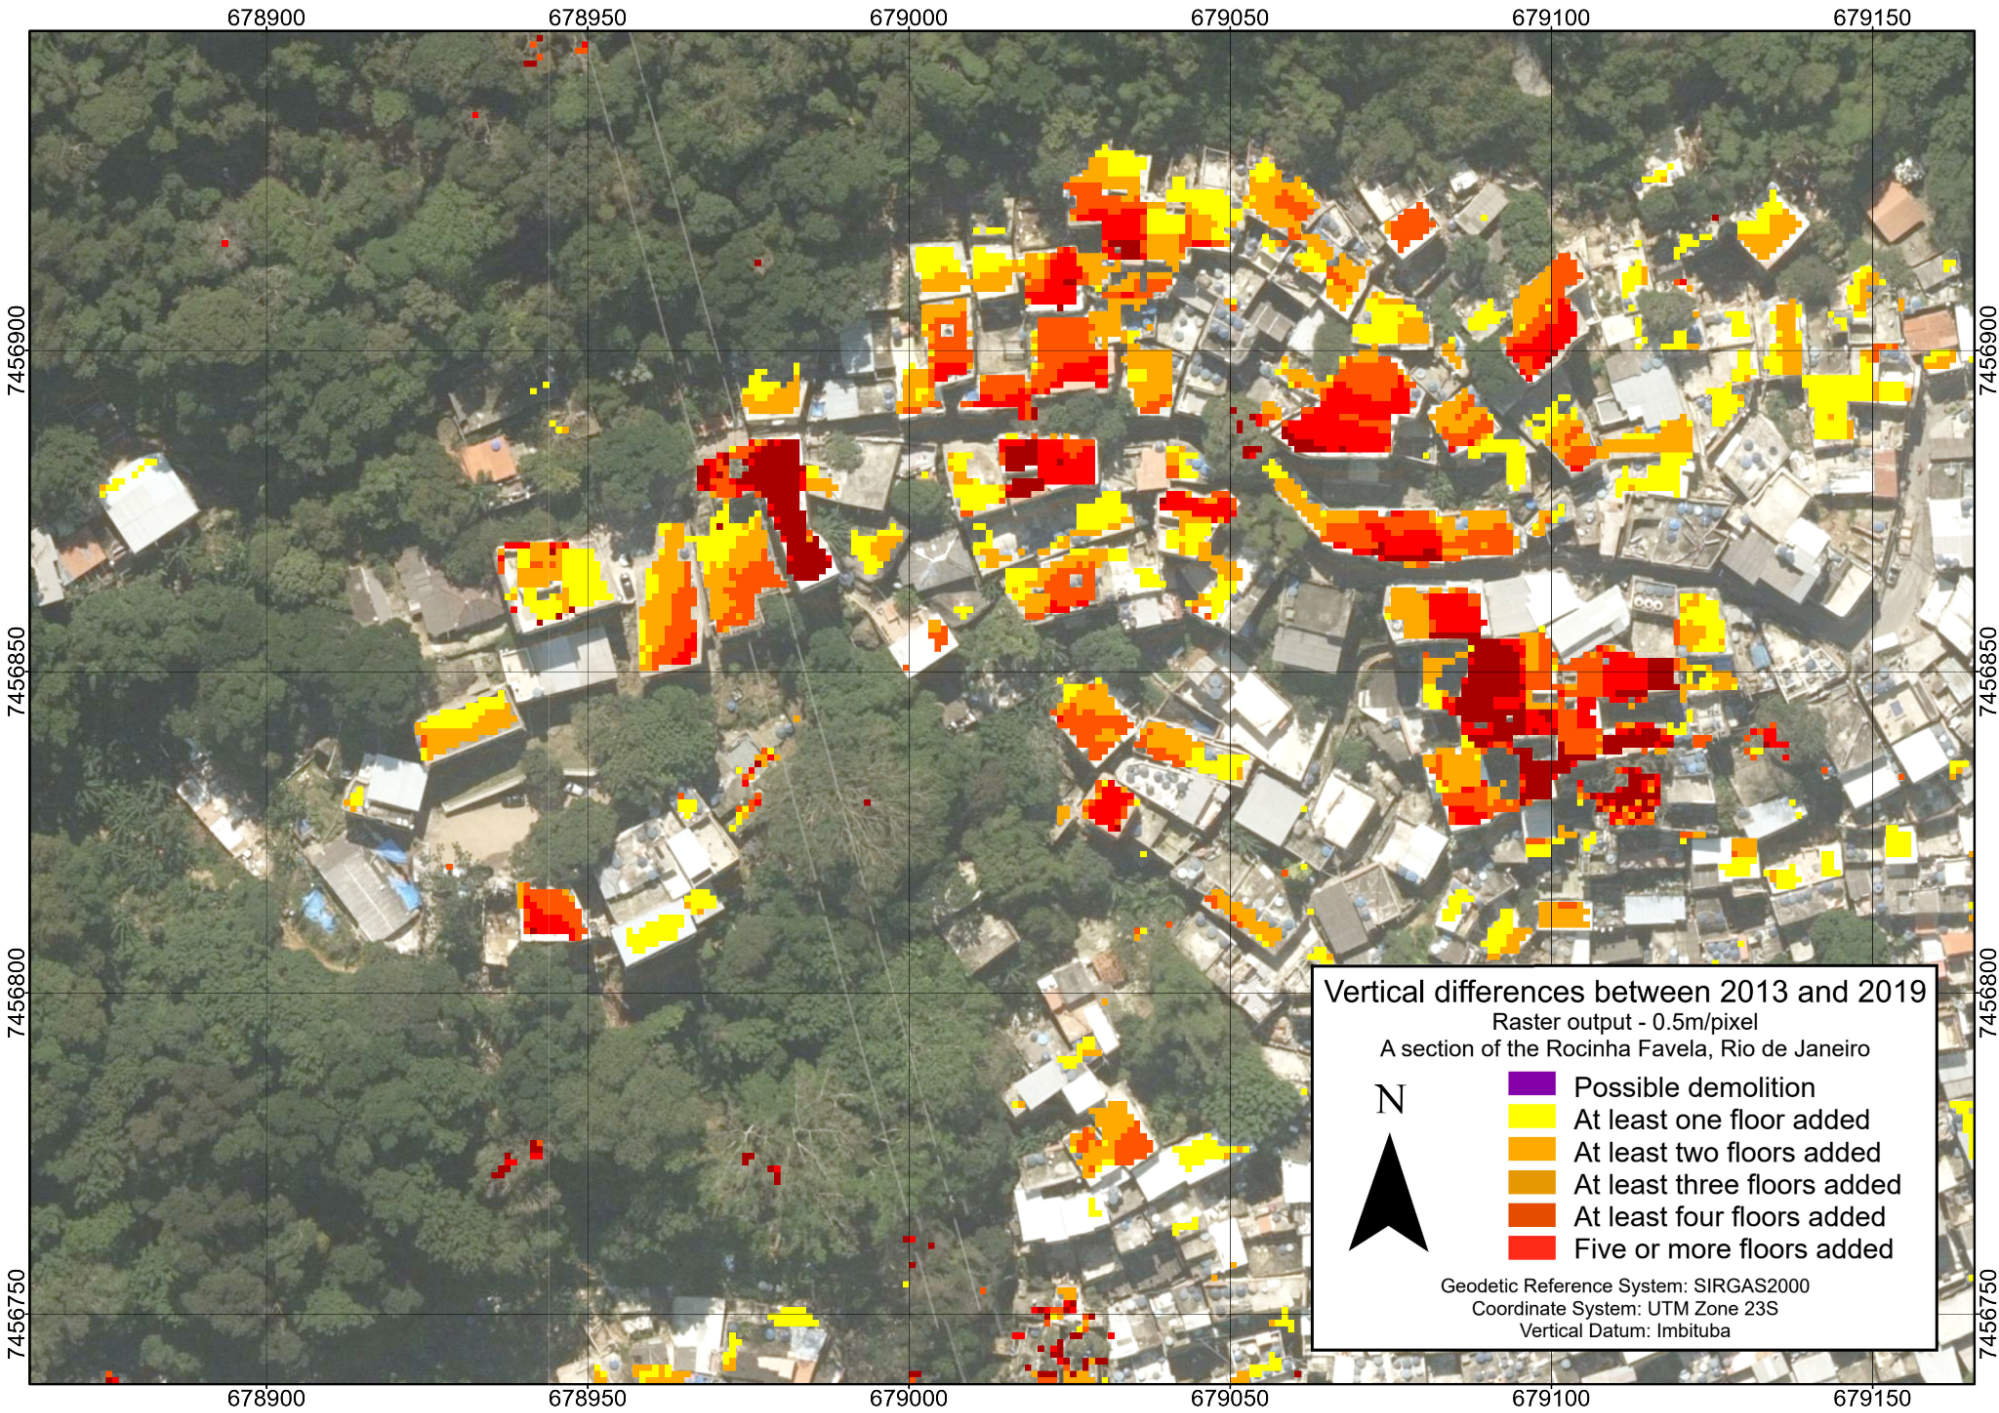
Figure 16: Raster dataset portraying building elevation models subtraction (2019 minus 2013)
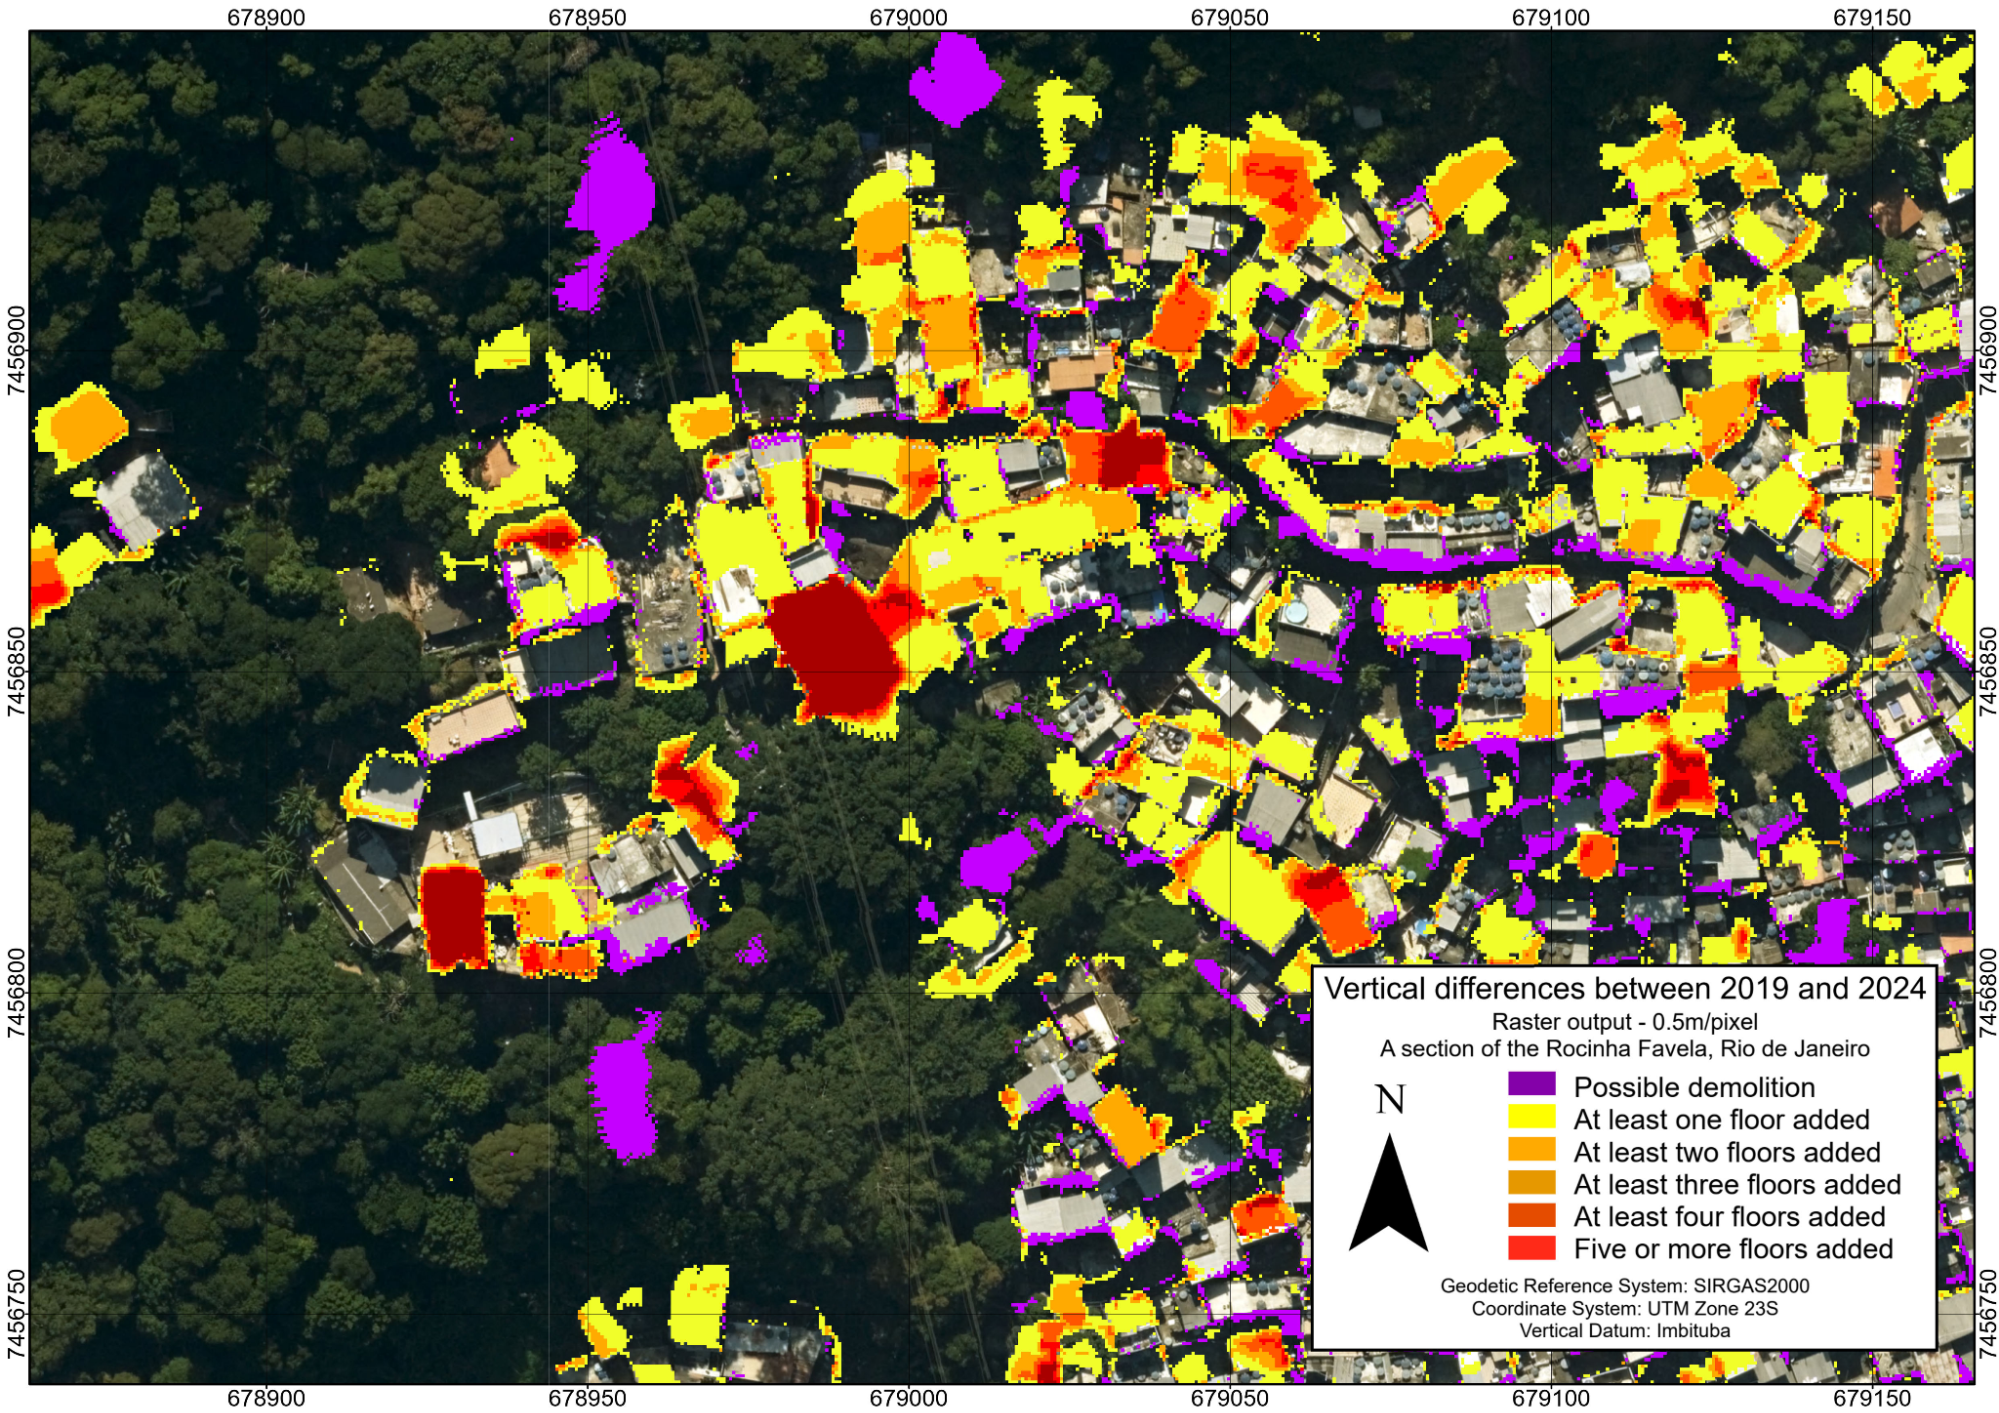
Figure 17: Raster dataset portraying building elevation models subtraction (2024 minus 2019)
The initial differential raster dataset was challenging to analyze and disseminate due to its large file size, which resulted from storing raw elevation values and residual noise. To resolve this, we reclassified the data into 3-meter intervals (see subsection 2.2.5). It is noticeable that, while raster datasets conform as closely to the subtraction of builiding elevation models, they still present considerable noise accross edges. This efect is even more noticeable in Figure 17, despite all best attempts at eliminating noise.
3.2 Vector datasets
In comparison, Figures 18 and 19 depict the mean vertical growth summarized within the building footprints from 2013 and 2019, respectively. A visual comparison with the raster figures (16 and 17) reveals a key limitation of the zonal statistics approach: it cannot detect new constructions built on previously vacant land, as these areas lack a corresponding polygon in the base year. Consequently, while the vector product offers a clearer visualization of morphological changes for existing buildings, the raster product provides a more complete and accurate picture by capturing all vertical change, including new construction, despite being noisier and more complex to visualize.
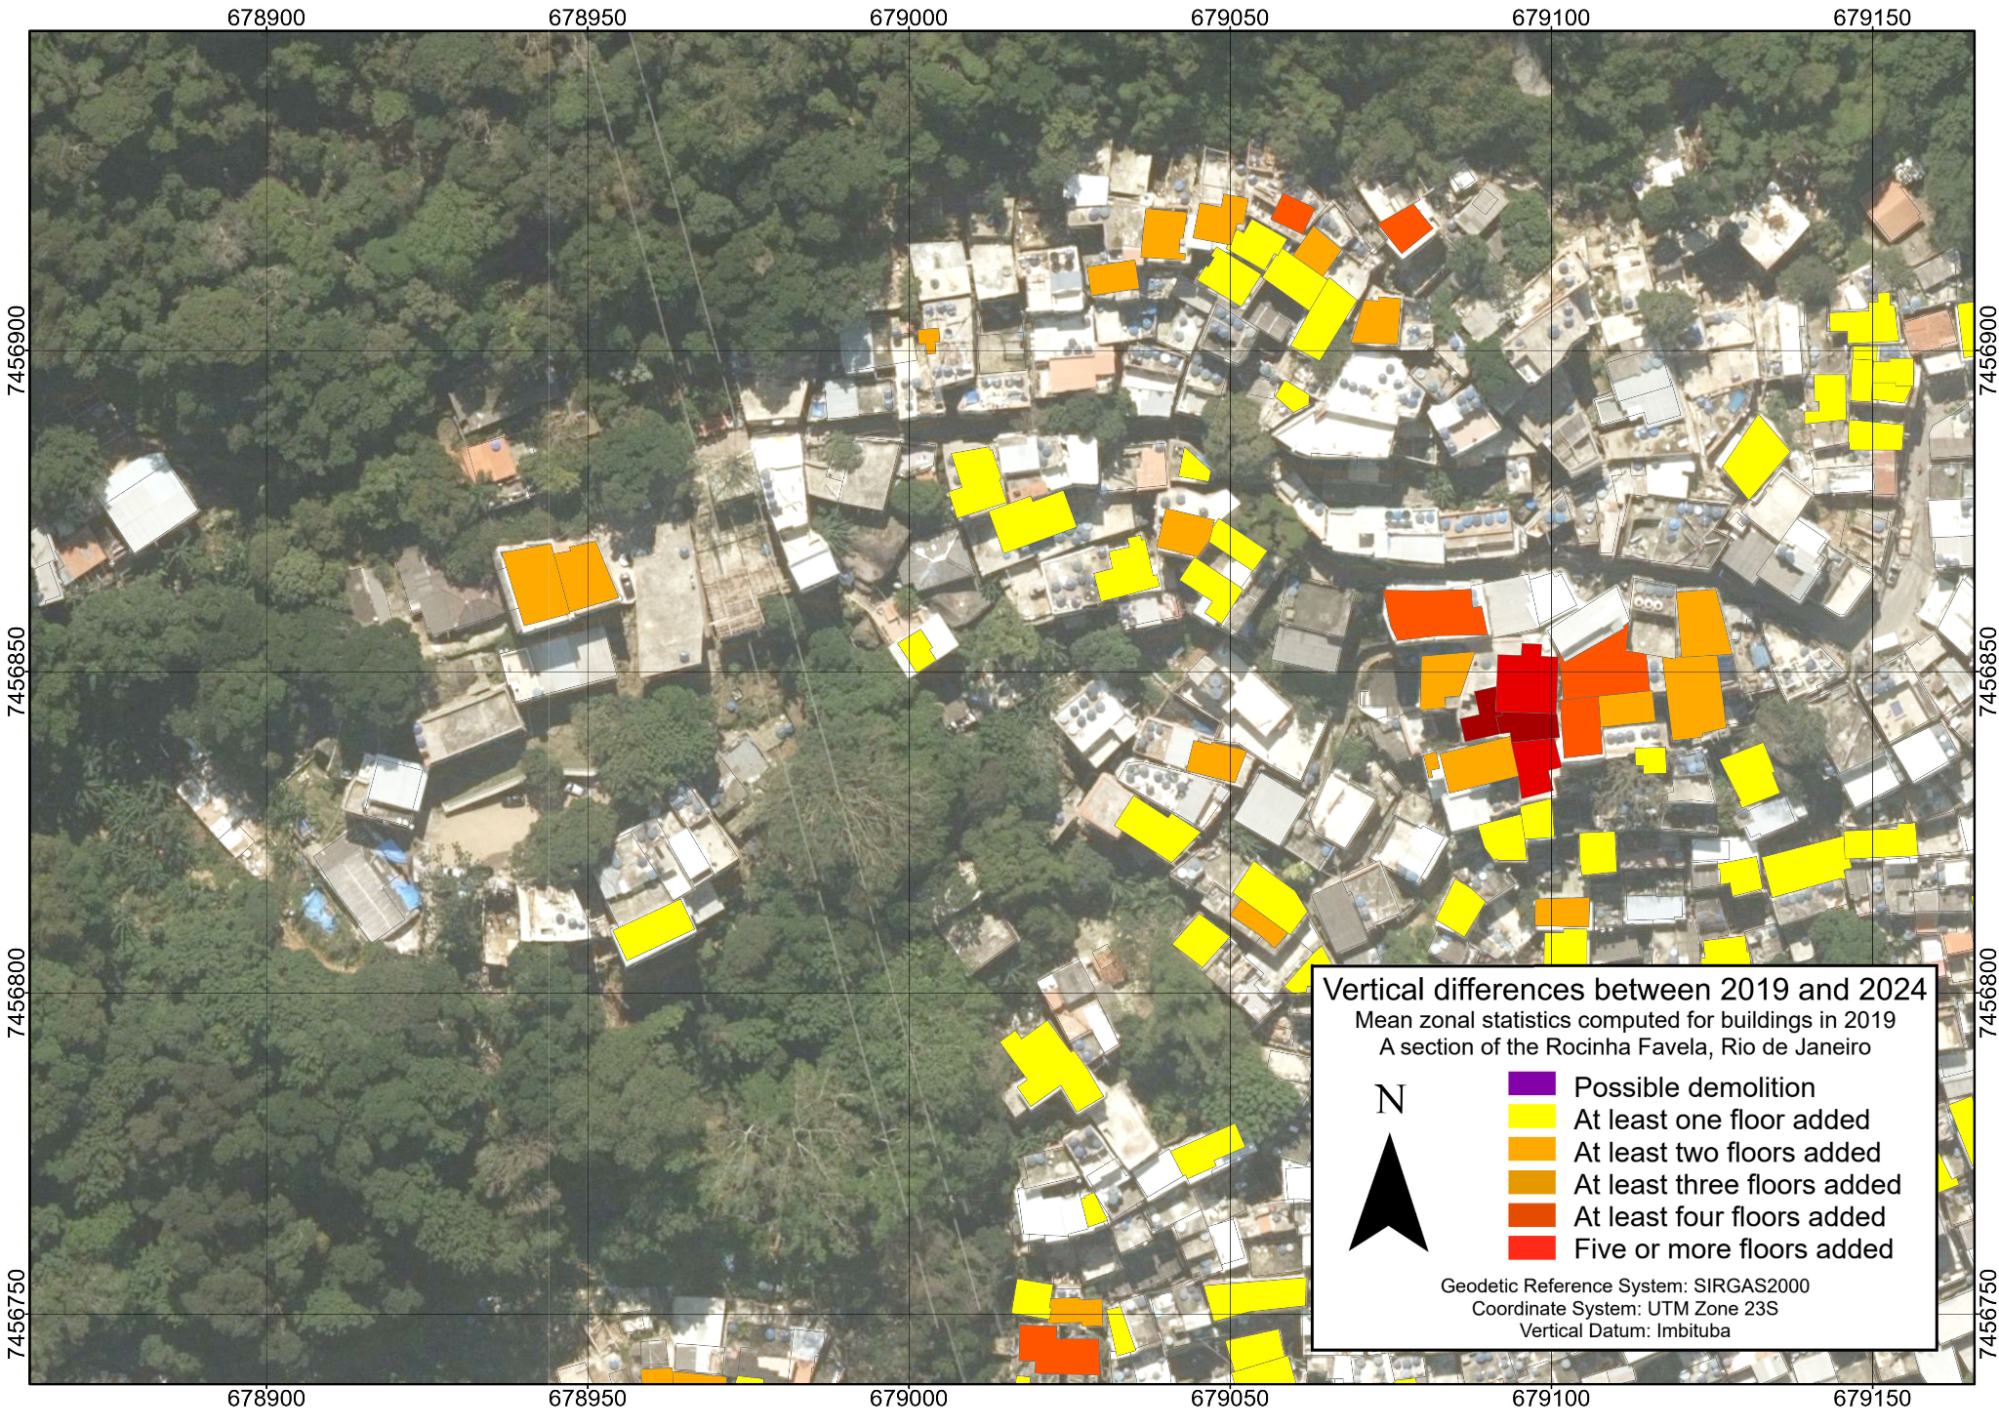
Figure 18: Vector dataset portraying building elevation models subtraction (2019 minus 2013), after zonal statistics applied to the 2019 buildings
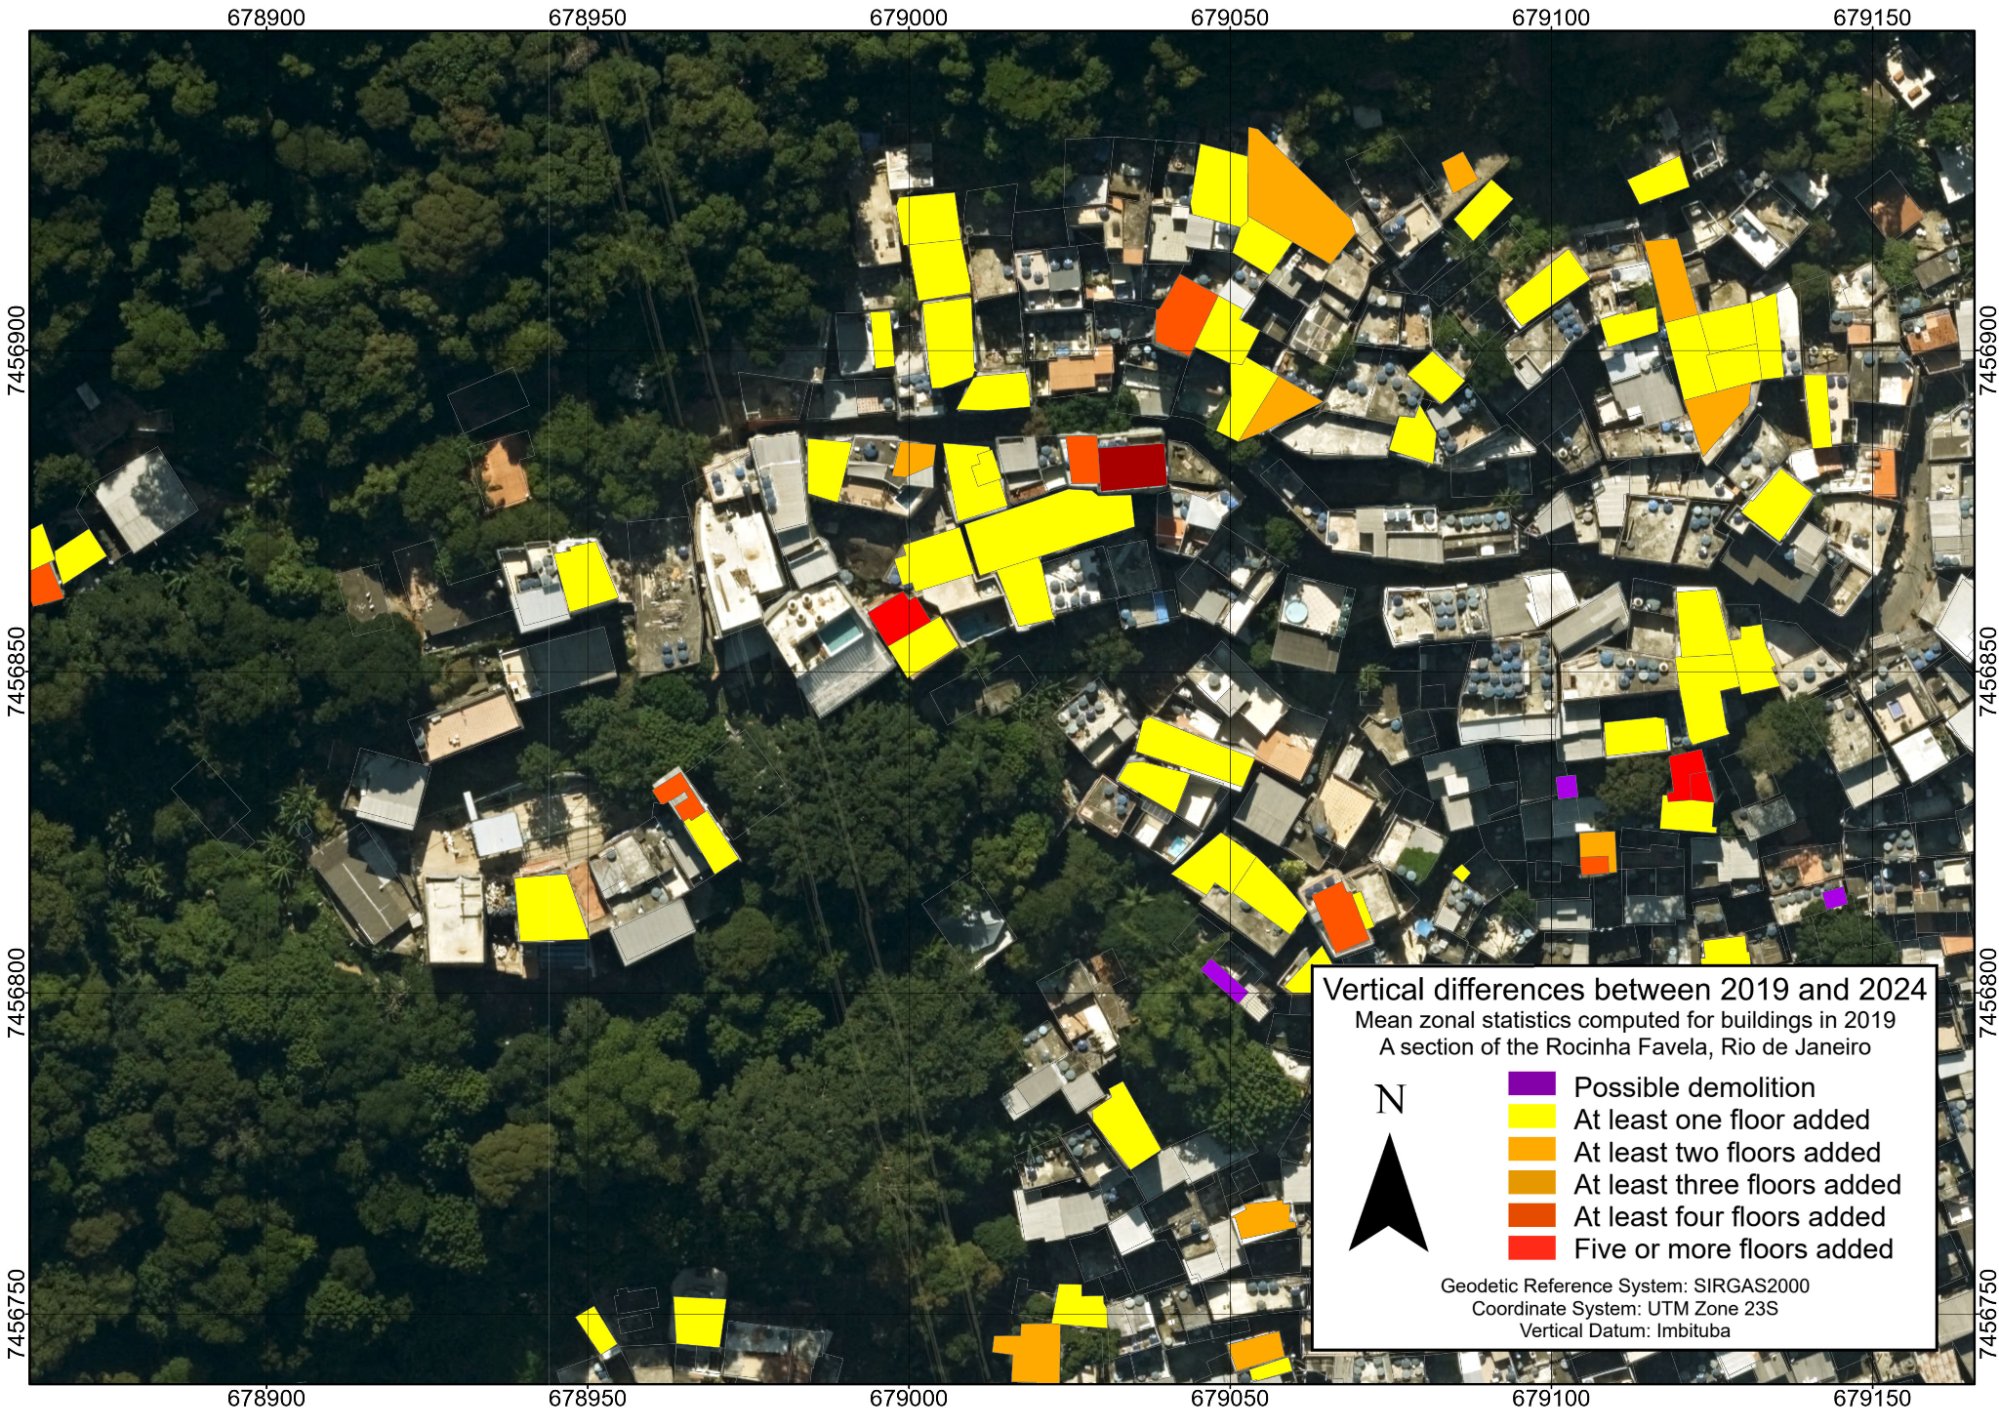
Figure 19: Vector dataset portraying building elevation models subtraction (2024 minus 2019), after zonal statistics applied to the 2019 buildings
3.3 Estimates of city growth and validation of results
Vector datasets provide some tabular functionalities that made it possible to determine estimates of the total volume and area added. By performing zonal statistics and assuming one new floor for every 3 meters of vertical change, Table 1 summarizes the main findings.
Table 1: Summary statistics for vector datasets of vertical differences
Time frame | Added volume (m3) | Added area (m2) | Change in volume (m3) considering demolitions | Change in area(m3) considering demolitions |
2013 to 2019 | 96 530 059 | 7 321 866 | 36 943 262 | 5 159 677 |
2019 to 2024 | 117 076 619 | 8 142 611 | 97 846 086 | 7 634 706 |
It is important to note that these data carry a series of uncertainties. First, the changes in volume and area rely on estimates of added floors based on a standard 3-meter headroom. Second, not all expansions represent new residential units per se; they also include a considerable number of large facilities such as stadiums, shopping centers, train stations, schools, and hospitals, including those specifically built for the 2016 Olympics.
Additionally, since the vector datasets refer to 2013 and 2019, the total built-up area was also calculated. This resulted in 183 186 564 m² of building footprints in 2013 and 199 152 409 m² in 2019 (a statistic that does not take into account the number of floors per building), indicating a modest 7.8% growth in horizontally built-up area over the period.
Despite these difficulties, validation was also possible through some visual comparisons that show how the methodology was able to correctly capture well-known construction sites. Figure 20, for example, shows changes in the Olympic Park area.
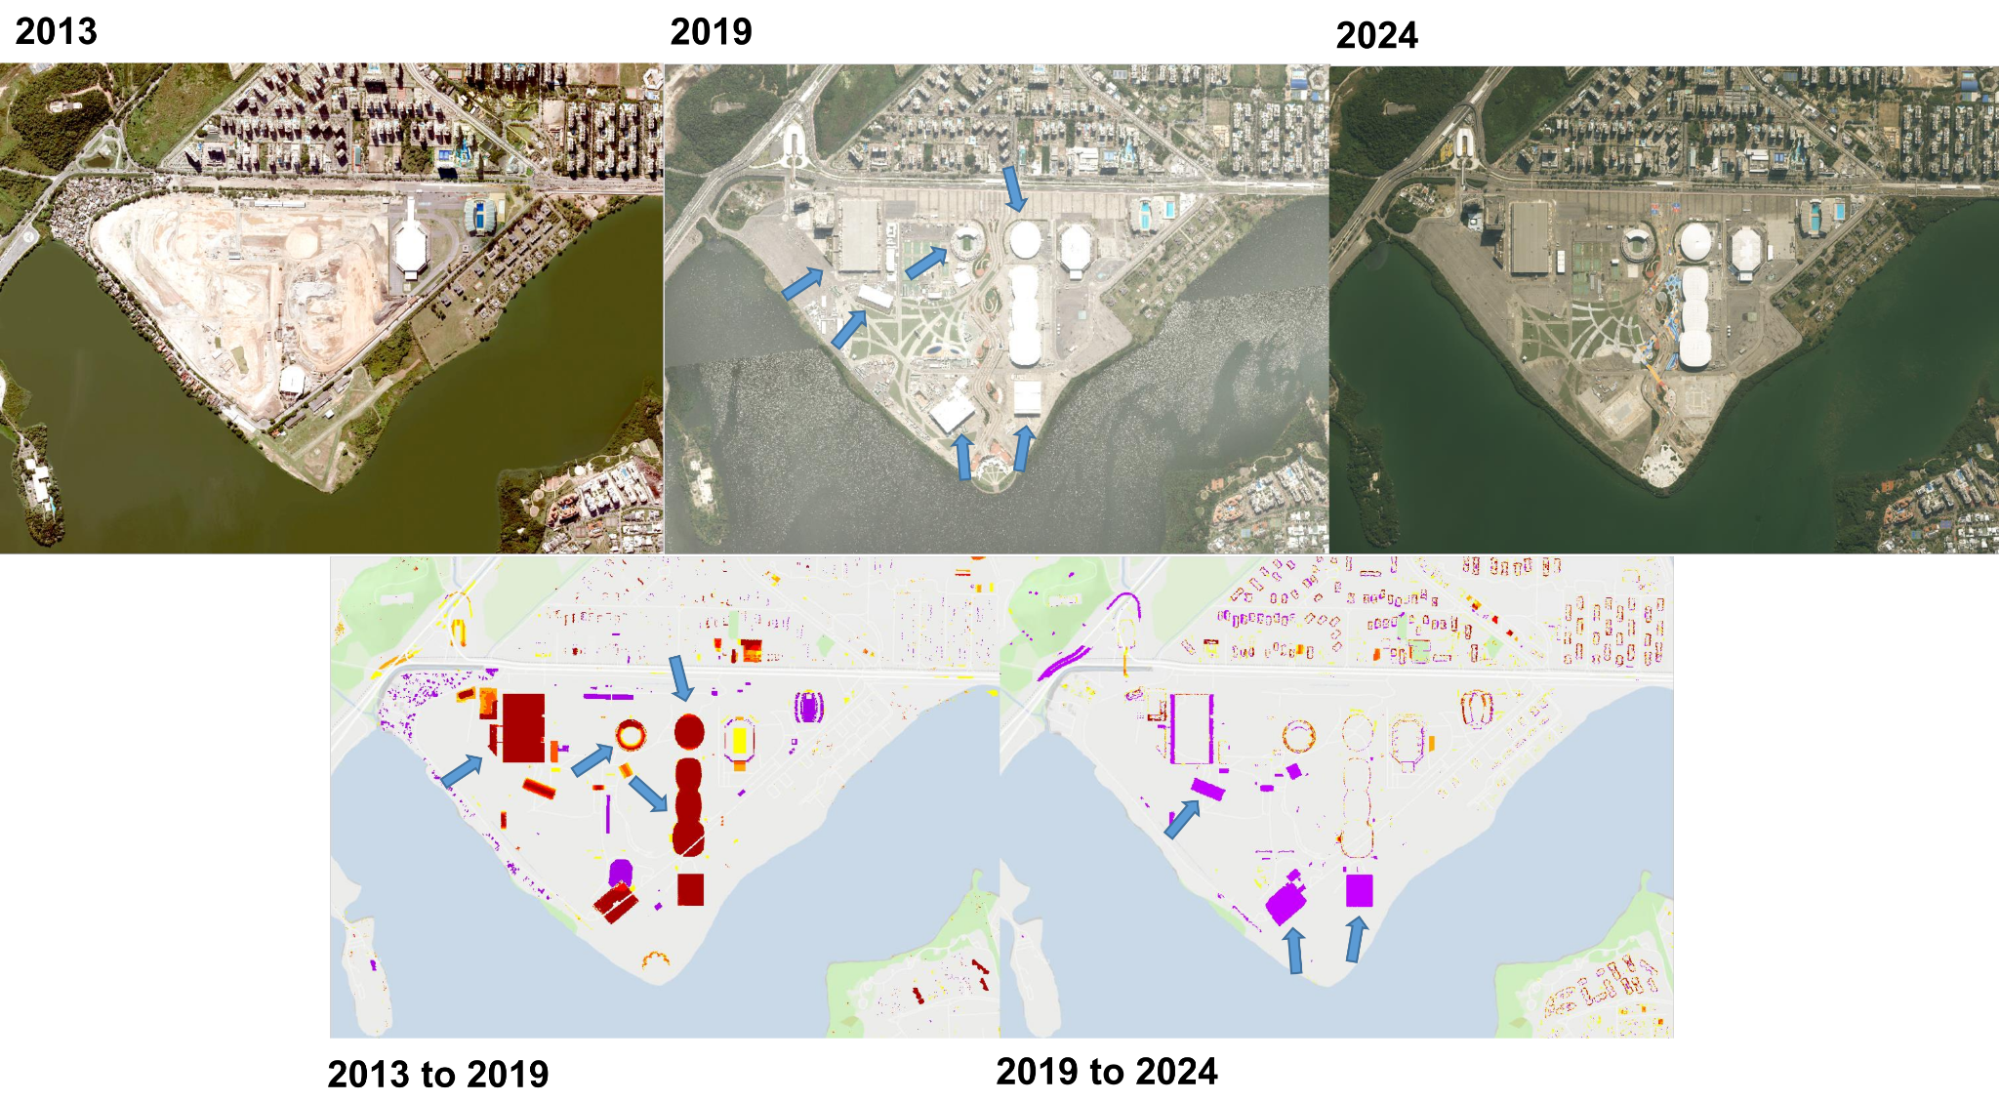
Figure 20: Changes in the Olympic Park area. Visual inspection shows that the methodology was able to capture structures built for the 2016 games and, again, the demolition of some temporary structures between 2019 and 2024. Other features include the forced eviction of Vila Autódromo (NW corner) and construction of new condos in the northern half of the area.
- Discussion
4.1 Methodological limitations
A key methodological distinction lies in the representation of buildings. The 2013 model extrudes building polygons, assigned a single roof elevation, resulting in flat-topped structures without slope variation. In contrast, the higher point density of the 2019 and 2024 LiDAR-derived models captures detailed roof topography (Priestnall; Jaafar; Duncan, 2000). Consequently, subtracting the 2013 model from a later model may yield minor height differences attributable to these roof slope variations, rather than actual structural change.
LiDAR data acquisition relies on direct georeferencing, which uses Real-Time Kinematics (RTK) and Inertial Measurement Units (IMU) to determine the sensor’s exterior orientation parameters. This process provides highly precise positioning for each signal return. However, minor discrepancies in planimetric registration can occur across building edges between different survey campaigns. These slight shifts become particularly evident when performing raster algebra, such as subtracting the 2019 model from the 2024 model. In these difference maps, the misaligned edges of buildings are often misinterpreted as areas of demolition or new construction (Figure 20). Consequently, while accurate, these raster visualizations can be challenging to interpret for users unfamiliar with the artifacts inherent to multi-temporal LiDAR data comparison.
Finally, as previously noted, a critical caveat for the vector-based analysis is its dependence on pre-existing footprints. Since zonal statistics can only be calculated for these polygons, the method fails to register any construction built from scratch. This limits its utility exclusively to understanding changes in the building stock that was already recorded in the base year, also shown in Figure 21.
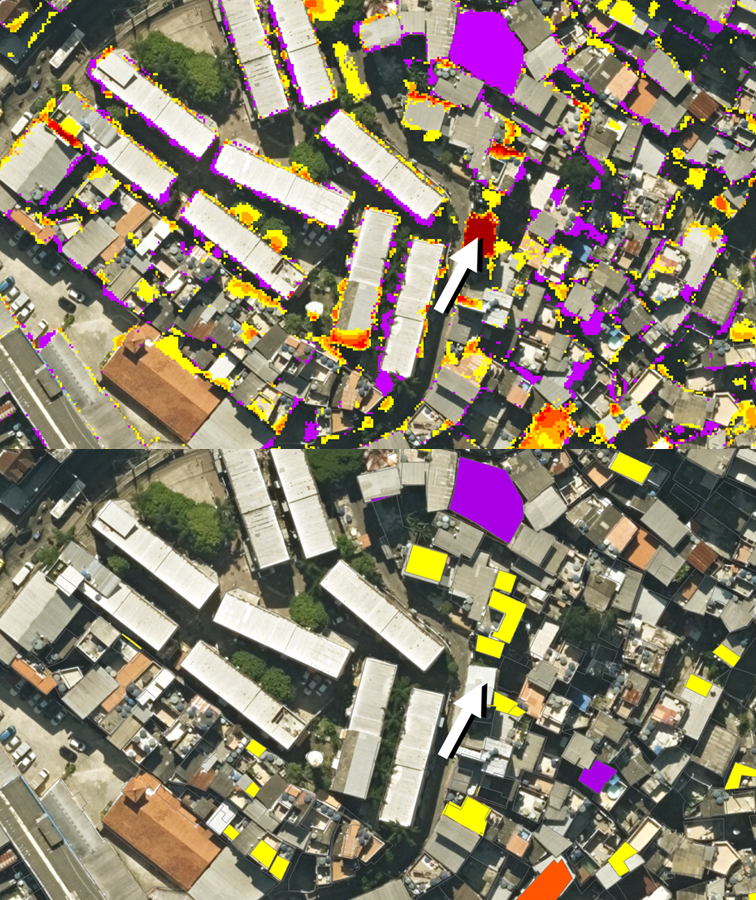 Figure 21: A comparison of change detection results using raster (top) and vector (bottom) data models for the period 2024–2019. The raster output shows edge noise due to minor planimetric shifts between surveys, while the vector output, derived from zonal statistics, omits a new building (see arrow) constructed after 2019.
4.2 Potential uses
The raster data provides a consistent methodology to monitor vertical growth across the entire urban fabric. As shown in Figures 16 and 17, it is effective at detecting informal, incremental construction in favelas. On the other hand, it can also be used to capture large-scale development in formal city districts. This capability allows municipal authorities to move beyond fragmented reporting and maintain a holistic, current understanding of urban development dynamics, which is fundamental for effective infrastructure planning and service provision.
A critical application of this approach is the ability to audit urban development by reconciling approved building permits with actual construction, thereby enhancing regulatory transparency. This is exemplified in the Jardim Botânico area (Figures 22 and 23), where the model captures dynamic market activity. Three specific changes are notable: a major northwestern construction site progressed in phases between 2013 and 2024; a southwestern building was demolished and replaced by recreational facilities (a swimming pool and sports court); and a central-southern property saw a demolition followed by the construction of a high-rise apartment building.
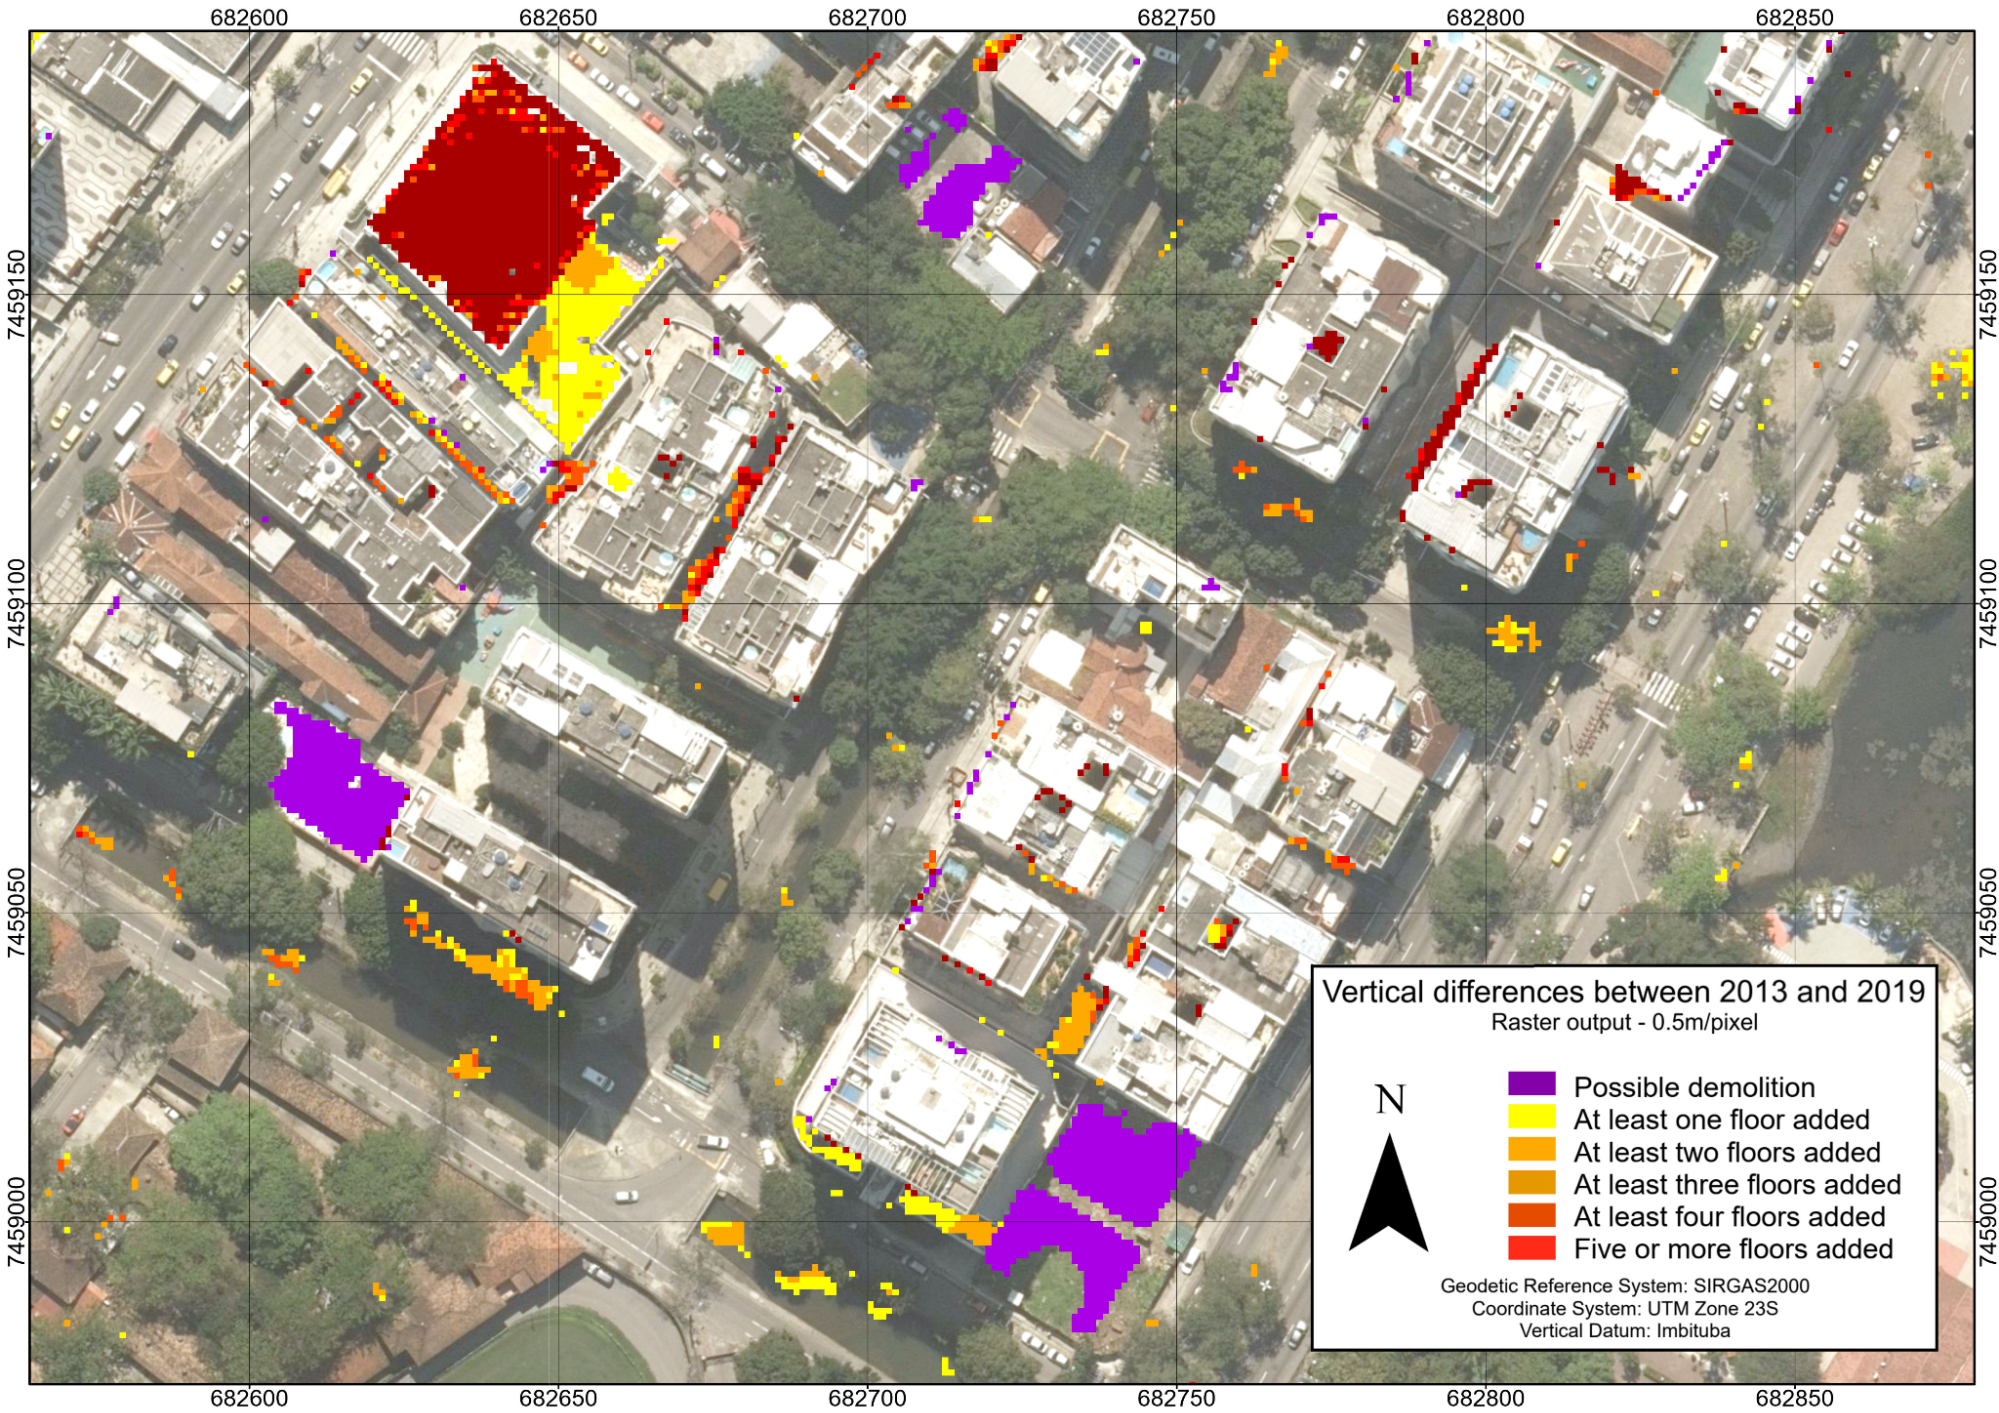
Figure 22: Raster dataset portraying building elevation models subtraction (2019 minus 2013) in the neighborhood of Jardim Botânico
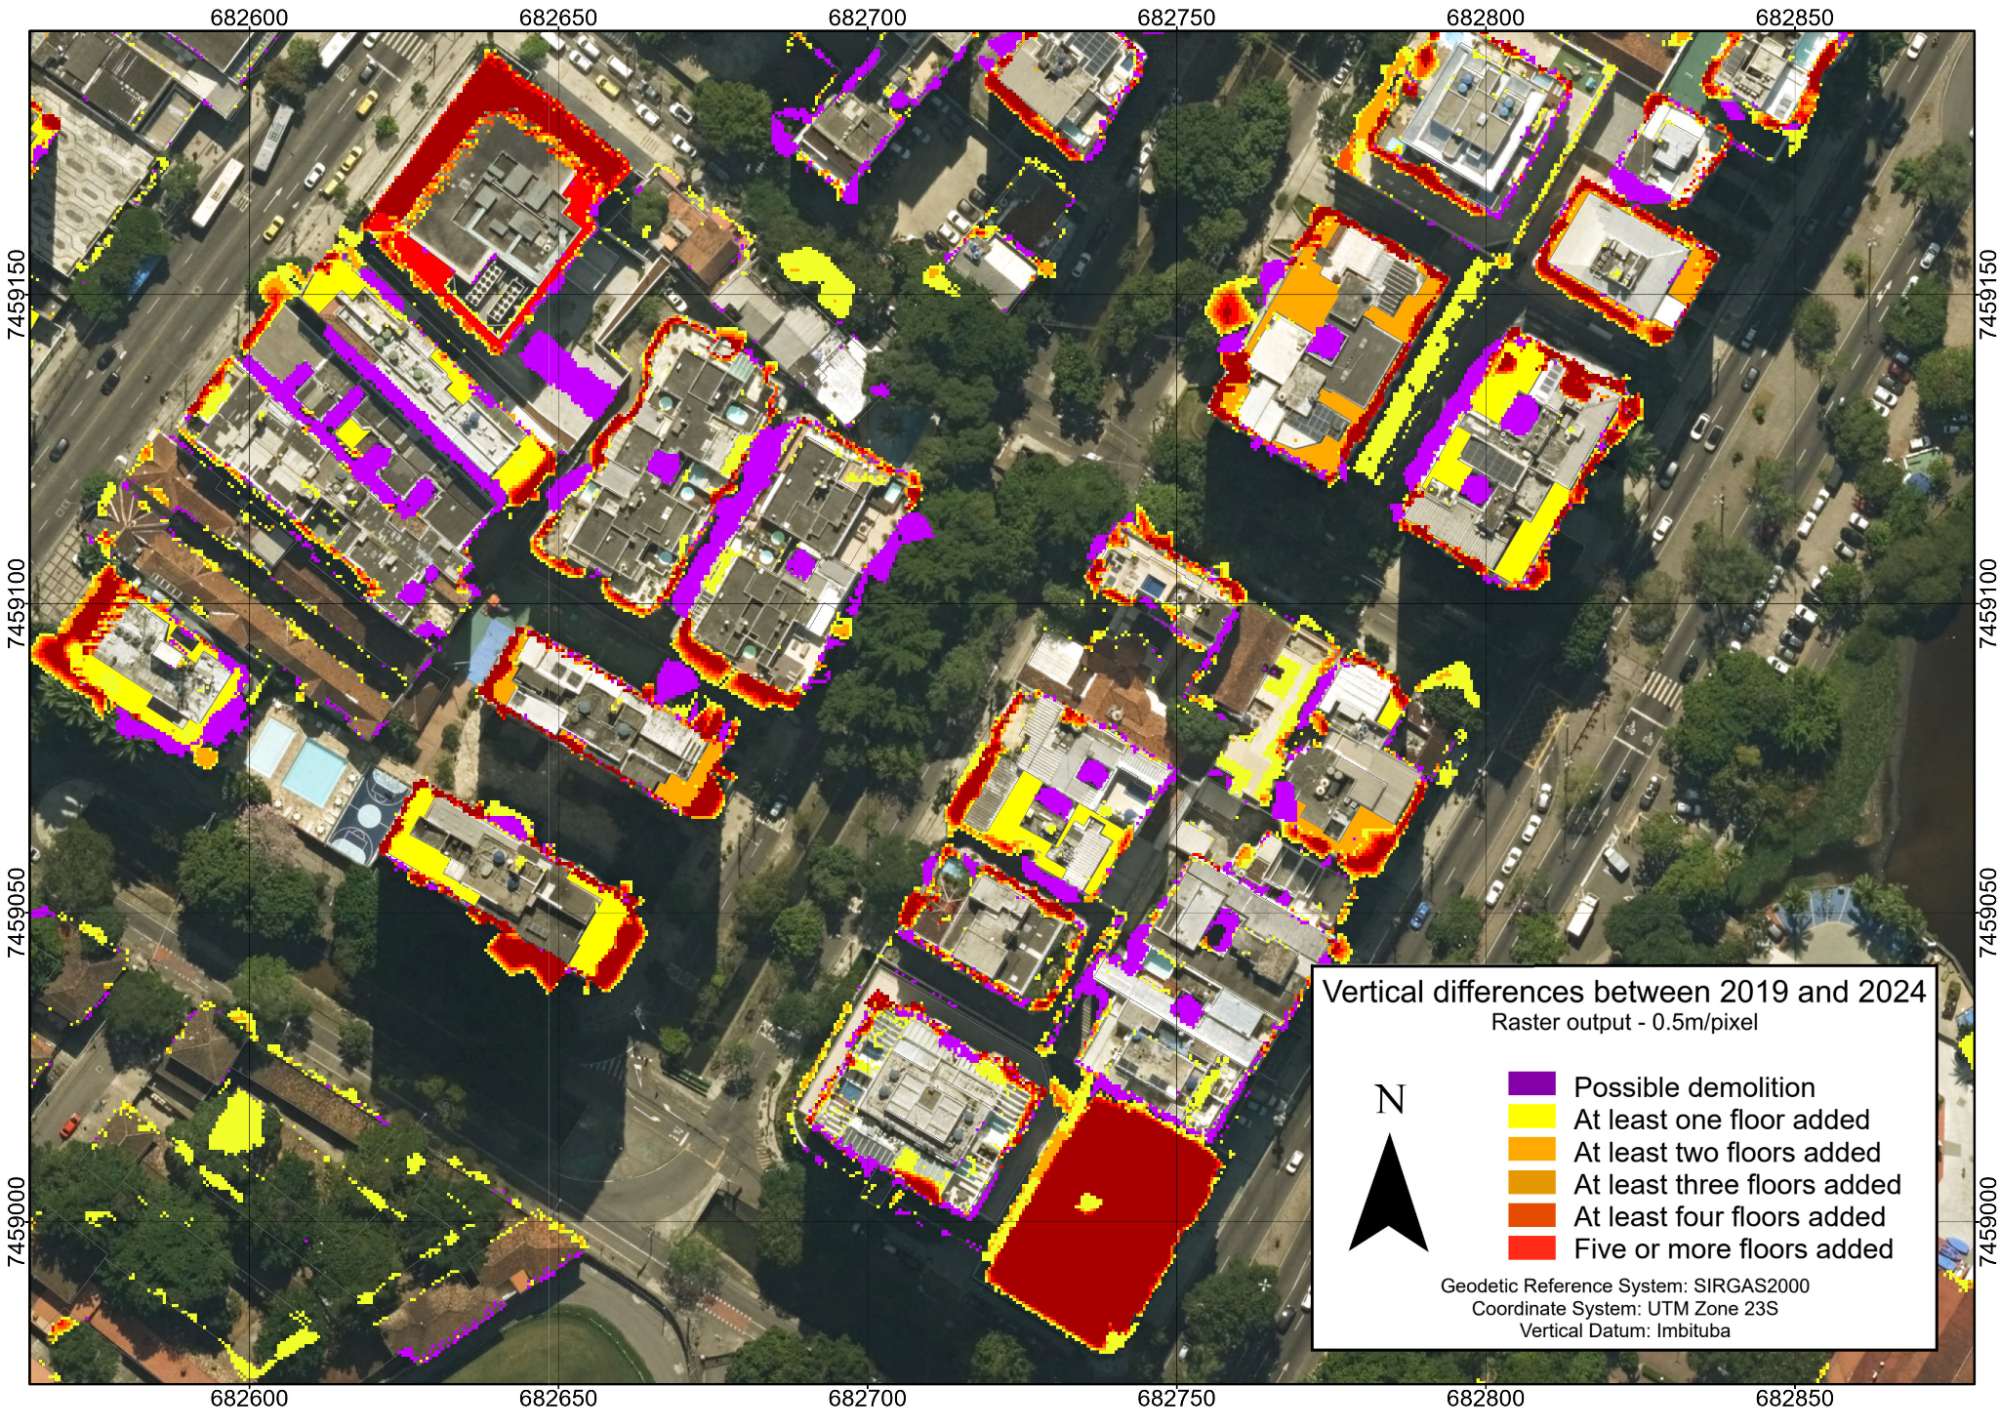
Figure 23: Raster dataset portraying building elevation models subtraction (2024 minus 2019) in the neighborhood of Jardim Botânico
Therefore, by accurately capturing the altitude and footprint of such projects, the model provides an objective tool for verifying compliance with zoning regulations and approved designs, ensuring that private development aligns with public planning goals.
Beyond individual buildings, the vector data can be integrated into Geographic Information Systems (GIS) for spatial statistical analysis. By performing cluster analysis, as depicted in Figure 24, planners can identify hotspots of intense building activity. This reveals patterns of urban transformation driven by real estate market dynamics, enabling targeted policy interventions, such as updating land value maps or guiding infrastructure investments to areas of high growth pressure.
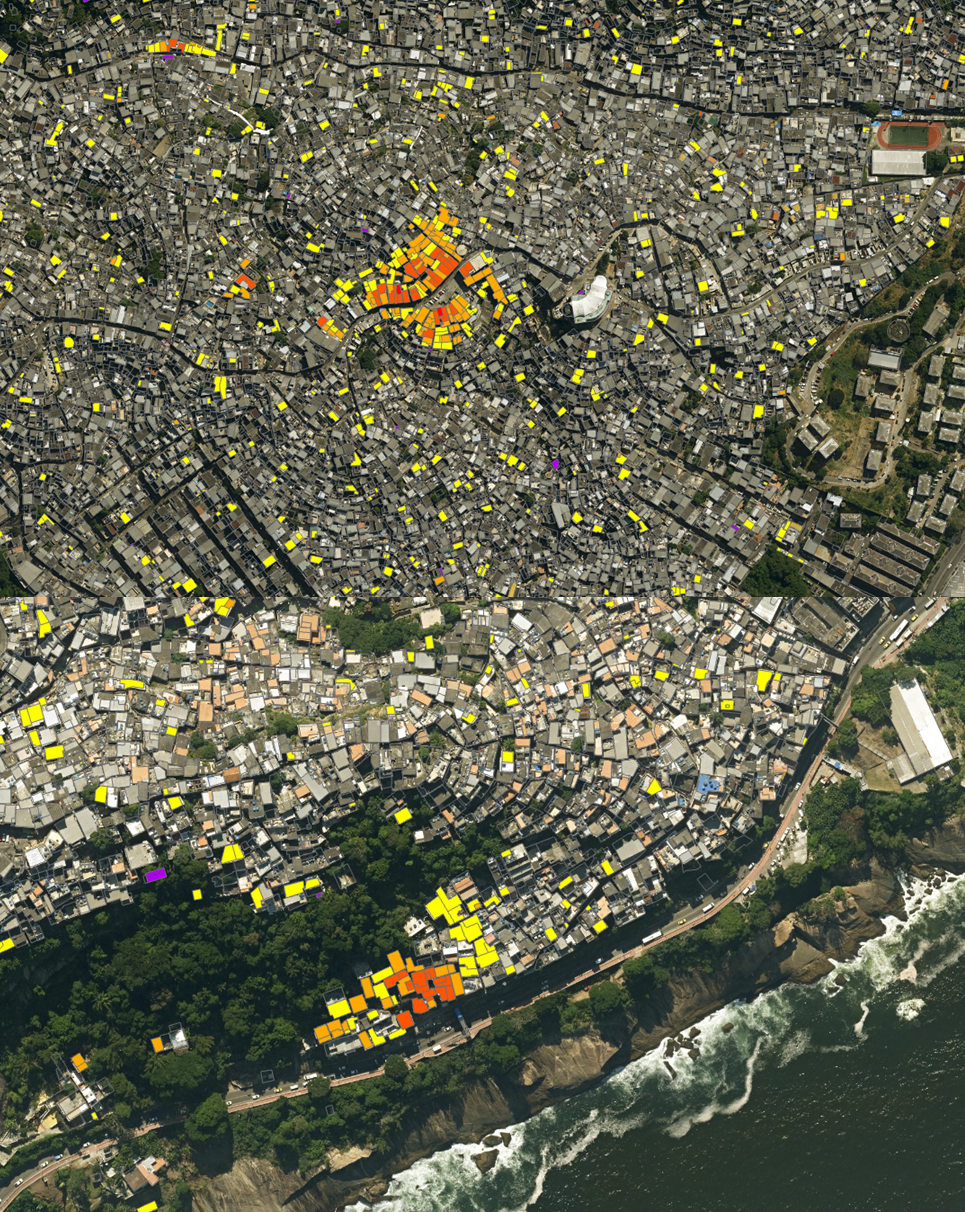 Figure 24: The analysis allows for the identification of hotspots in the real estate dynamics of favelas, as shown in this example from the Complexo do Alemão (above, 2019 minus 2013) and Vidigal (below, 2024 minus 2019)
When processed through zonal statistics, the dataset is transformed into a simplified virtual 3D model, using ArcGIS Pro 3D tools. As illustrated in Figures 25 and 26, this visualization dramatically simplifies the identification of significant height changes. This enhances the model’s utility not only for technical analysis but also for communication, providing an intuitive tool for engaging policymakers, stakeholders, and the public in discussions about urban growth and its impacts. This bridges the gap between complex geospatial data and actionable intelligence.
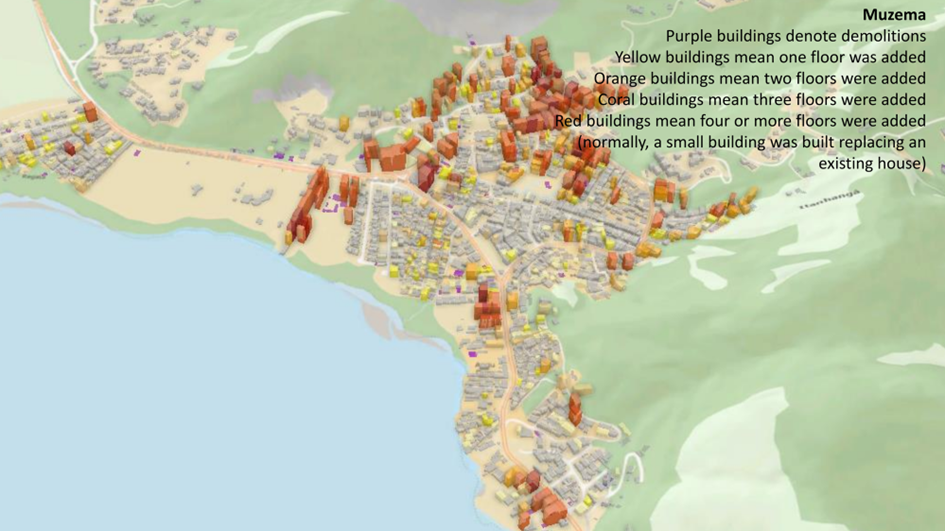 Figure 25: 3D visualization of vertical growth applied to informal settlements in Muzema
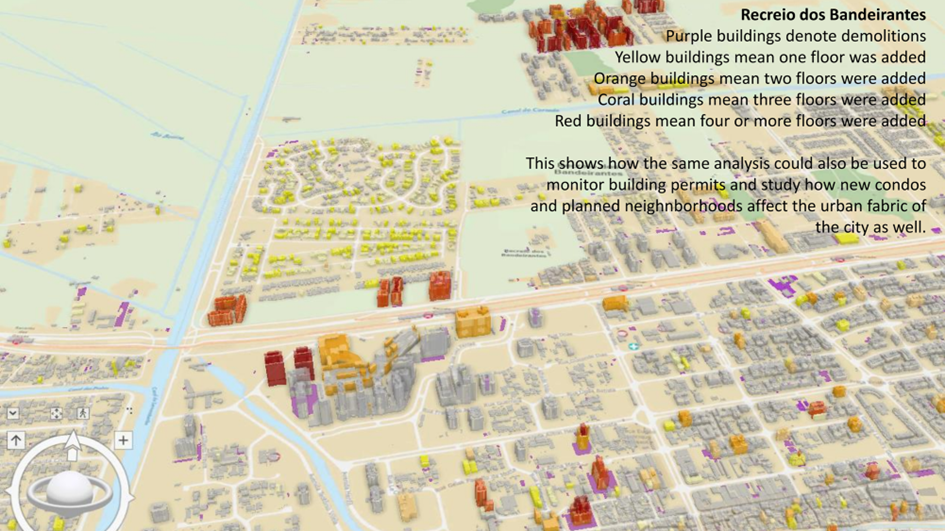 Figure 26: 3D visualization of vertical growth applied to the neighborhood of Recreio dos Bandeirantes
4.3 Other findings
Results show a strong trend of vertical growth in the city of Rio de Janeiro, given the fact the addition in area and volume considerably outpaces the expansion in terms of building footprints. As already discussed in 4.1, it is not advisable to use summary data to infer any specific trends in terms of building activity (such as estimates for new residential units added), due to the many uncertainties involved in the process. Nevertheless, the fact that visual validation has proven consistent with changes in orthoimages shows that general, city-wide estimates may be conducted with the data obtained in this study. And finally, these same data can still be used for monitoring both legal and illegal construction, thus providing a screening tool that could be used in conjunction with other measures (such as consulting permits and localized aerial surveys).
- Conclusion
The city of Rio de Janeiro faces a critical challenge from uncontrolled vertical growth, rooted in its complex formal and informal real estate dynamics. Historically, Rio's mountainous geography has concentrated formal development on the plains, while informal settlements expanded onto slopes and peripheries. As available land has become scarce, a pronounced trend of vertical growth has emerged within favelas, achieved by adding floors to existing structures or through irregular construction. This shift means informal construction now increasingly resembles formal development, but without regulatory oversight, leading to severe risks. Beyond safety, this disorderly growth worsens environmental issues, creating heat islands, increasing pollution, and reducing green space, while overloading infrastructure and deepening urban inequalities.
Effectively managing this phenomenon requires precise measurement tools. For decades, monitoring through systems like SABREN has focused on horizontal expansion, leaving vertical growth largely unmeasured and hindering effective policy. A breakthrough came with advanced geospatial data: the 2019 and 2024 municipal LiDAR surveys generated detailed 3D models of the entire city. By comparing municipal LiDAR surveys from 2019 and 2024, the research transitions from merely describing the phenomenon of verticalization to directly quantifying its extent and rate over time. This capability marks a pivotal shift from reactive monitoring to proactive, evidence-based urban governance.
Nevertheless, the research also has its own limitations. While the raster method provides a consistent city-wide lens for detecting vertical change, it is susceptible to interpretive noise from minor planimetric shifts between surveys. On the other hand, the vector-based approach, which uses zonal statistics on existing footprints, offers precise measurement for known buildings but fails to capture entirely new constructions. Empirically, the data proved highly effective for specific applications, such as auditing formal and informal development and identifying growth hotspots. Furthermore, the conversion of data into simplified 3D visualizations bridges a crucial gap, transforming complex metrics into intuitive tools for communication and policymaking.
The core empirical finding is the confirmation of a dominant city-wide trend of vertical growth, where increases in building volume and rooftop area outperform the expansion of footprints. This suggests verticalization as a key urban dynamic. In that regard, the methodology can be used as screening tool capable of monitoring both legal and illegal construction, for a myriad of planning activities. However, its effectiveness is framed by its limitations: it is a component of a larger monitoring ecosystem, not a standalone solution. The path forward, therefore, lies in integrating this dataset with others, such as permit databases and field surveys.
References
ASPRS. LAS Specifications. [S.l.], 2018. Version 1.4 OGC Community Standard.
BRITO, J. L. N. S. Precision of Digital Orthoimages: Assessment and Application to the Occlusion Detection Problem. 1997. PhD thesis – The Ohio State University.
COELHO, L. C. T.; BRITO, J. L. N. S. Fotogrametria Digital. Rio de Janeiro: Ed. UERJ, 2007. P. 196.
COMISSÃO NACIONAL DE CARTOGRAFIA. Especificação Técnica para a Aquisição de Dados Geoespaciais Vetoriais. Brasília, 2016.
ERBA, D. A.; PIUMETTO, M. A. Para compreender o solo urbano: cadastros multifinalitários para o planejamento e o desenvolvimento das cidades na América Latina. [S.l.]: Lincoln Institute of Land Policy, 2021.
KRAUS, K. Photogrammetry: Fundamentals and Standard Processes. Bonn: Ferd Dümmler Verlag, 1992.
KREILING, A. Photogrammetric Guide. Karlsruhe: Wichmann, 2009.
LERMA GARCÍA, J. L. Fotogrametría Moderna: Analítica Y Digital. Primera. València: Editorial Universitat Politècnica de València, 2002.
LILLESAND, T.; KIEFER, R. W.; CHIPMAN, J. W. Remote Sensing and Image Interpretation. 7th. New York: Wiley, 2015.
MIKHAIL, E. M.; BETHEL, J. S.; MCGLONE, J. C. Introduction to Modern Photogrammetry. [S.l.]: John Wiley & Sons, 2001.
PALME, M.; RAMÍREZ, J. G. A Critical Assessment and Projection of Urban Vertical Growth in Antofagasta, Chile. Sustainability, v. 5, n. 7, p. 2840–2855, 2013.
PRIESTNALL, G.; JAAFAR, J.; DUNCAN, A. Extracting urban features from LiDAR digital surface models. Computers, Environment and Urban Systems, v. 24, n. 2, p. 65–78, 2000.
SASS, G. G.; AMORIM, A. Multipurpose land cadastre and data temporality. Revista Brasileira de Cartografia, v. 66, n. 5, p. 1029–1038, 2014.
TIAN, J.; CUI, S.; REINARTZ, P. Building Change Detection Based on Satellite Stereo Imagery and Digital Surface Models. IEEE Transactions on Geoscience and Remote Sensing, v. 52, n. 1, p. 406–417, 2014.
TOPOCART AEROLEVANTAMENTOS. Relatório de execução de bases cartográficas na escala 1:2000 (área urbana/comunidade de baixa renda) por restituição aerofotogrametrica digital e geração de ortofotos na escala 1/10.000, visando a atualização da base cartográfica. Brasília, Brasil, 2013.
TOPOCART AEROLEVANTAMENTOS. Relatório de mapeamento aerofotogramétrico do município do Rio de Janeiro por mosaico de ortoimagens multiespectrais, ortorretificadas com correção de paralaxe ("true ortho") e geração de modelos digitais de elevações e de terreno por perfilamento a laser (LiDAR). Brasília, Brasil, 2024.
TOPOCART AEROLEVANTAMENTOS. Relatório de mapeamento aerofotogramétrico na escala 1:5000 do município do Rio de Janeiro por mosaicos de ortoimagens digitais coloridas obtidas por plataforma aérea e ortorretificadas de acordo com elevações ("true ortho"); modelo digital de elevações e modelo digital do terreno por perfilamento a laser. Brasília, Brasil, 2019.
WOLF, P. R.; DEWITT, B. A.; WILKINSON, B. E. Elements of Photogrammetry with Applications in GIS. 4th. Boston: McGraw-Hill, 2014.
YUAN, B. et al. Separate and combined effects of 3D building features and urban green space on land surface temperature. Journal of Environmental Management, v. 295, p. 113116, 2021. Accessed: 2023-04-29. DOI: 10.1016/j.jenvman.2021.113116.
About the Authors
Luiz Carlos Teixeira Coelho holds a Bachelor's Degree in Geomatics Engineering (Military Institute of Engineering), a Master of Sciences in Informatics (Federal University of Amazonas) and a PhD in Urban and Regional Planning (Federal University of Rio de Janeiro), with teaching certificates in Mathematics and Geography. He is a civil servant currently working at the Municipal Institute of Urban Planning Pereira Passos (IPP) as researcher, and professor at the Rio de Janeiro State University. He is also an associate of the Urban Engineering Post-Graduate Program of the Federal University of Rio de Janeiro and affiliate researcher of the MIT Senseable City Lab. In this field, his main interests are Digital Image Processing of Remote Sensors, Photogrammetry and Computer Vision, Digital Surface Modeling, Multipurpose Land Cadaster and Geotechnologies for Urban Planning.
Felipe Cerbella Mandarino is the current Coordinator of City Information at the Municipal Institute of Urban Planning Pereira Passos. He holds a Bachelor’s degree in Geography from the Federal University of Rio de Janeiro (2007) and a Professional Certification as an “Urban GHG Inventory Specialist.” He has experience in the field of Geosciences, with an emphasis on Climate Change, Sustainable Urban Development, and Geographic Information Systems, working mainly on the following topics: greenhouse gas (GHG) emissions monitoring systems, climate change vulnerability and adaptation, indicators, spatial analysis, and environmental impacts.
Leandro Gomes Souza holds a Bachelor’s degree in Geography (2008) and a Teaching Degree in Geography (2010) from the Federal University of Rio de Janeiro (UFRJ). He earned a Master’s degree in Urban and Regional Planning from the Institute for Urban and Regional Research and Planning at the Federal University of Rio de Janeiro (UFRJ) in 2014. He is also a specialist in Public Policy and Government Management from IUPERJ/UCAM (2016). Currently, he works at the Municipal Institute of Urban Planning Pereira Passos (IPP) and has been the Cartography Manager since 2016.
Adriana Mendes de Pinho Vial holds a Bachelor’s degree in Architecture and Urban Planning from Fluminense Federal University – UFF (1994). She earned a Master’s degree in Architecture from the Federal University of Rio de Janeiro – PROARQ UFRJ (2001) and an MBE in Economics and Sustainability Management, with an emphasis on Social Interest Housing, from the Federal University of Rio de Janeiro – UFRJ (2016). She currently serves as Manager of Housing and Urban Studies at the Pereira Passos Institute – IPP of the Rio de Janeiro City Government, where she coordinates SABREN – the Low‑Income Settlement System, which contains the registry of favelas in the city of Rio de Janeiro. Her experience in Social Interest Housing and Geoprocessing spans from 1997 to the present at IPP.
Vânia Regina Amorim da Silva holds a Bachelor's degree in Geography from the Federal University of Rio de Janeiro (2006), a specialization course in International Relations at UCAM (2007), and a professional Master's degree in Urban Engineering from UFRJ (2014), with an emphasis on the social components of favela upgrading programs. She has experience in Urban and Regional Planning and geoprocessing: 1- Technical support at the Institute of Urban and Regional Research and Planning (2005-2007); 2- Geographer at the Housing and Urban Studies Management of the Pereira Passos Institute of the City of Rio de Janeiro (2008-2025).
Author Contributions
Conceptualization, [L.C.T.C., F.C.M.]; methodology, [L.C.T.C., F.C.M.]; software [L.C.T.C., F.C.M.]; validation, [L.C.T.C., F.C.M., L.G.S.]; formal analysis, [L.C.T.C., F.C.M., L.G.S.]; investigation, [L.G.S., A.M.P.V., V.R.A.S.]; resources, [L.G.S., A.M.P.V., V.R.A.S.]; data curation, [L.G.S.]; writing—original draft preparation, [L.C.T.C.]; writing—review and editing [F.C.M., L.G.S., A.M.P.V., V.R.A.S.]; visualisation, [L.C.T.C.]; supervision, [F.C.M.]; project administration, [L.C.T.C.]; funding acquisition, [F.C.M.]. All authors have read and agreed to the published version of the manuscript.
Funding
The data for this research were obtained through a grant from the Inter-American Development Bank for the PROAP III (Urbanization of Favelas and Informal Settlements).
Data Availability
Data for this research may be available upon request.
Conflicts of Interest
The authors declare no conflicts of interest.
About Coleção Estudos Cariocas
Coleção Estudos Cariocas (ISSN 1984-7203) is a publication dedicated to studies and research on the Municipality of Rio de Janeiro, affiliated with the Pereira Passos Institute (IPP) of the Rio de Janeiro City Hall.
Its objective is to disseminate technical and scientific production on topics related to the city of Rio de Janeiro, as well as its metropolitan connections and its role in regional, national, and international contexts. The collection is open to all researchers (whether municipal employees or not) and covers a wide range of fields — provided they partially or fully address the spatial scope of the city of Rio de Janeiro.
Articles must also align with the Institute’s objectives, which are:
- to promote and coordinate public intervention in the city’s urban space;
- to provide and integrate the activities of the city’s geographic, cartographic, monographic, and statistical information systems;
- to support the establishment of basic guidelines for the city’s socioeconomic development.
Special emphasis will be given to the articulation of the articles with the city's economic development proposal. Thus, it is expected that the multidisciplinary articles submitted to the journal will address the urban development needs of Rio de Janeiro.