
Volume 13 Issue 4 *Corresponding author jedielso.souza@ibge.gov.br Submitted 15 Nov 2025 Accepted 13 Jan 2026 Published 05 Feb 2026 Citation SOUZA, J. S.; SILVA, A. D.; NUNES, I. M. Detection of Rio de Janeiro favelas in orthoimages using deep learning with the U-Net architecture. Coleção Estudos Cariocas, v. 13, n. 4, 2026.
DOI 10.71256/19847203.13.4.195.2025. The article was originally submitted in PORTUGUESE. Translations into other languages were reviewed and validated by the authors and the editorial team. Nevertheless, for the most accurate representation of the subject matter, readers are encouraged to consult the article in its original language.


| Detection of Rio de Janeiro favelas in orthoimages using deep learning with the U-Net architecture Detecção de favelas cariocas em ortoimagens utilizando deep learning com arquitetura U-Net Detección de favelas de Río de Janeiro en ortoimágenes utilizando deep learning con la arquitectura U-Net Jedielso Sales de Souza1, Andrea Diniz da Silva2 and Ian Monteiro Nunes3 1 Instituto Brasileiro de Geografia e Estatística, Superintendência Estadual do Rio de Janeiro, Av. Beira Mar, 436 - Centro, Rio de Janeiro/RJ, CEP 20021-060, ORCID: 0009-0009-6053-7065, jedielso.souza@ibge.gov.br 2 Instituto Brasileiro de Geografia e Estatística, Escola Nacional de Ciências Estatísticas, Rua André Cavalcanti, 106 - Santa Teresa, Rio de Janeiro/RJ, CEP 20231-050, ORCID: 0000-0001-9116-0162, andrea.diniz@ibge.gov.br 3 Instituto Brasileiro de Geografia e Estatística, Diretoria de Pesquisas, Rua Pacheco Leão, 1235 - Jardim Botânico, Rio de Janeiro/RJ, CEP 22460-905, ORCID: 0000-0003-3445-4169, ian.nunes@ibge.gov.br
AbstractThis study evaluated the performance of the U-Net architecture for identifying informal settlements in high-resolution orthoimagery, using manually annotated masks as reference. Models trained with and without data augmentation were compared. The model with data augmentation achieved better performance in terms of IoU, F1-Score, and Precision, while the model without augmentation obtained higher Recall, highlighting the trade-off between sensitivity and false-positive control. Despite challenges related to small areas and low visual contrast, the results confirm the potential of U-Net for mapping informal settlements. Keywords: favela, orthoimage, deep learning, urban planning, geotechnologies ResumoEste estudo avaliou o desempenho da arquitetura U-Net na identificação de favelas em ortoimagens de alta resolução, utilizando máscaras manuais como referência. Foram comparados modelos treinados com e sem data augmentation. O modelo com data augmentation apresentou melhor desempenho em IoU, F1-Score e Precisão, enquanto o modelo sem augmentation obteve maior Revocação, evidenciando o trade-off entre sensibilidade e controle de falsos positivos. Apesar das dificuldades em áreas pequenas e de baixo contraste visual, os resultados confirmam o potencial da U-Net para o mapeamento de assentamentos precários. Palavras-chave: favela, ortoimagem, deep learning, planejamento urbano, geotecnologias ResumenEste estudio evaluó el desempeño de la arquitectura U-Net en la identificación de asentamientos informales en ortoimágenes de alta resolución, utilizando máscaras anotadas manualmente como referencia. Se compararon modelos entrenados con y sin data augmentation. El modelo con aumento de datos presentó un mejor desempeño en términos de IoU, F1-Score y Precisión, mientras que el modelo sin augmentation obtuvo una mayor Revocación, evidenciando el trade-off entre sensibilidad y control de falsos positivos. A pesar de las dificultades asociadas a áreas pequeñas y de bajo contraste visual, los resultados confirman el potencial de la U-Net para el mapeo de asentamientos informales. Palabras clave: favela, ortoimagen, deep learning, planificación urbana, geotecnologías |
Introduction
Accelerated and often disorderly urban growth poses increasing challenges to city management, compromising sustainable development. According to the World Cities Report (UN BRASIL, 2022), the global urban population is expected to increase from 56% in 2021 to 68% by 2050.
In Brazil, urbanization has historically been associated with the expansion of precarious settlements, a result of the absence of effective public policies and the lack of access to adequate housing and infrastructure. In Rio de Janeiro, the process of removing tenement housing (cortiços) in the late 19th century led families to occupy hills and peripheral areas, giving rise to the first favelas (Ling, 2018; Marins, 1998).
Given the global scale of urbanization, the UN's 2030 Agenda established the 17 Sustainable Development Goals (SDGs), among which SDG 11 – Sustainable Cities and Communities aims to "make cities and human settlements inclusive, safe, resilient and sustainable," envisioning the improvement and urbanization of slums by 2030 (UN BRASIL, 2023). One of the main challenges in achieving this goal is the identification and continuous monitoring of precarious settlements, which is essential for urban planning and the formulation of public policies.
Traditionally, this information is obtained from demographic censuses, conducted every ten years, which limits the tracking of transformations in the intercensal period. In this context, the use of satellite imagery and artificial intelligence techniques emerges as a promising alternative, allowing for the identification, mapping, and monitoring of favelas in a more agile and precise manner.
Remote sensing has been widely used for identifying and monitoring informal settlements, leveraging satellite images of different spatial and temporal resolutions in diverse urban contexts. Studies demonstrate that spectral, textural, geometric, and morphological characteristics extracted from these images allow for the distinction between formal and informal areas, especially when combined with digital image processing and machine learning techniques (Kemper et al., 2015; Alrasheedi et al., 2021; Cinnamon; Noth, 2023).
Traditional approaches, such as object-based analysis and classical machine learning algorithms, yield good results, but they require manual feature extraction and selection, as well as specific adjustments for each urban context (Ghaffarian; Emtehani, 2021; Oliveira et al., 2023). In recent years, methods based on deep learning, especially convolutional neural networks and semantic segmentation models, have become established as the state of the art in satellite image analysis, demonstrating a greater capacity to capture the morphological complexity and spatial heterogeneity characteristic of favelas (Wurm et al., 2019; Maiya; Babu, 2018; Lu et al., 2021; Abascal et al., 2022). These approaches expand the potential for continuous mapping and monitoring of informal settlements, providing more accurate inputs for urban planning and public policy formulation.
The present work seeks to contribute to this effort by applying deep learning models to satellite images for identifying and monitoring the dynamics of favelas in the city of Rio de Janeiro.
Materials and Methods
- Identification and Delimitation of Areas of Interest
The study used RGBI orthoimages with a spatial resolution of 15 cm (Ground Sample Distance - GSD), acquired during a photogrammetric flight in April 2024 by the UltraCam Osprey 4.1 aerophotogrammetric camera. The data were provided by the Municipal Institute of Urbanism Pereira Passos (IPP), an agency of the City of Rio de Janeiro's Municipal Government. The orthoimages are composed of the red (Red), green (Green), blue (Blue), and near-infrared (Near Infrared - NIR) spectral bands.
The images are in the EPSG:31983 coordinate reference system, which corresponds to the SIRGAS 2000 geodetic system associated with the Universal Transverse Mercator (UTM) cartographic projection, zone 23 South (central meridian 45°W). This reference system is suitable for the study area, as the municipality of Rio de Janeiro is located near the zone's secant meridian, which contributes to minimizing linear and areal distortions in spatial analyses.
For this study, only the visible spectrum bands (RGB) were used. Considering the high computational cost associated with processing images of large territorial extent, a spatial grid composed of 512 × 512 meter squares, bounded by the area of the municipality of Rio de Janeiro, was created.
To reduce the spatial resolution of the images, originally 15 cm, pixel resampling was performed using the bilinear method, resulting in a resolution of 50 cm. This new resolution preserves an adequate capacity for identifying urban components while significantly reducing the computational cost of processing.
Squares located on uninhabited islands were discarded, while those situated on the municipal border were retained only when at least one-third of their area was within the municipality's limits.
At the end of this process, the resulting grid went from 5,002 to 4,647 squares. These squares were then used to clip the image of the municipality of Rio de Janeiro (with a spatial resolution of 1 m), generating multiple smaller images that are therefore more viable for computational analysis.
The city of Rio de Janeiro, as defined in its Plano Diretor de Desenvolvimento Urbano Sustentável (PDUS - Master Plan for Sustainable Urban Development), is subdivided into different territorial units intended for urban development planning and control. Among these units are the Áreas de Planejamento (APs - Planning Areas), five areas defined based on criteria of environmental compartmentalization, historical characteristics, and patterns of land use and occupation (Rio de Janeiro, 2025):
- Planning Area 1 (AP1) – corresponds to the central region of the city;
- Planning Area 2 (AP2) – covers the Zona Sul (South Zone) and Grande Tijuca;
- Planning Area 3 (AP3) – comprises the Zona Norte (North Zone), with the exception of Grande Tijuca and the Administrative Region VII (São Cristóvão);
- Planning Area 4 (AP4) – corresponds to the Sudoeste (Southwest) Region, created more recently;
- Planning Area 5 (AP5) – encompasses the neighborhoods of the Zona Oeste (West Zone).
To ensure comprehensive territorial representativeness, it was decided to use the Planning Areas officially defined by the Municipal Government. This decision considers that the physical and socioeconomic differences of the population directly influence the configuration and characteristics of the urban space.
Thus, each square in the grid was associated with a Planning Area (AP) of the municipality (Figure 1), according to the official division made available by the DATA.RIO platform (2023). In cases where a square overlapped two or more APs, specific attribution criteria were established, ensuring the consistency of the territorial classification:
- Squares containing regions classified as favelas by the IBGE or the Rio de Janeiro Municipal Government were assigned to the AP that encompassed this classified area;
- Squares without favela areas, or containing favela areas in more than one AP, were designated to the AP that had the largest territorial extent within the square.
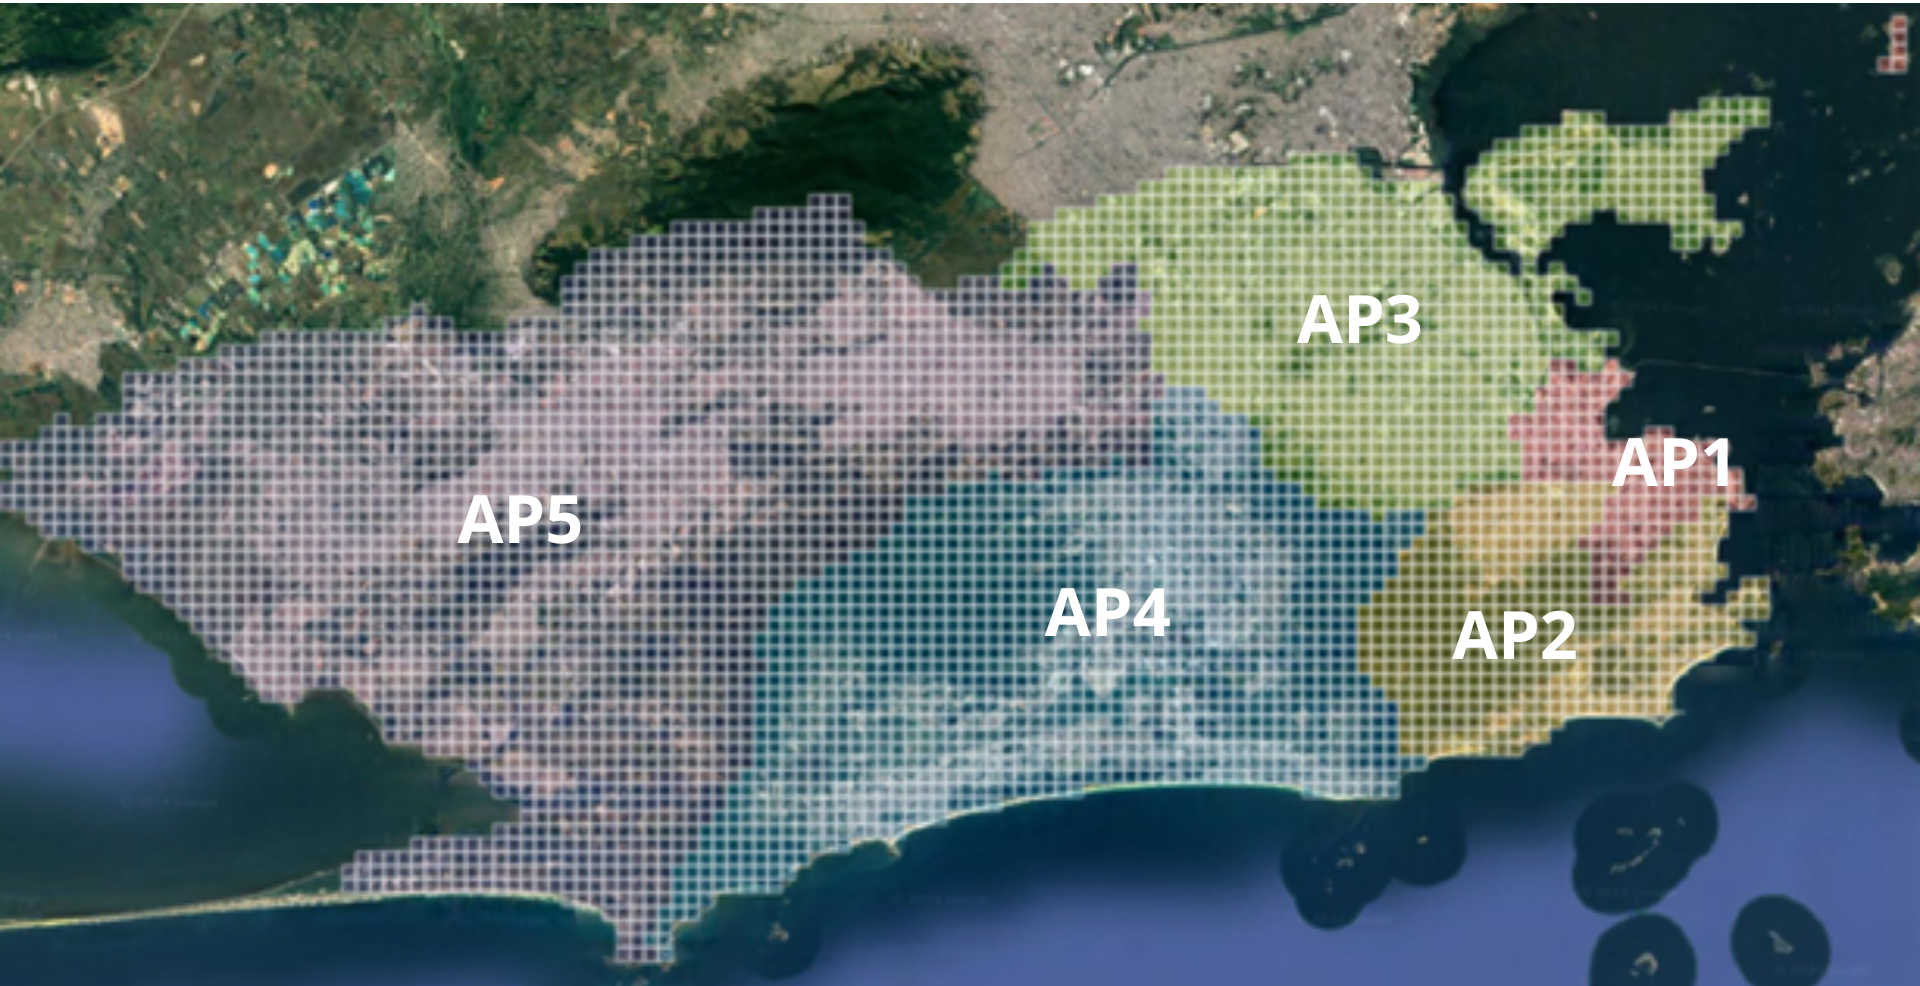 Figure 1: Grid of 512 m² squares applied over the image of the city of Rio de Janeiro. The grid was used to segment the urban area into smaller, standardized sections, facilitating the processing of satellite images. Distributed across the Planning Areas of the Rio de Janeiro Municipal Government.
Source: Own elaboration
The identification of grid squares containing the areas of interest was based on vector spatial data in shapefile format. This data corresponds to the 2022 Census tract mesh, made available by the IBGE, initially classified as Aglomerados Subnormais (AGSN - Subnormal Agglomerates), a designation later updated to Favelas e Comunidades Urbanas (FCU - Favelas and Urban Communities).
The change in nomenclature reflects a process of conceptual revision conducted by the IBGE, in dialogue with social movements, the academic community, and other government agencies. This update seeks to adopt a more adequate and respectful terminology, replacing the expression "Aglomerados Subnormais," which had come to be considered inadequate as it reinforces social stigmas. However, it is important to note that the change was only terminological, with no changes to the technical criteria used to identify and map these areas (IBGE, 2024).
Additionally, data from the Municipal Institute of Urbanism Pereira Passos (IPP) were incorporated. These data, made available on the DATA.RIO portal (2019), delimit the areas officially recognized as favelas.
For the IBGE, the characterization of a subnormal agglomerate occurs when there is irregular land occupation, associated with at least one of the following conditions (IBGE, 2020):
- Precariousness of essential public services, such as water supply, electricity supply, garbage collection, or sanitation;
- Irregular urban pattern, reflected in the presence of narrow circulation routes, irregular alignment, lots of unequal sizes and shapes, absence of sidewalks, or constructions not regularized by public agencies;
- Restriction on land occupation, when households are located in areas protected by environmental legislation, highway or railway right-of-way strips, contaminated areas, among other situations of inadequate urban land use.
Furthermore, after identifying and delimiting the areas, the IBGE associates the subnormal agglomerates with the operational units of the Demographic Census, called census tracts. Each tract must comprise contiguous areas with at least 51 households, respecting political-administrative boundaries and ensuring the territorial and operational coherence of census data collection (IBGE, 2020).
In turn, the IPP — an agency linked to the Rio de Janeiro Municipal Government — uses the term favela with a socio-spatial and administrative focus, seeking to recognize and map territories consolidated within the urban fabric. The definition adopted by the IPP takes into account a broader set of characteristics, which include both physical and social and cadastral aspects. According to the Institute, an area is considered a favela when it presents (Rio de Janeiro, 2012):
- Irregular land occupation;
- Absence of formal property titles (which does not imply illegality of the occupation);
- Urban fabric arranged irregularly;
- Small and undefined lots;
- Narrow streets;
- Precarious sanitation infrastructure;
- Non-existent or insufficient social facilities;
- Precarious housing and non-compliance with urban norms;
- Absence of special urban norms applicable to the area;
- Non-inclusion of properties in municipal real estate cadasters;
- Predominance of a low-income population.
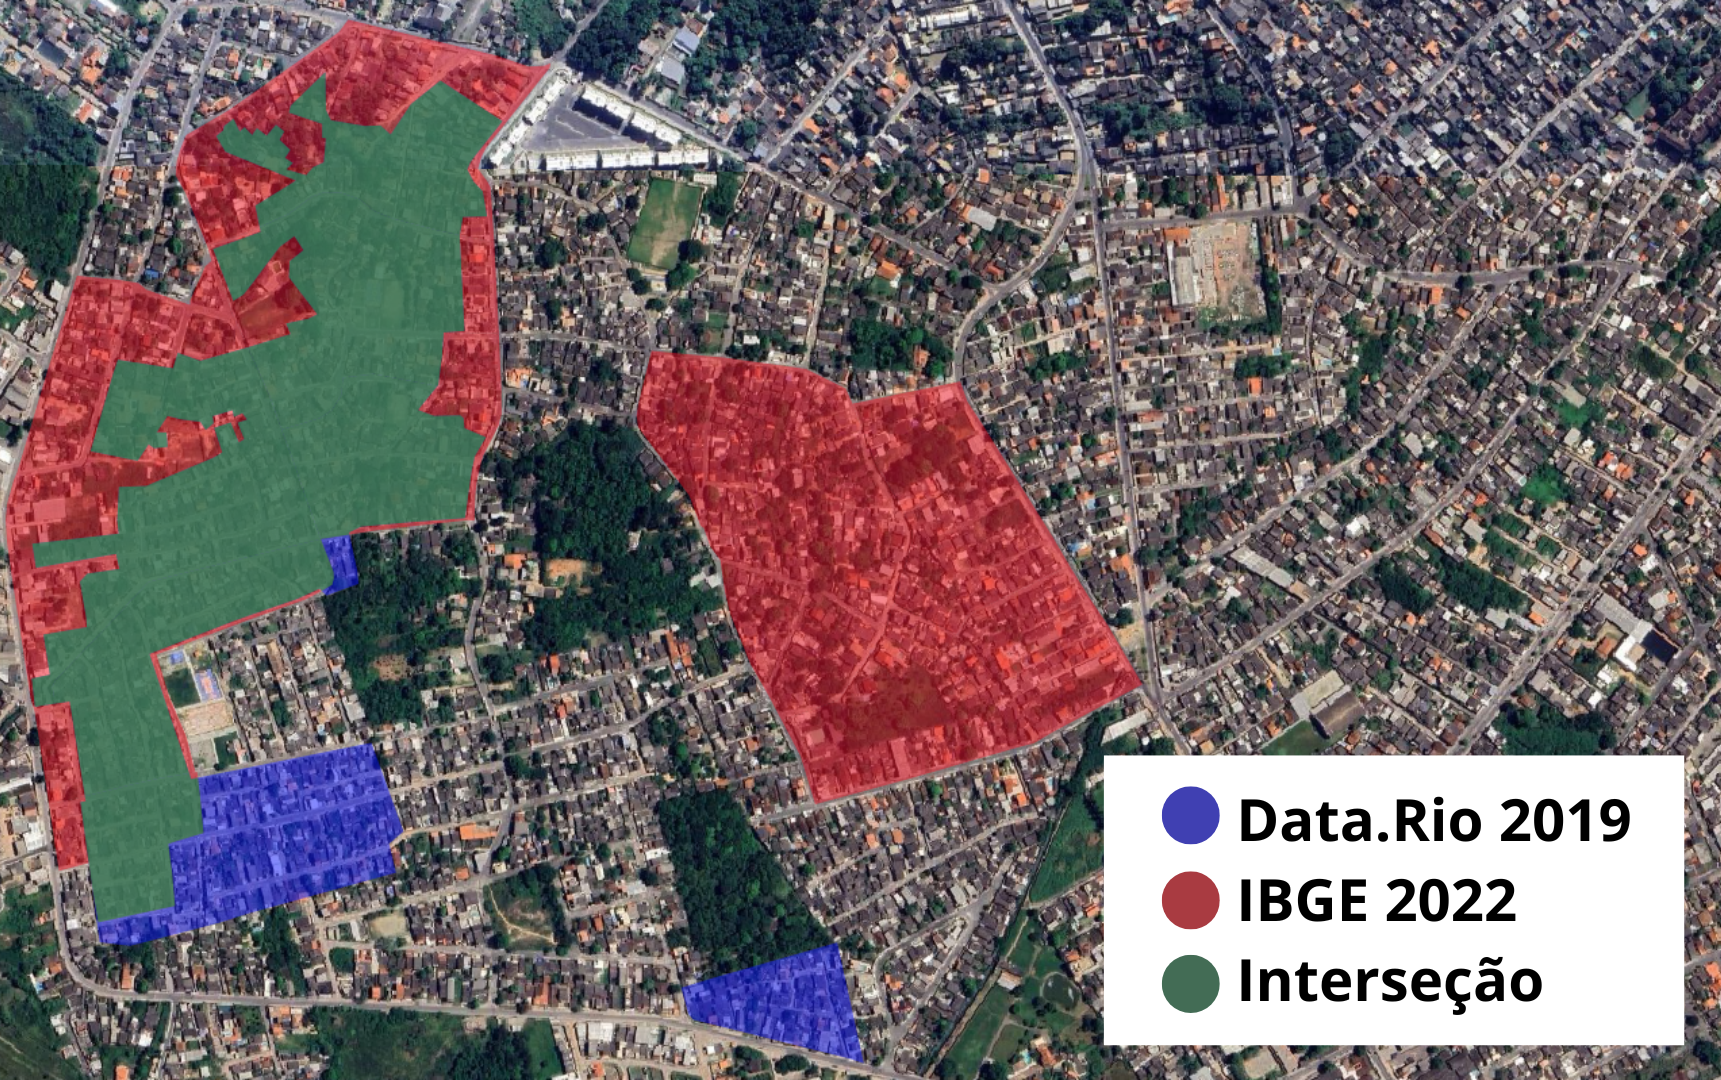
Figure 2: Favelas areas classified by the IBGE and by Data.Rio. The overlap of the two databases allows visualizing areas of agreement and divergence between the classifications, showing sections recognized by both sources and regions identified by only one of them.
Source: Own elaboration
The overlap of the polygons from the two databases allowed for the identification of classification discrepancies, revealing areas recognized as Favelas and Urban Communities (FCU) by the IBGE but not registered as favelas in DATA.RIO, and vice versa (Figure 2). The consolidation of these databases made it possible to expand the set of pre-classified areas, in order to extract from the grid of squares only the image sections that presented some prior identification of a favela in at least one of the sources.
As a result, a significant reduction in the number of images to be processed was observed. In the end, 1,512 squares potentially associated with the presence of favela areas were identified (Figure 3).
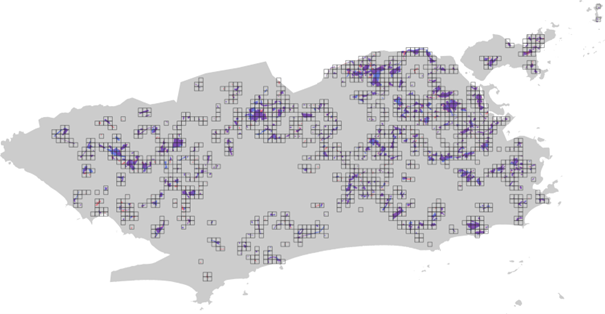
Figure 3: Overlap of the grid of squares with the favela areas classified by the IBGE and by Data.Rio. The combination of these layers allows identifying which sections of the grid show indications of containing favelas within the scene, based on the classifications previously carried out by the agencies.
Source: Own elaboration
- Training Sample
2.2.1 Identification of favela areas
The images from the spatial grid resulting from the overlap of the IBGE and Data.Rio areas (Figure 3) were considered as the target population, from which the training sample was extracted. A stratified sample with inverse sampling was selected, corresponding to 30% of the squares belonging to Planning Areas 1 to 4.
Planning Area 5 was excluded at this stage due to the high effort required to create the reference masks. Due to this operational limitation, AP5 was not included in the current sample, with its incorporation planned for future studies.
In stratified sampling, the population  is divided into strata
  — distinct and exhaustive groups, homogeneous in relation to the variable of interest. Selection occurs independently in each stratum, and the final sample results from the union of the selected units (Silva; Bianchini; Dias, 2023).
In this study, the strata correspond to the Planning Areas, since this division is based on the previously mentioned criteria that influence the urban pattern. Spatial stratification tends to significantly increase sampling efficiency, especially in regions with heterogeneous characteristics (Dong et al., 2022).
For the selection within the strata, simple inverse sampling was used, a sequential procedure in which, instead of directly selecting a fixed number n of units, the units of the population are successively evaluated until n of them satisfy the condition of interest (Silva; Bianchini; Dias, 2023). In the present study, this corresponded to evaluating  images until
  of them contained areas of favelas and urban communities.
In total, 358 images were evaluated, corresponding to the selected squares in APs 1 to 4. Of these, 286 images (30% of the eligible ones) composed the final sample, while 72 were discarded (Table 1).
Table 1: Number of images in the sample per Planning Area
AP | Population | Evaluated  | Discarded  | Sample  |
1 | 70 | 23 | 2 | 21 |
2 | 117 | 53 | 18 | 35 |
3 | 444 | 157 | 24 | 133 |
4 | 322 | 125 | 25 | 97 |
Source: Own elaboration
The identification of favela areas was carried out by analyzing the grid of sample squares in Google Earth Pro. In regions with Street View coverage, direct visual inspection of the buildings was performed. In areas without this coverage, the evaluation was based on the terrain relief and 3D constructions, examined from multiple angles and reference points within the images, which ensured a consistent visual identification of the areas of interest (Figure 4).
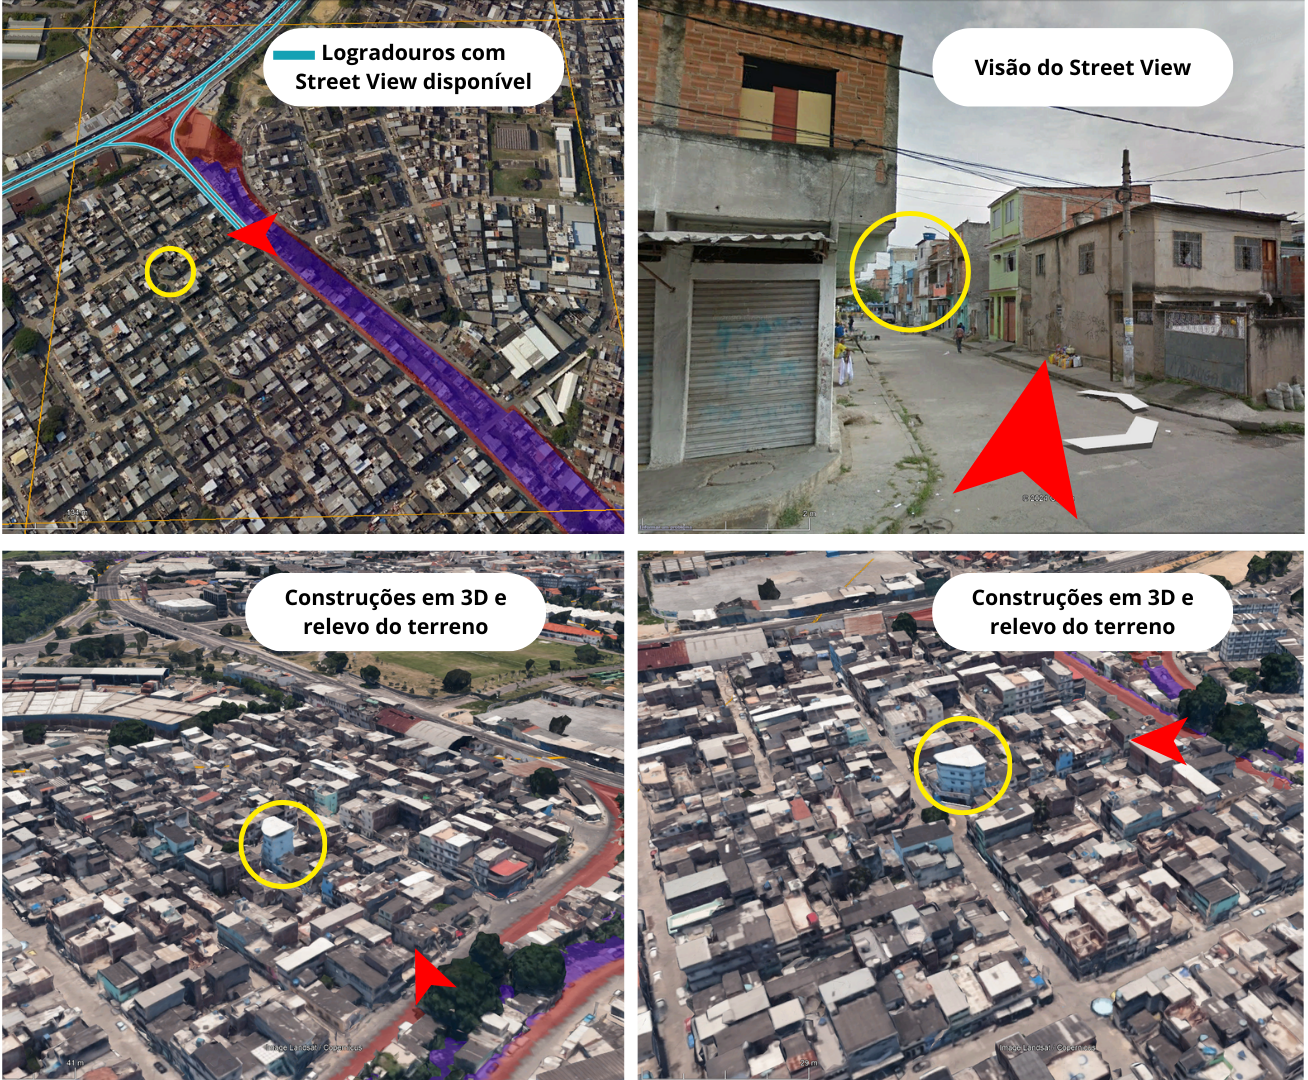
Figure 4: Visualization, in Google Earth Pro, of the overlap of the grid of squares with the favela areas classified by the IBGE and Data.Rio. The analysis includes the inspection of internal streets via Street View and, in locations where this tool is not available, the observation of the relief and 3D constructions. The placement of reference elements (yellow circle) assists in the geospatial location of each image during the visual analysis process.
Source: Own elaboration
Simultaneously with the visual identification of favelas in Google Earth Pro, the sample images were manually segmented in the drawing application Procreate, on a tablet, to produce the reference masks used in the training and testing of the model. In the masks, the favela areas were filled with the color white, while the other urban areas received the color black. During the process, an effort was made to outline elements that, although located within favelas, are not dwellings, such as trees, streets, and soccer fields, in order to refine the delineation of the areas of interest (Figure 5).
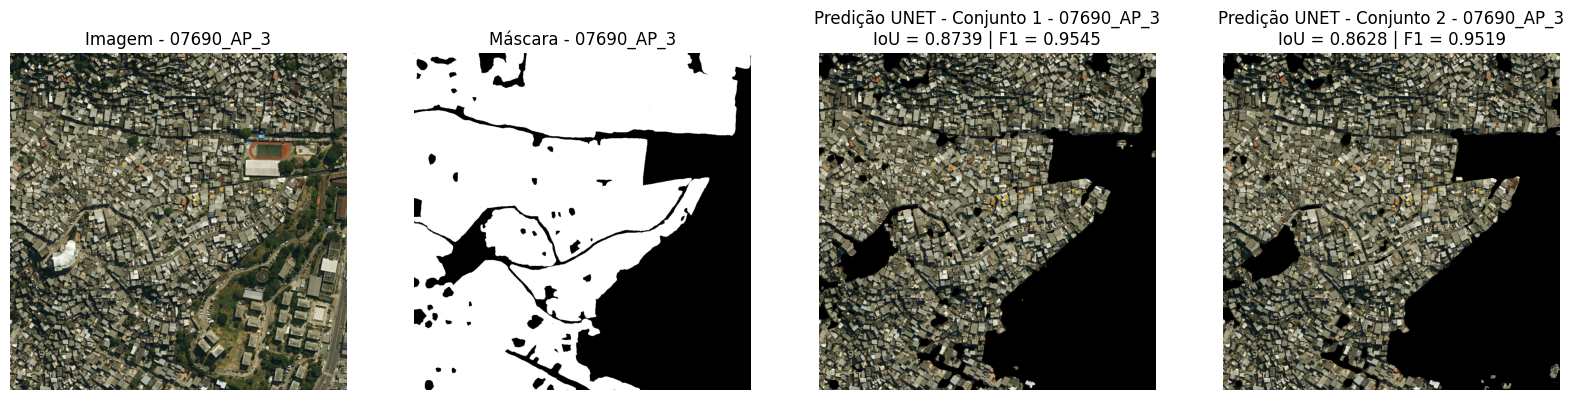
Figure 5: Satellite image 7690, corresponding to part of the Complexo do Alemão (Planning Area 3). In the lower right corner, the Colégio Estadual Jornalista Tim Lopes can be observed, and a little above, the Vila Olímpica Carlos Castilho. The figure also presents the reference mask produced in the study: the areas in white correspond to the regions classified as favela after the process of manual analysis and segmentation of the image, while the areas in black represent the other urban regions not classified as favela.
Source: Own elaboration
In total, an approximate area of 75 km² was analyzed, the images of which were entirely segmented manually. Of the total segmented area, 12.10% correspond to the variable of interest, that is, the favela areas. This percentage is higher than that of the areas officially demarcated as favelas by the IBGE and the IPP when considering the entire territorial extension of the municipality of Rio de Janeiro, in which these areas represent less than 5%.
The sample was divided into two distinct groups: training and testing. Of the total, 80% of the images (229) were allocated for model training, while 20% (57) composed the test set (Table 2). The images were distributed among the four Planning Areas (Figure 6).
Table 2: Quantity of training and test images
AP | Training | Test |
1 | 17 | 4 |
2 | 28 | 7 |
3 | 106 | 27 |
4 | 78 | 19 |
Source: Own elaboration
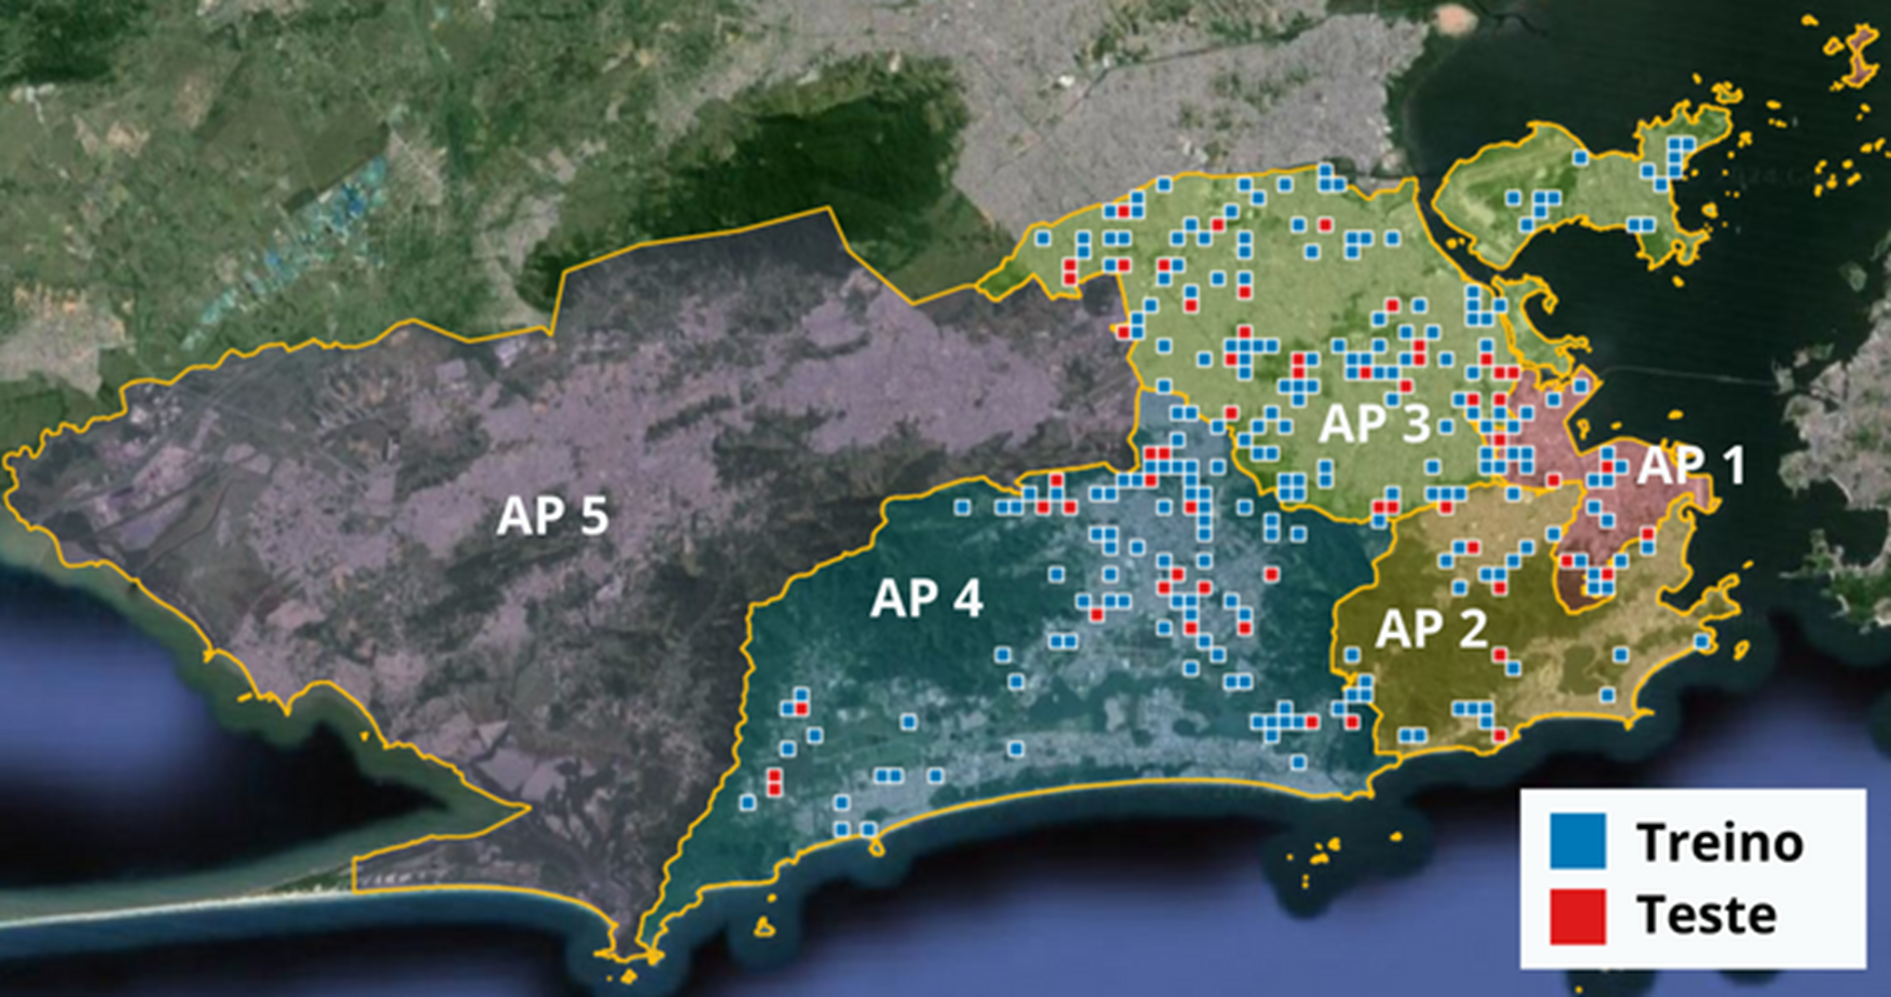 Figure 6: Spatial distribution of the training and test sets across Planning Areas 1 to 4, corresponding to the strata defined in the sampling process.
Source: Own elaboration
2.2.2 Criteria for selecting favela areas
The discarding of part of the images during the inverse sampling process was carried out through individual visual inspection, aiming to ensure that only those presenting pixels corresponding to constructions characteristic of favelas were included in the sample.
The exclusion of images occurred due to the absence of typical favela constructions within the analyzed scene. This fact stems from the spatial delimitations used — both from the IBGE and Data.Rio — often presenting a territorial extension greater than the effective area of the favela. Thus, in the process of overlapping these areas with the grid of squares used to define the population, images that did not contain favelas were included (Figure 7).
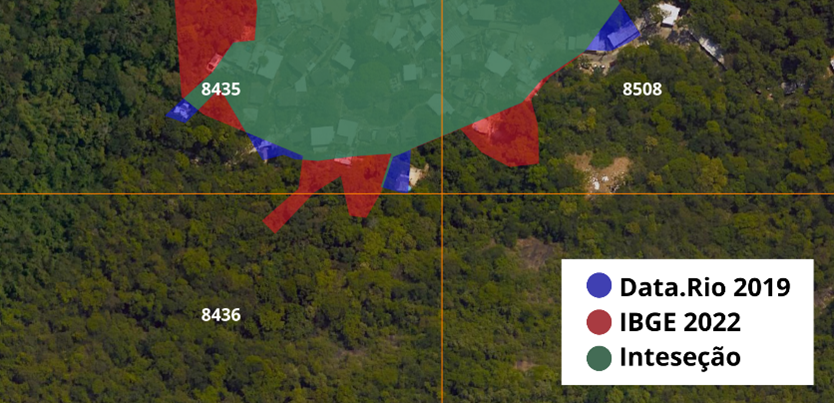
Figure 7: Image 8436, located near the Complexo do Turano, in the Rio Comprido neighborhood, was discarded. Although the IBGE database indicates a small favela area within the section, there are no constructions with compatible characteristics in that portion of the scene. In contrast, images 8435 and 8508 present buildings that justify their inclusion in the analysis.
Source: Own elaboration
As it is an image-based analysis, the identification of favela areas was based on a set of visual criteria (Figure 8):
- Irregular pattern of constructions: disorderly arrangement of buildings, with no signs of urban planning.
- Precarious construction materials: use of improvised or low-durability materials.
- Location on slopes: presence of constructions on sloping terrain, often subject to landslide risks.
- Proximity to highways and railways: occupations in restricted strips along transportation infrastructure.
- Proximity to drainage ditches: occurrence of buildings next to open sewers or precariously channeled watercourses.
- Narrow streets: streets with reduced width, generally incompatible with the circulation of emergency vehicles or public transport.
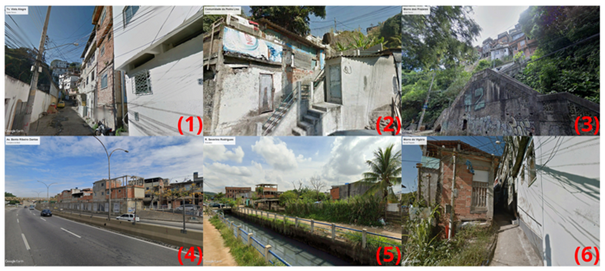
Figure 8: Visual criteria for identifying favelas. The highlighted areas present: (1) irregular pattern of constructions without urban planning; (2) precarious construction materials; (3) occupation on slopes; (4) proximity to highways and railways in restricted strips; (5) buildings next to drainage ditches and open sewers; (6) narrow streets incompatible with emergency vehicle circulation.
Source: Own elaboration
- Image Augmentation to Expand the Training Set
To expand the training set without the need to manually produce new masks, the Albumentations library (Buslaev, 2018) was used, which allows applying fast, efficient, and flexible transformations to images, such as mirroring, rotations, and geometric distortions.
The following transformations were applied to the original (OR) set of images (Figure 9):
- HorizontalFlip (HF) – horizontal mirroring of the image;
- VerticalFlip (VF) – vertical mirroring of the image;
- Transpose (TP) – transposition of the image, inverting rows and columns.
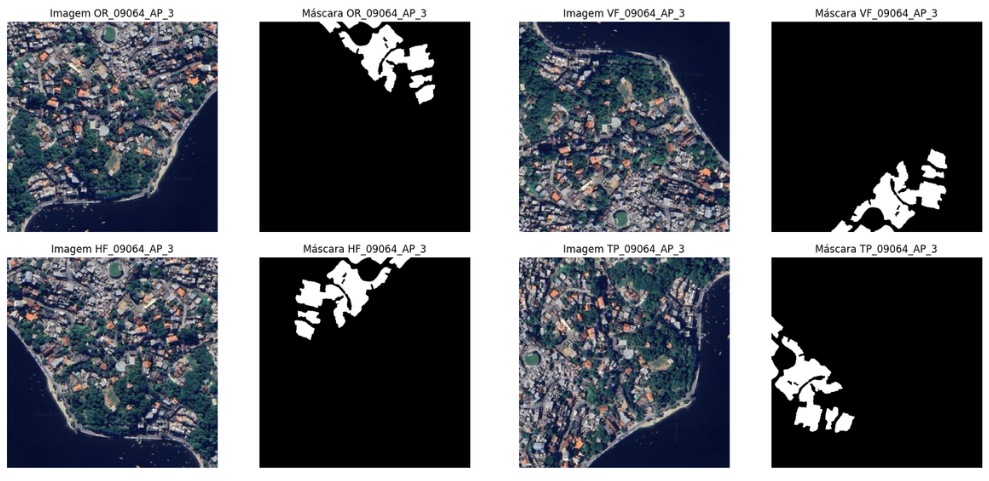
Figure 9: Image 09064, located in the Cocotá neighborhood on Ilha do Governador, near Praia de Cocotá (Planning Area 3). The original image was subjected, via the Albumentations library, to horizontal mirroring, vertical mirroring, and row and column transposition transformations. The same transformations were applied to the corresponding reference mask, ensuring the consistency of the image-mask pair after data augmentation.
Source: Own elaboration
Based on these transformations, two data sets were defined for model training:
- Model trained without data augmentation;
- Model trained with data augmentation.
In the model trained with data augmentation, after image augmentation, the number of training images became four times larger than the original set (without data augmentation), while the test set remained unchanged.
- Automatic Identification of Favela Areas
The automatic identification of favela areas in the satellite images was performed from the set of training images, processed using a model based on the U-Net architecture (Ronneberger; Fischer; Brox, 2015). This convolutional neural network (CNN) is specifically designed for semantic segmentation tasks, in which each pixel of the image is classified into a specific category.
The application of deep neural networks, particularly the U-Net architecture, for mapping precarious settlements from satellite images has been explored in recent studies, demonstrating promising results.
Lu et al. (2021) proposed GASlum-Net, an innovative architecture that combines the principles of U-Net and ConvNeXt in a two-stream framework to integrate RGB images (from the Jilin-1 satellite, 5 m) and geospatial features derived from Sentinel-2. Their model, trained on 2,892 images of 64x64 pixels, significantly outperformed the baselines (U-Net, ConvNeXt-UNet, and FuseNet), achieving an improvement of up to 10.97% in IoU. The study highlighted the model's effectiveness in detecting medium and large-sized slums (5 a >25 ha) and analyzed the impact of different features and architectural adjustments on performance.
Additionally, Abascal et al. (2022) applied U-Net to map urban deprivation patterns in Nairobi, using very high-resolution images (WorldView-3, 30 cm). The model achieved an accuracy of 0.92 and an IoU of 0.73 on the test set, validating its effectiveness for urban feature extraction. The study also revealed limitations in distinguishing individual buildings in high-density areas, where the pixel size exceeded the spaces between constructions. To overcome this, the authors resorted to an aggregated morphological analysis, classifying areas into deprivation levels (High, Medium, Low) with an overall accuracy of 0.71. The research concluded that semi-automatic feature extraction is feasible and that combining deep learning with spatial analysis provides valuable insights for urban planning.
The main characteristic of this architecture is its symmetrical "U"-shaped structure, composed of two complementary parts, the encoder and the decoder (Figure 10).
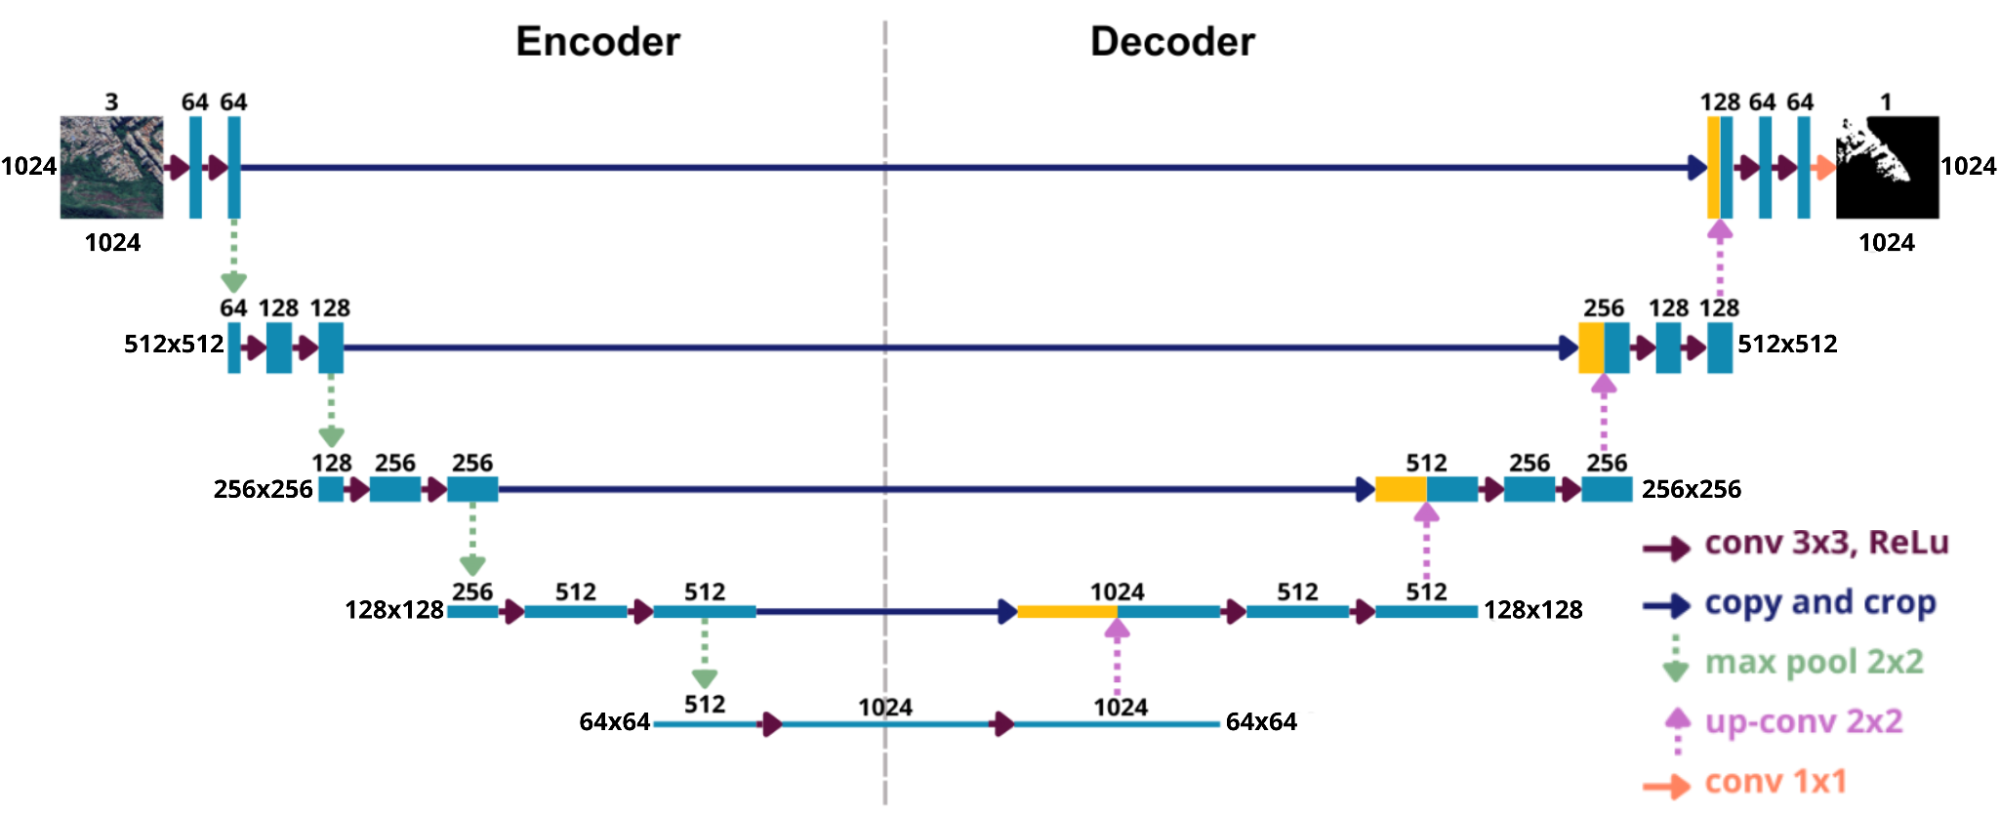
Figure 10: Illustration of the U-Net architecture applied to images of 1024 × 1024 pixels with three channels, presented in its characteristic symmetrical format, composed of encoder (contraction) and decoder (expansion) blocks.
Source: Own elaboration
The blue boxes in Figure 10 represent the feature maps extracted from the images, while the yellow boxes show the copies of these features used later. The arrows indicate the different operations performed throughout the network.
On the left side is the encoder, or contraction path, responsible for extracting features from the input image. As the image passes through convolutional layers (red arrow) followed by the application of the ReLU (Rectified Linear Unit) activation function, the network identifies patterns at different levels, increasing the number of channels. Then, the 2x2 max pooling layers (green arrow) reduce the spatial resolution, allowing the network to capture more general information.
On the right side is the decoder, or expansion path, responsible for recovering the resolution of the features and reconstructing the segmentation map. This process is performed through transposed convolutions (pink arrow), which increase the spatial resolution, followed by the application of the ReLU activation function and new convolutional layers (red arrow), which refine the recovered details.
Between the two paths are the skip connections (blue arrow), which directly link the layers of the contraction to the corresponding layers of the expansion. These connections concatenate the feature maps from both sides, allowing the combination of fine details — preserved in the encoder — with the more abstract information from the decoder, generating more precise segmentations.
Finally, the output layer (orange arrow) is a convolutional layer responsible for producing the final segmentation, with the same resolution as the original image.
During model training, Dice Loss, defined as 1 - Dice Coefficient (Figure 11), was used as the loss function. This choice was motivated by the class imbalance, as the favela areas occupy a significantly smaller proportion of the image compared to other urban classes. Dice Loss is especially suitable for segmentation tasks in unbalanced scenarios, as it more severely penalizes errors in predicting the minority class and favors maximizing the overlap between the predicted and reference masks.
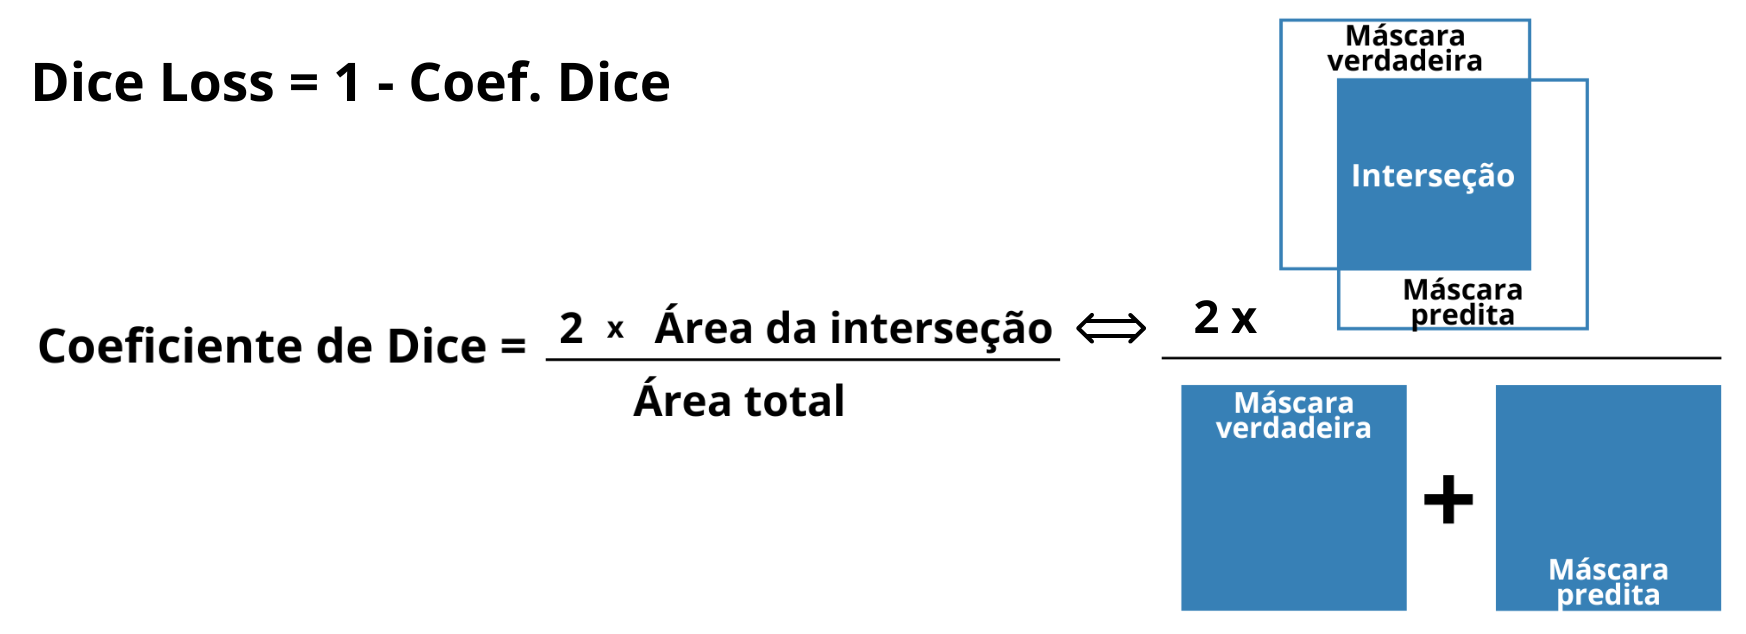
Figure 11: Illustration of the concept of the Dice Coefficient and Dice Loss, showing the relationship between twice the area of intersection of the true mask and predicted mask regions and the sum of the areas of both masks.
Source: Own elaboration
For both data sets, training was performed with a maximum number of 400 epochs, using early stopping with a patience of 50 epochs, a technique that stops training when there is no improvement in validation performance for a certain number of epochs, avoiding overfitting. In both cases, a batch size of 8 and a learning rate of 1 × 10⁻⁴ were adopted. In Data Set 2, the use of data augmentation increased the effective number of samples, allowing this configuration to be maintained and ensuring a fair comparison between the models.
The implementation of the model, as well as the entire training and evaluation pipeline, was developed in the Python language, using specialized deep learning libraries, notably TensorFlow and Keras in building the neural architecture. Image preprocessing was performed with OpenCV (cv2) and NumPy, while quantitative evaluation employed metrics from the scikit-learn library.
- Metrics for Model Performance Evaluation
The evaluation metrics used in this study were IoU (Intersection over Union), F1-Score (or F-statistic), Recall, and Precision. Both range from 0 to 1, with values closer to 1 indicating greater model accuracy in the segmentation task.
IoU, also known as the Jaccard index, measures the degree of overlap between the predicted mask and the true mask, calculated by the ratio of the intersection area to the union area of the two masks (Lakshmanan; Görner; Gillard, 2021). The higher the IoU value, the more precise the segmentation, making it especially relevant in tasks that demand high spatial accuracy (Figure 12).
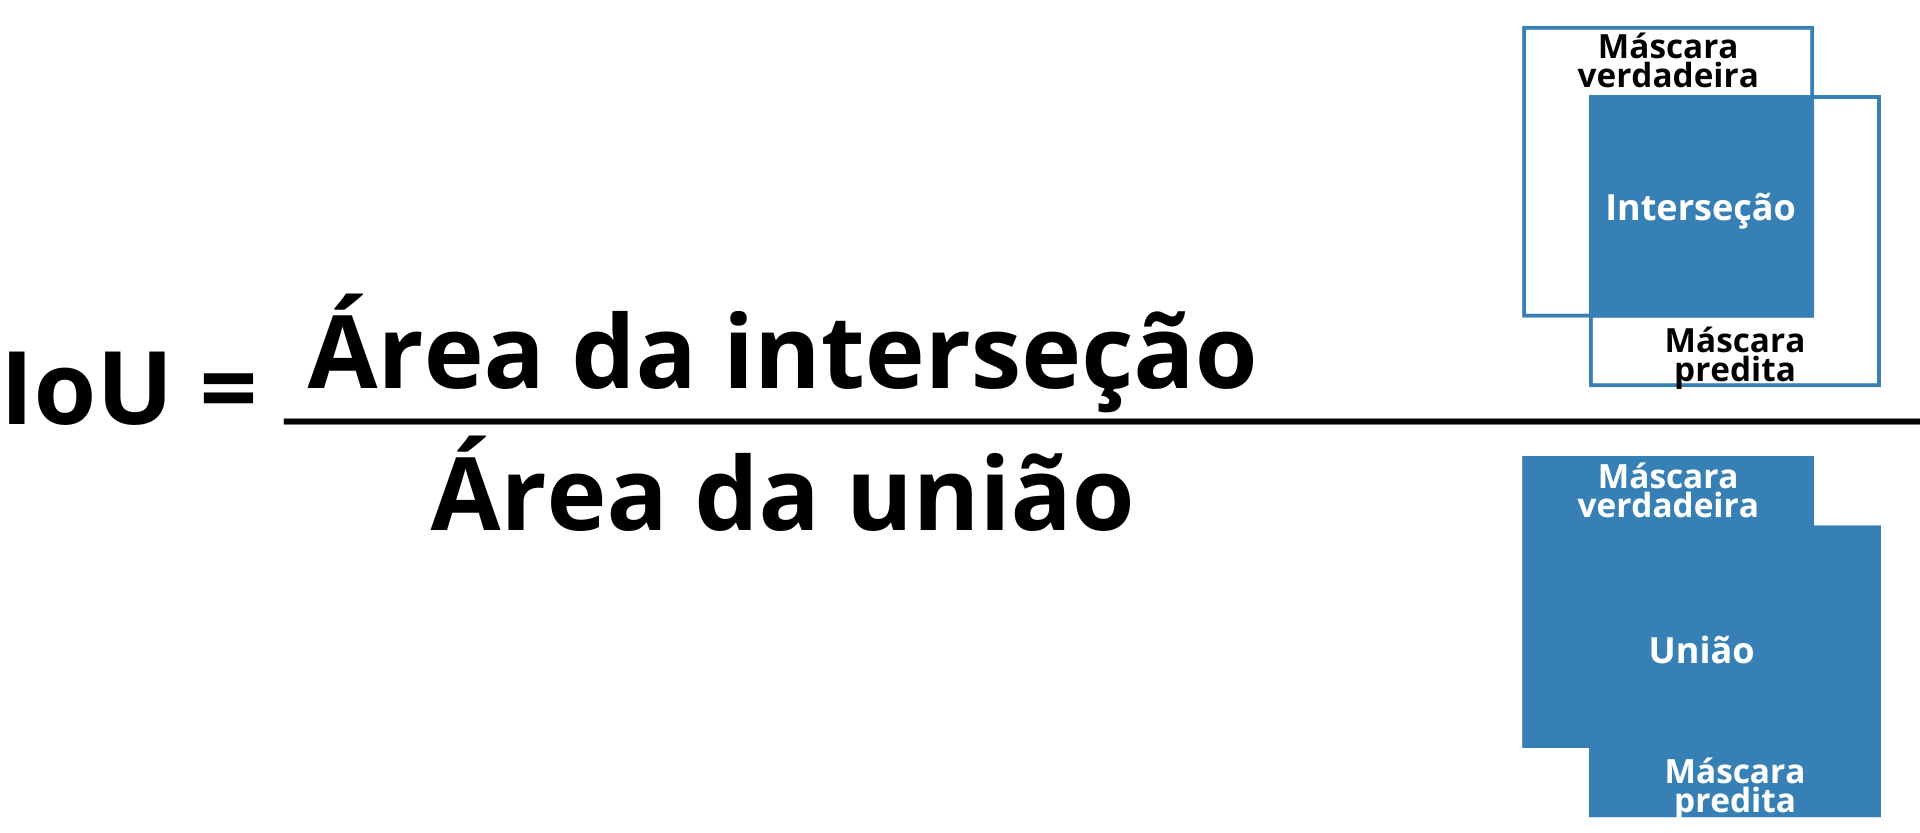
Figure 12: Illustration of the IoU (Intersection over Union) concept, showing the intersection area between the true mask and the predicted mask in relation to the union area of both.
Source: Own elaboration
For a deeper understanding of the other metrics, it is essential to know the concepts associated with the confusion matrix (Figure 13): True Positive (TP), True Negative (TN), False Positive (FP), and False Negative (FN) (Provost; Fawcett, 2016).
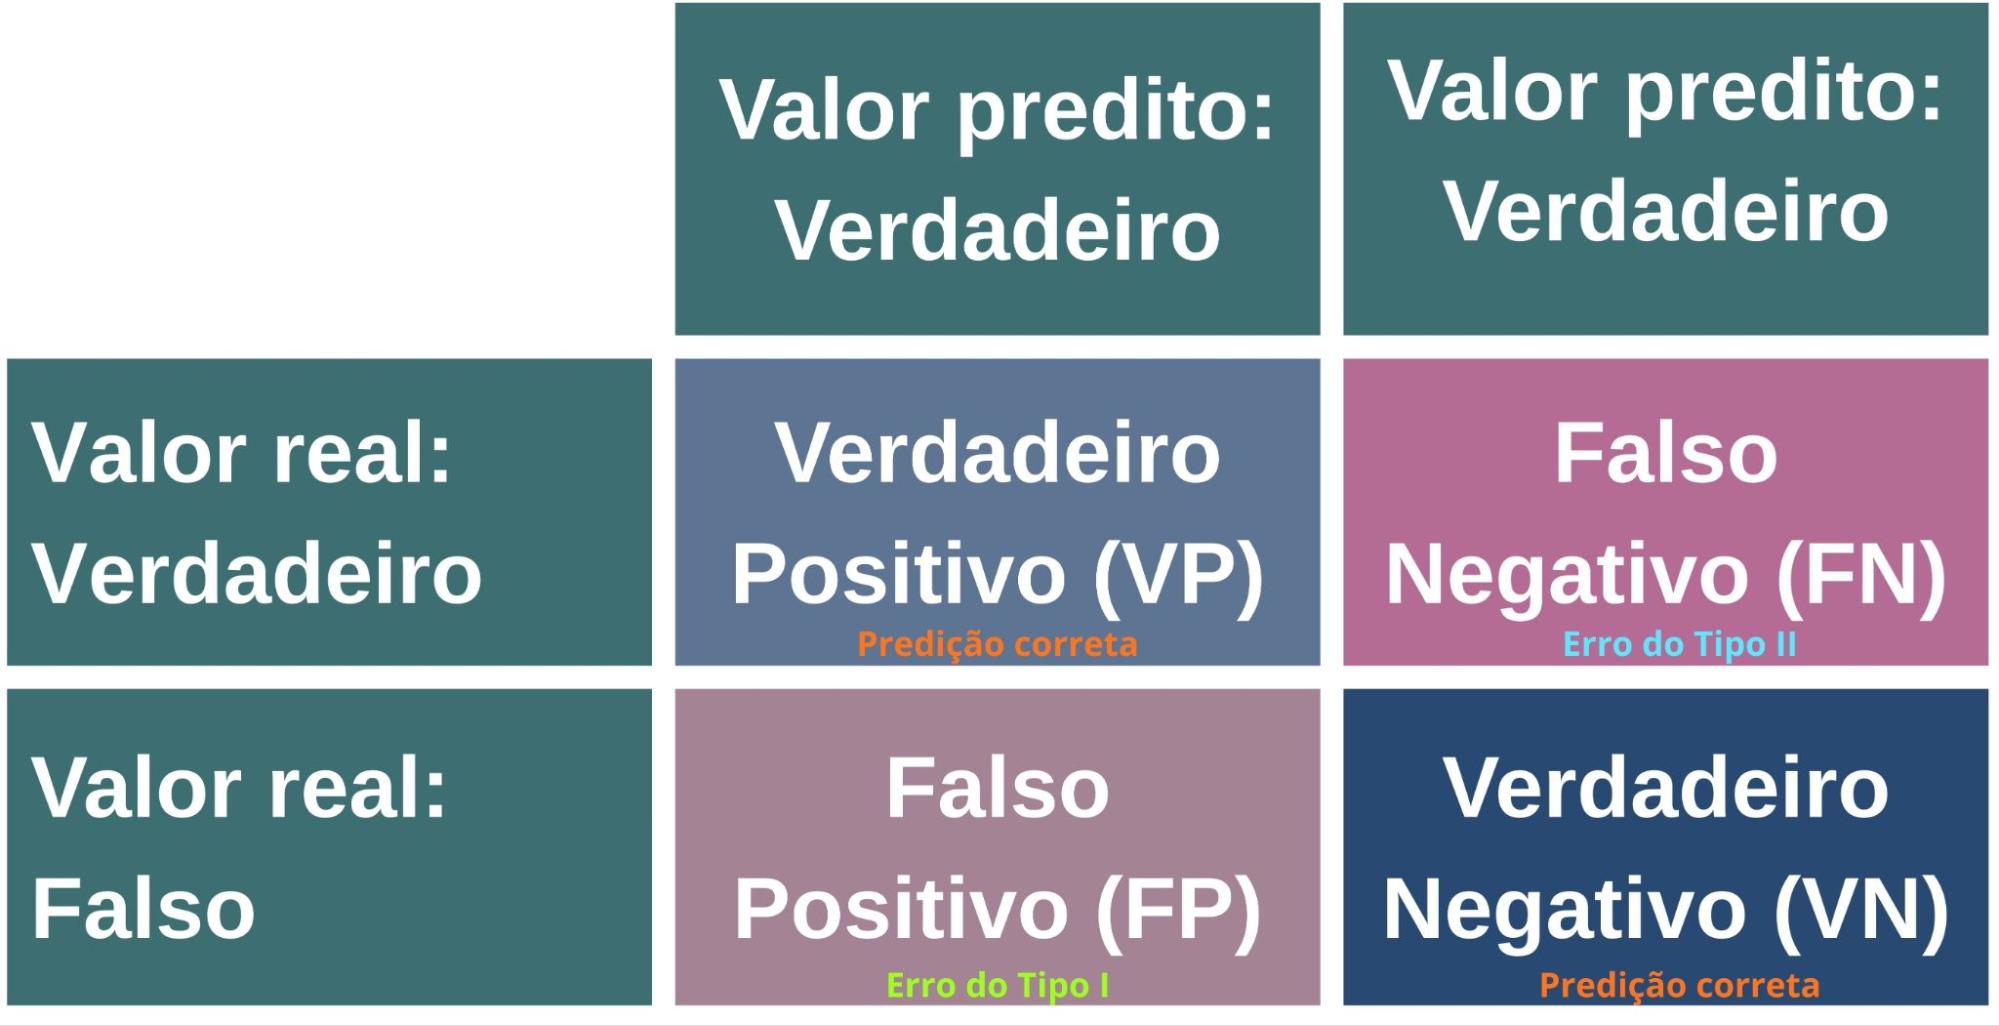
Figure 13: Confusion matrix, which compares the model's predicted values with the actual values, organizing the results into four categories: True Positives (TP) and True Negatives (TN) represent correct predictions; False Positives (FP) and False Negatives (FN) represent errors.
Source: Own elaboration
- True Positive (TP): Case in which the model predicts the positive class and this prediction corresponds to the actual positive class. That is, the model correctly identifies the presence of the class of interest.
- True Negative (TN): Situation in which both the model's prediction and the reality belong to the negative class. Thus, the model adequately recognizes the absence of the class of interest.
- False Positive (FP): Occurs when the model predicts the positive class, but the actual class is negative. In other words, the model erroneously signals the presence of the class of interest.
- False Negative (FN): Case in which the model predicts the negative class, but the actual class is positive. This means the model fails to identify the presence of the class of interest.
Precision and Recall are complementary metrics widely used in evaluating classification models, especially in contexts of class imbalance (Figure 14). While Precision is associated with the reliability of positive predictions made by the model, Recall reflects its ability to correctly identify existing positive cases (Provost; Fawcett, 2016):
- Precision: evaluates the proportion of positive predictions that are actually correct, calculated by the ratio between true positives (TP) and the sum of true positives and false positives (TP + FP).
- Recall: measures the model's ability to identify all real positive cases, corresponding to the ratio between true positives (TP) and the sum of true positives and false negatives (TP + FN).
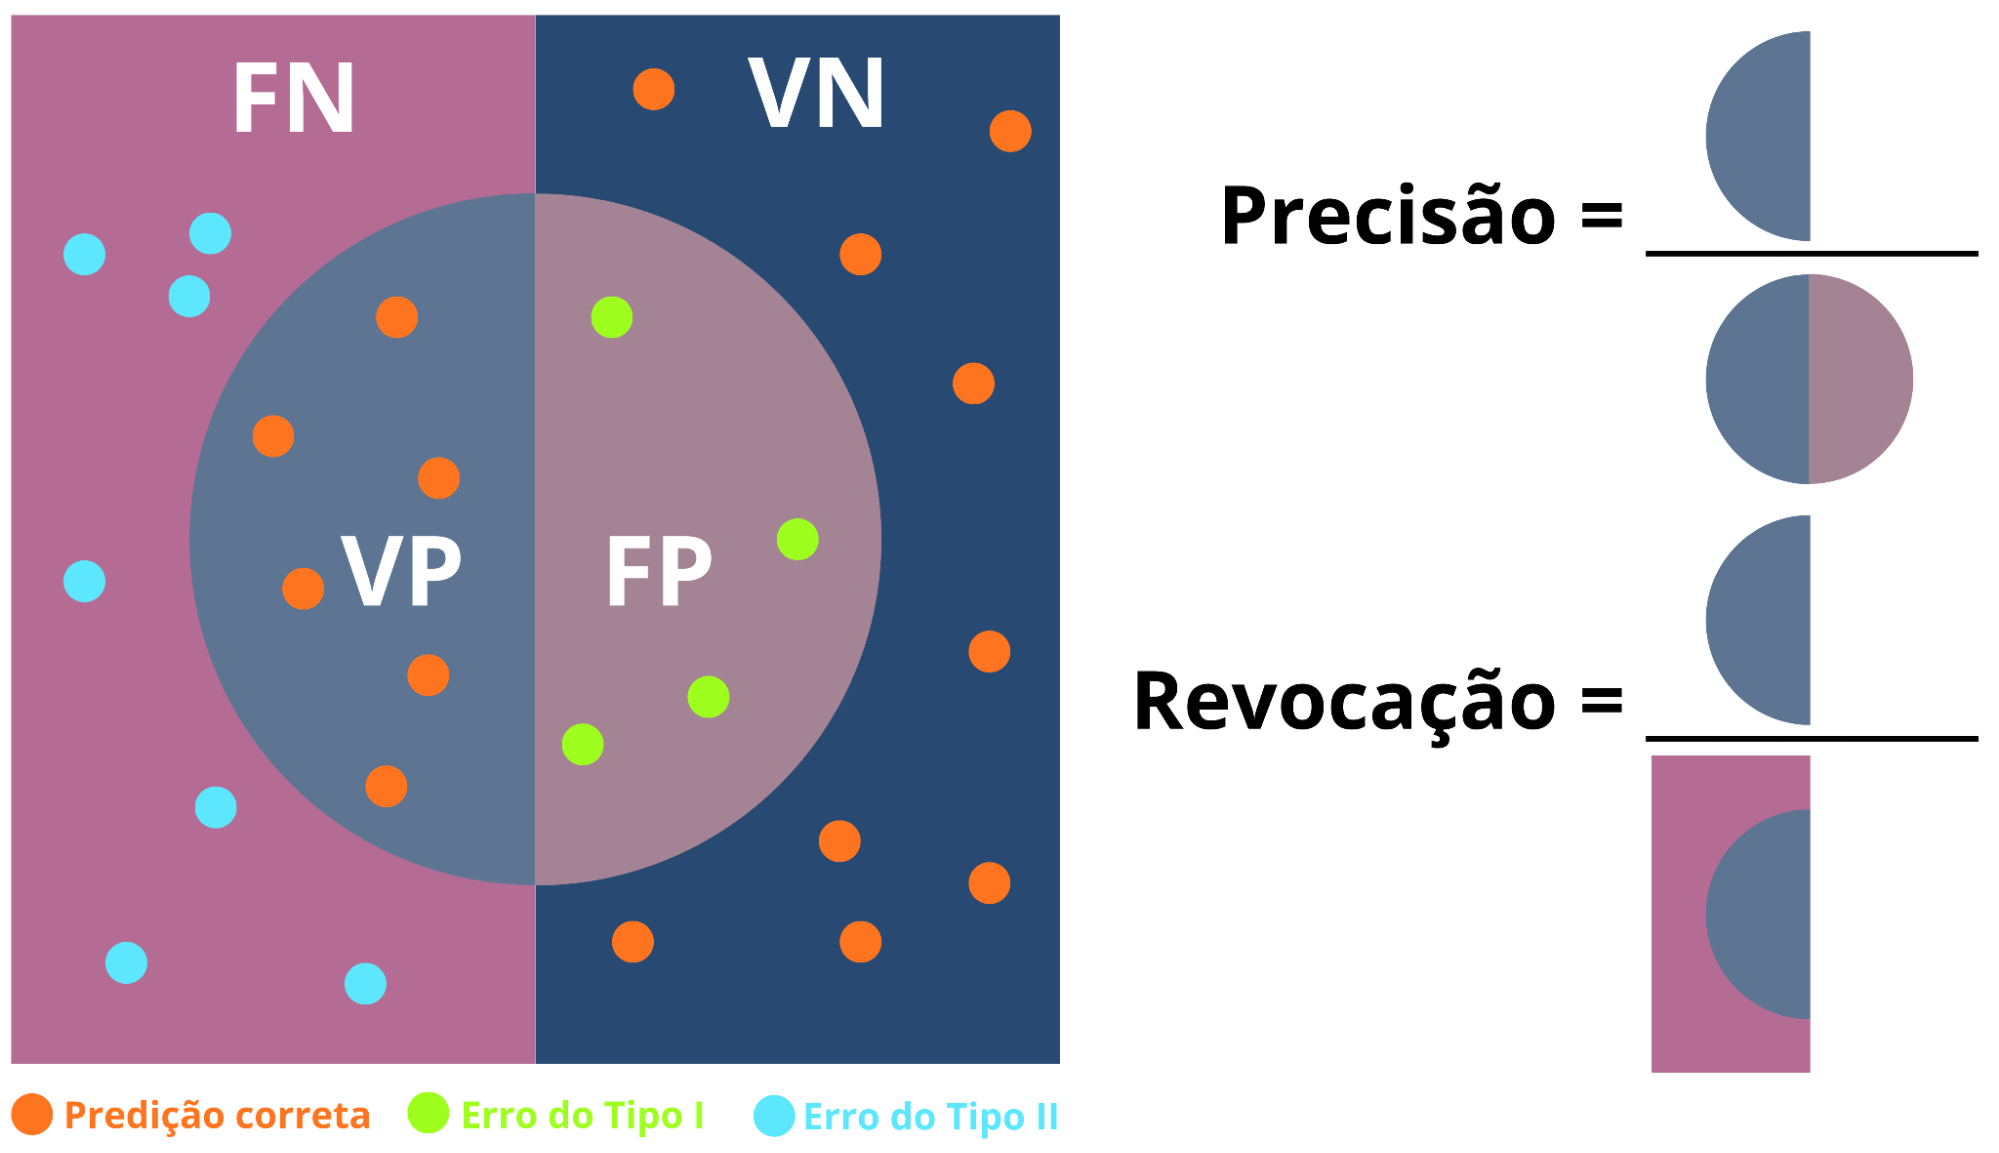
Figure 14: Illustration of the concept of Precision and Recall. The figure illustrates how false positives reduce Precision and false negatives reduce Recall, emphasizing that the emphasis on one metric impacts the other.
Source: Own elaboration
The F1-Score, in turn, integrates the Precision and Recall metrics into a single measure, allowing for the simultaneous evaluation of the reliability of positive predictions and the model's ability to correctly identify all positive cases (Provost; Fawcett, 2016).
This metric is calculated through the harmonic mean between Precision and Recall, which penalizes extreme values and results in a more balanced and representative evaluation of the model's performance, especially in scenarios with class imbalance.
 (1)
(1)
Methodology
After training the models with and without data augmentation, the lowest values of the loss function were reached at epoch 52 for the model without data augmentation and at epoch 71 for the model with data augmentation. In both cases, there was no improvement in the subsequent 50 epochs, which triggered the early stopping criterion.
The overall analysis of the results, considering the average of the four planning areas, indicates that the model trained with data augmentation shows superior performance in three of the four evaluated metrics. It obtained higher average values for IoU, Precision, and F1-Score, evidencing an improvement in the overall segmentation quality and in the balance between false positive and false negative errors.
On the other hand, the model without data augmentation presented a higher average value for Recall, indicating a greater ability to correctly identify regions of interest, albeit at the cost of a higher incidence of false positives. This behavior reinforces the existence of a trade-off between Precision and Recall, where an increase in one metric tends to negatively impact the other.
In general, the results suggest that the use of data augmentation contributes to making the model more balanced and robust, with consistent gains in aggregated metrics such as IoU and F1-Score, which are particularly relevant for the overall performance evaluation in segmentation tasks (Table 3).
Table 3. Average performance of evaluation metrics for the U-Net trained without and with data augmentation. The superior values between the two models per Planning Area and Overall are highlighted in blue.
AP | Model without data augmentation | Model with data augmentation |
IoU | Prec | Recall | F1 | IoU | Prec | Recall | F1 |
1 | 0,7037 | 0,5101 | 0,7850 | 0,5887 | 0,7053 | 0,5328 | 0,7031 | 0,5828 |
2 | 0,7491 | 0,6953 | 0,7962 | 0,7287 | 0,7576 | 0,7419 | 0,7659 | 0,7344 |
3 | 0,6334 | 0,5188 | 0,7785 | 0,5628 | 0,6847 | 0,6034 | 0,7548 | 0,6256 |
4 | 0,7283 | 0,5188 | 0,7785 | 0,6791 | 0,7441 | 0,6902 | 0,7282 | 0,6955 |
Overall | 0,6842 | 0,5189 | 0,7751 | 0,6238 | 0,7149 | 0,6444 | 0,7437 | 0,6592 |
Source: Own elaboration
The disaggregated analysis by Planning Area (AP) shows that the effects of data augmentation vary according to the spatial context, although a general pattern of improvement in aggregated metrics is observed. In APs 2, 3, and 4, the model with data augmentation presented performance superior or equivalent to the model without data augmentation in the metrics of IoU, Precision, and F1-Score, indicating consistent gains in segmentation quality and in the balance between classification errors.
In AP 3, in particular, the advantage of the model with data augmentation is more pronounced, with significant increases in IoU, Precision, and F1-Score, in addition to a high Recall. Similar results, although less accentuated, are observed in APs 2 and 4, where the model with data augmentation maintains globally superior performance.
AP 1 presents a distinct behavior. Although the model with data augmentation obtains a slightly higher IoU (0.7053 vs. 0.7037) and higher Precision (0.5328 vs. 0.5101), the model without augmentation presents considerably higher Recall (0.7850 vs. 0.7031), resulting in a marginally superior F1-Score. This result indicates a more pronounced trade-off between Precision and Recall in this specific area, possibly associated with the particular characteristics of the region and the limited number of samples available.
In summary, the analysis by AP confirms that data augmentation tends to produce more balanced models with better overall performance, especially in terms of IoU and F1-Score, although its impact may vary locally depending on the distribution and representativeness of the training data.
The boxplot presents the distribution of metrics for the 57 images in the test set, stratified by Planning Area, revealing important patterns (Figure 15). The model trained with data augmentation demonstrates lower dispersion in the values of IoU and F1-Score, indicating more consistent and predictable performance in these metrics. In contrast, the model without data augmentation presents higher median values in the Recall metric. Regarding Precision, the model with augmentation shows a distribution slightly shifted upwards, with higher first, third quartiles, and median, suggesting superior performance.
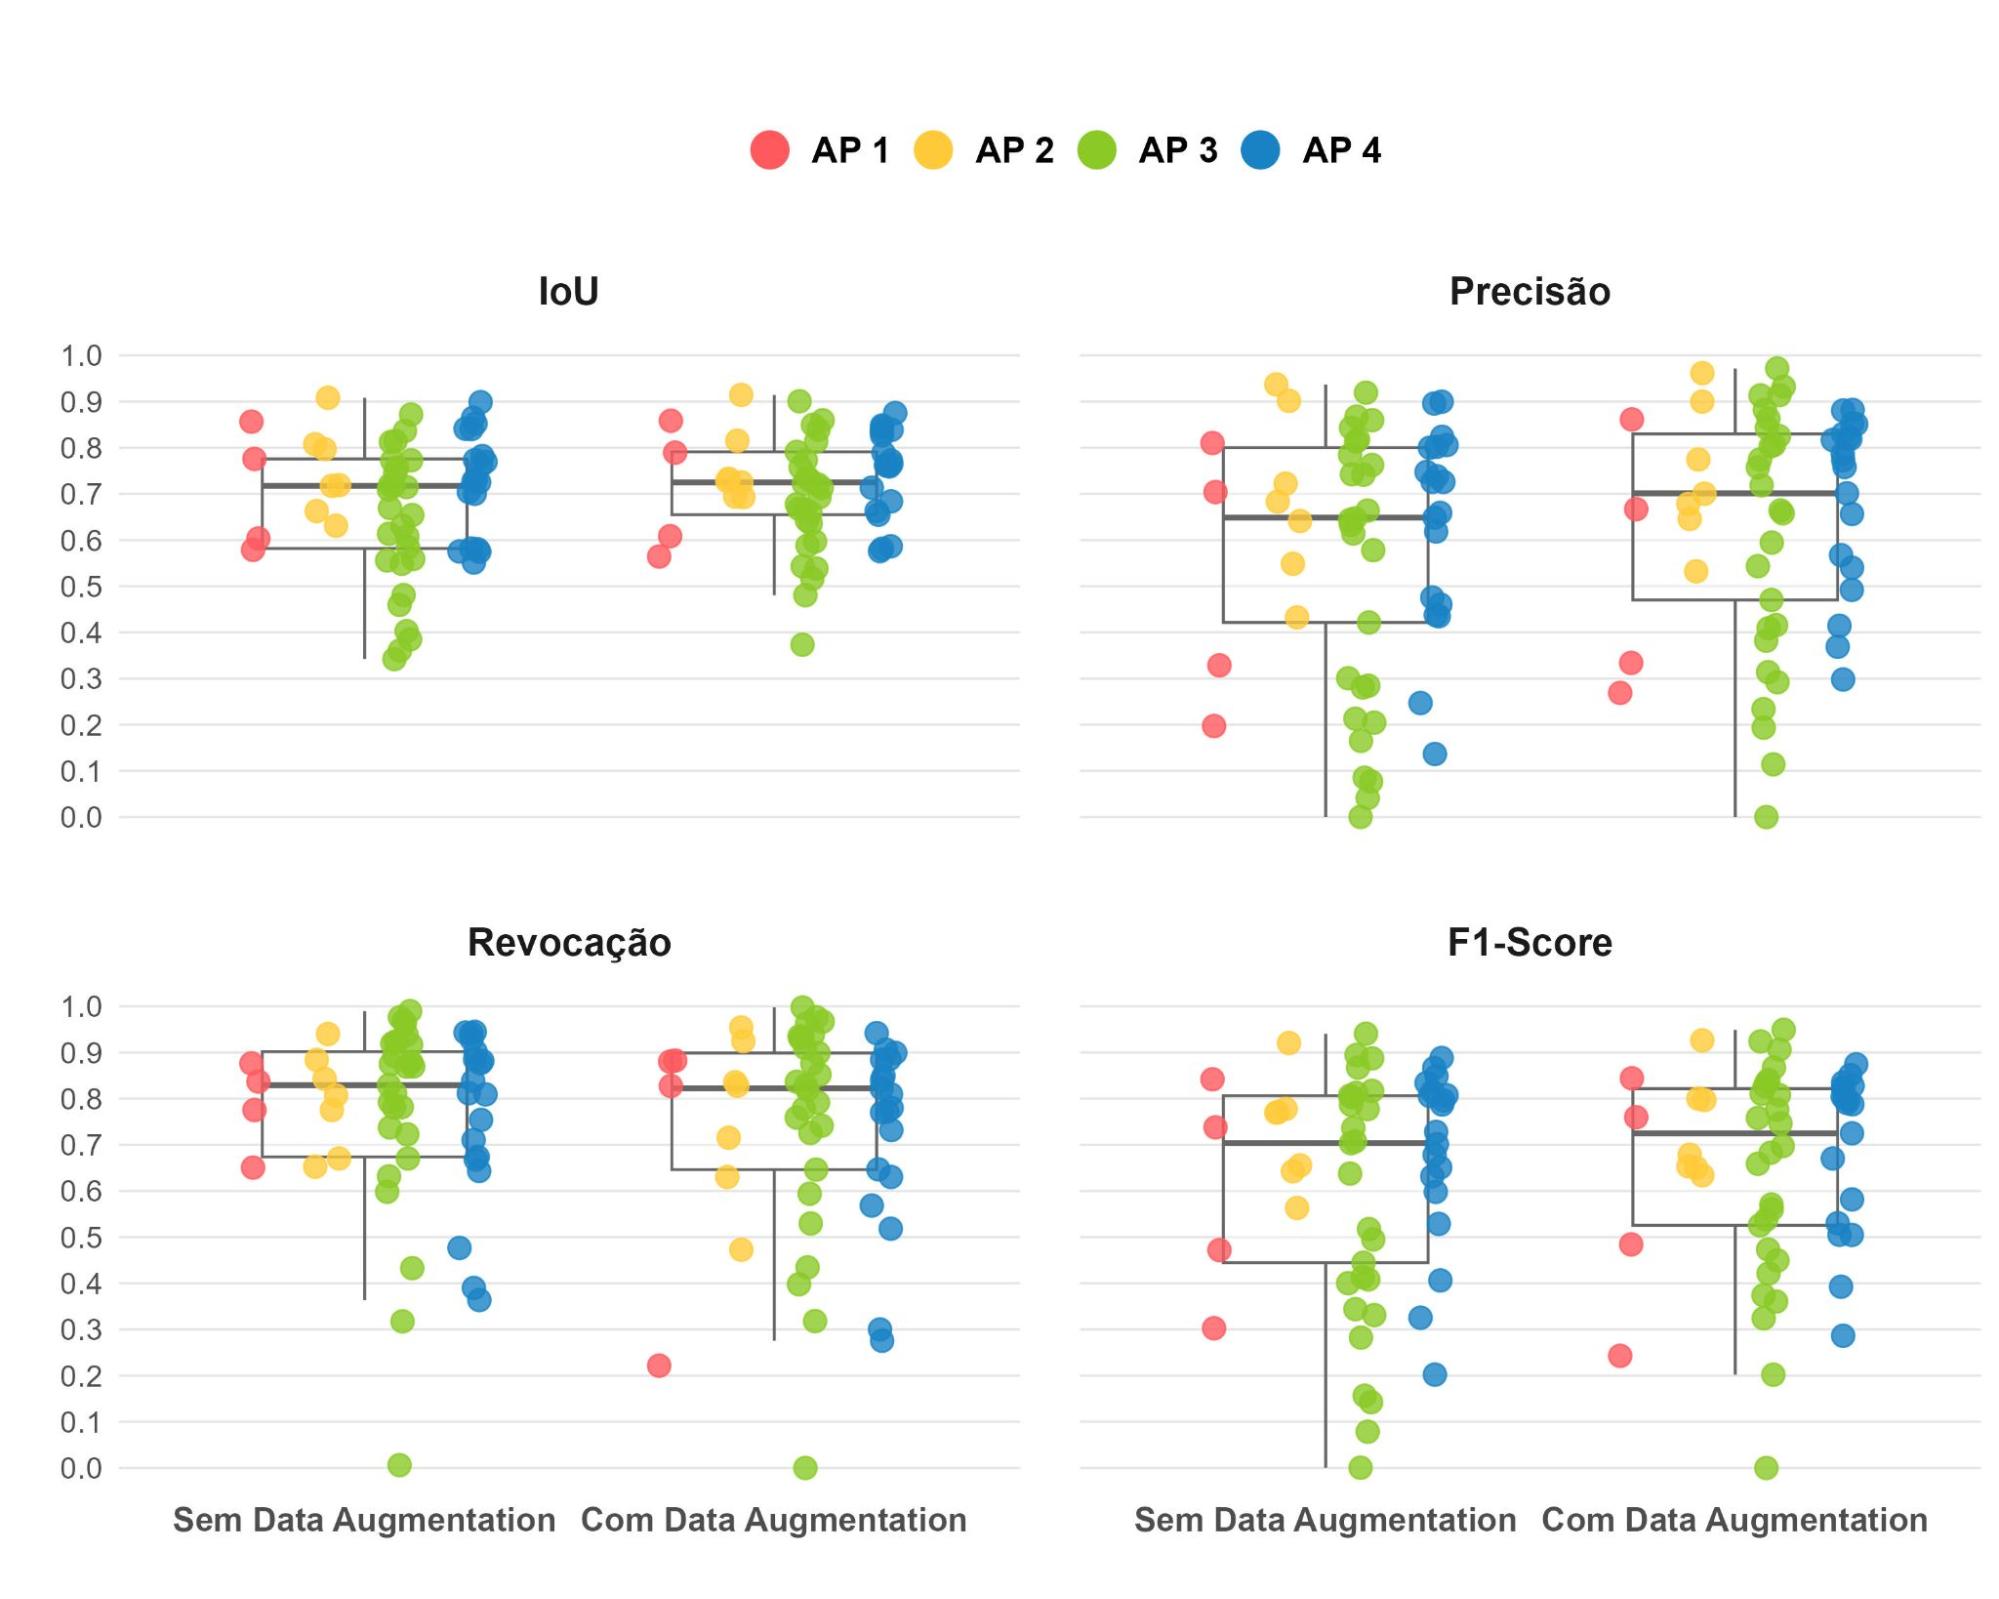
Figure 15: Distribution of evaluation metrics (IoU, Precision, Recall, and F1-Score) for the U-Net trained without and with data augmentation, stratified by Planning Area (AP). The analysis reveals that the model with data augmentation presents lower dispersion in the metrics of IoU, Precision, and F1-Score, while the model without augmentation has higher quartiles in Recall.
Source: Own elaboration
To objectively evaluate whether the observed performance gain was statistically significant, hypothesis tests were conducted comparing the IoU and F1-Score values obtained by the model with data augmentation against those of the model without data augmentation. As the data from the 57 images in the test set represent paired measurements (each image evaluated by both models), appropriate statistical tests for paired samples were selected.
Initially, the Shapiro–Wilk test applied to the individual differences in IoU values for each image rejected the hypothesis of normality (p-value = 0.0019), thus violating a fundamental assumption of the paired t-test. Given this, the Wilcoxon signed-rank test for paired samples was chosen, a non-parametric method robust to deviations from normality, which assesses whether the differences between the pairs show a systematic shift from zero.
The test was configured with a one-sided alternative hypothesis (H₁) that the IoU values of the model with data augmentation (M₂) tend to be greater than those of the model without data augmentation (M₁), as defined below:
- H₀: The distributions of the IoU values of M₁ and M₂ are equal. That is, there is no evidence that the IoU values of M₂ are systematically greater than those of M₁.
- H₁: The IoU values of M₂ are systematically greater than those of M₁.
Considering a significance level (α) of 0.05, the p-value of 0.0006 allowed for the rejection of the null hypothesis (H₀), providing statistical evidence that the IoU values of the model trained with data augmentation are superior. The median of the differences was positive (+0.0183), corroborating this conclusion. Additionally, in 71.9% of the images (41 out of 57), the model with data augmentation outperformed the model without augmentation, reinforcing the practical consistency of the observed advantage.
For the F1-Score, a similar procedure was adopted. The Shapiro–Wilk test also rejected the normality of the differences (p-value = 0.0002), again justifying the use of the non-parametric Wilcoxon test. The same hypothesis scheme was applied:
- H₀: The distributions of the F1-Score values of M₁ and M₂ are equal.
- H₁: The F1-Score values of M₂ are systematically greater than those of M₁.
The result, also considering a significance level (α) of 0.05, with a p-value = 0.0060, led to the rejection of the null hypothesis. The superiority of the model with data augmentation was also manifested in the difference of the F1-Score medians (+0.0122 points). Model M₂ outperformed M₁ in 66.67% of the images (38 out of 57), presenting inferior performance in only 33.33% of the cases (19 out of 57).
To visualize and understand the behavior of the predictions in identifying favelas in orthoimages, visual results are presented below referring to two samples from each of the four Planning Areas (AP): one example of successful prediction and another where performance was inferior. Each image is accompanied by its respective IoU and F1-Score metrics. To facilitate comparative analysis, the areas predicted as favelas were overlaid on the original images with transparency applied, allowing a clear view of the urban regions classified by the U-Net model while preserving the original form for direct comparison with the reference masks.
In image 08135, corresponding to Planning Area 1, a segment of the favela Parque Horácio Cardoso Franco is observed in the upper right corner, located in Benfica, on Rua Couto de Magalhães (Figure 16). Both models showed satisfactory performance in segmenting the area of interest; however, the model trained with data augmentation obtained superior results, reflected in higher IoU and F1-Score values. It is observed that the model without data augmentation erroneously classified a small region in the upper right corner of the image, while the errors of the model with data augmentation were more localized and restricted to the vicinity of the favela, indicating more precise and spatially coherent segmentation.
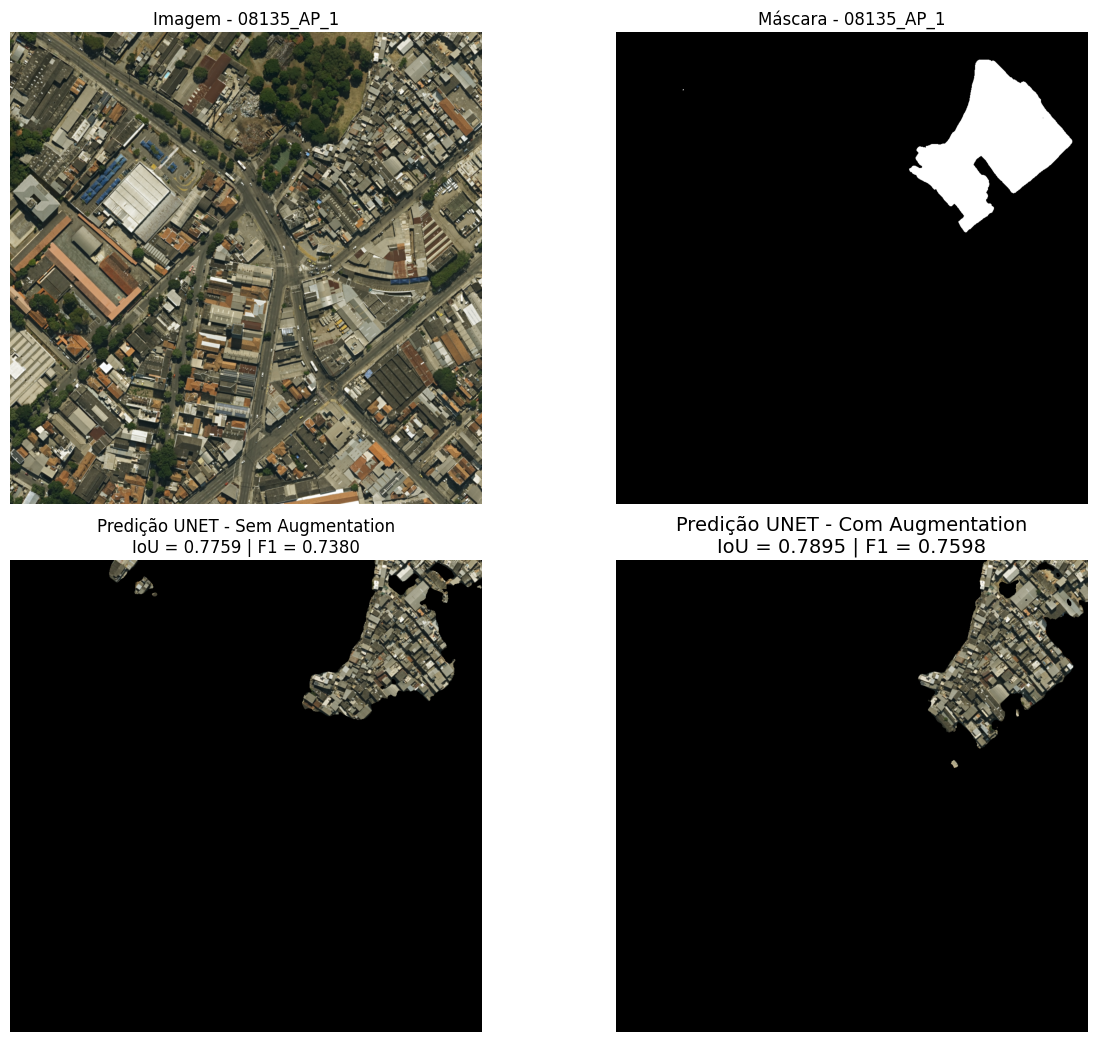
Figure 16: Visual comparison of predictions for image 08135 (Planning Area 1). From left to right: (a) original satellite image; (b) reference mask; (c) prediction of the model without data augmentation; (d) prediction of the model with data augmentation. The scene includes, in the upper right corner, a segment of the favela Parque Horácio Cardoso Franco, in Benfica (Rua Couto de Magalhães).
Source: Own elaboration
Image 08430, corresponding to Planning Area 1, contains, in its lower portion, a small favela recorded exclusively in the Instituto Pereira Passos database, located at the corner of Rua José Eugênio and Rua Francisco Eugênio, in the São Cristóvão neighborhood (Figure 17). Due to the reduced size of the area of interest, both models showed low overlap with the favela region, although with IoU values above 0.5. The model without data augmentation achieved superior performance in both IoU and F1-Score; however, it presented a significantly larger area erroneously classified as favela compared to the model trained with data augmentation, evidencing a trade-off between overall overlap and false positive control.
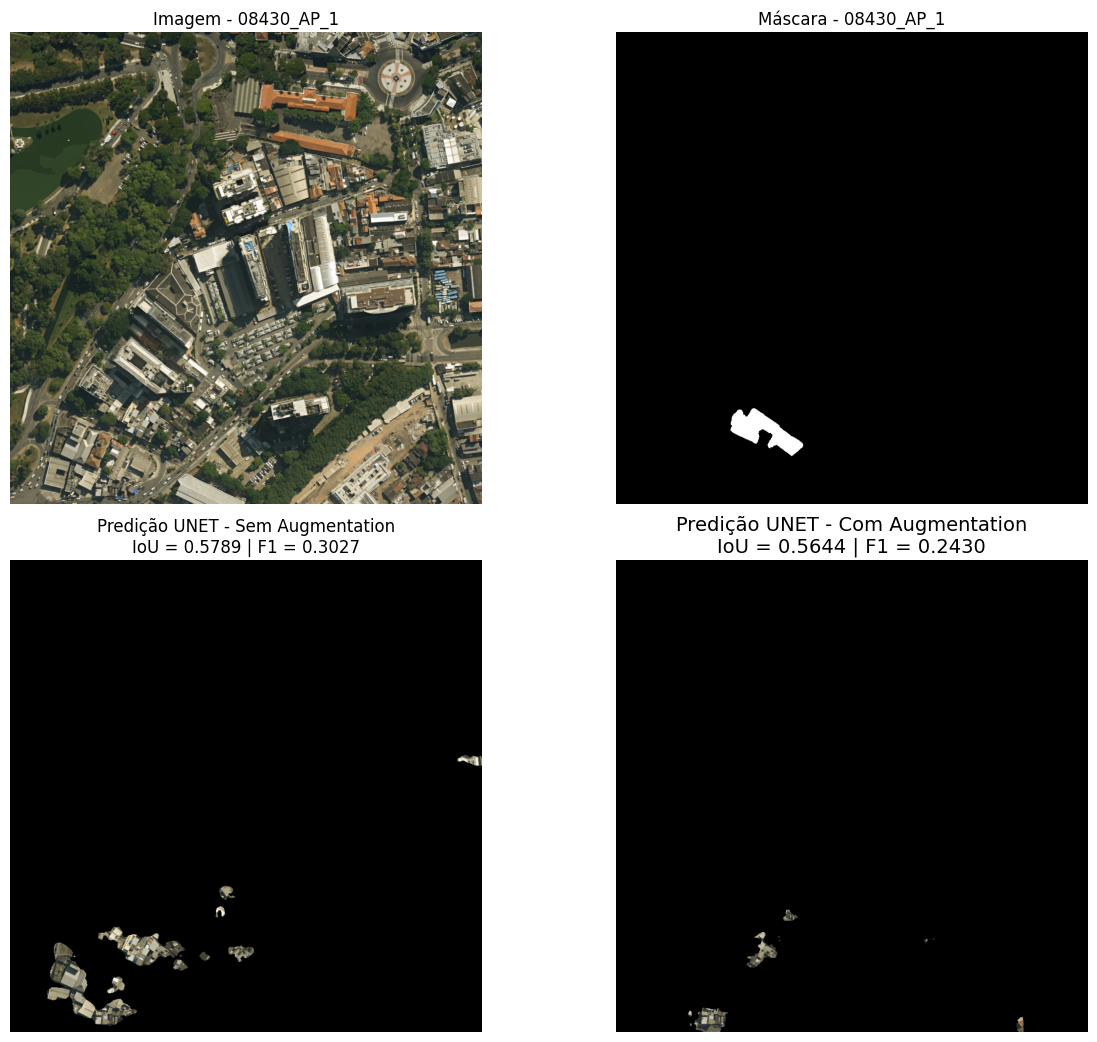
Figure 17: Visual comparison of predictions for image 08430 (Planning Area 1). From left to right: (a) original satellite image; (b) reference mask; (c) prediction of the model without data augmentation; (d) prediction of the model with data augmentation. The scene contains, in the lower portion, a small favela cataloged only by the Instituto Pereira Passos, situated at the corner of Rua José Eugênio and Rua Francisco Eugênio, in São Cristóvão.
Source: Own elaboration
In image 07848, referring to Planning Area 2, segments of Parque Vila Isabel are observed, separated in the scene by Parque Recanto do Trovador and Vila Olímpica Artur da Távola, in the Vila Isabel neighborhood, near the intersection of Rua Visconde de Santa Isabel and Rua Barão do Bom Retiro (Figure 18). Both models showed high performance, with IoU and F1-Score values above 0.9. Nevertheless, the model trained with data augmentation demonstrated slight superiority, by delineating the favela contours with greater precision and adequately discriminating internal elements that do not correspond to precarious dwellings. Note that small segments in the lower portion of the predictions of both models were erroneously classified as favela; these regions actually correspond to terrace areas in small residential buildings.
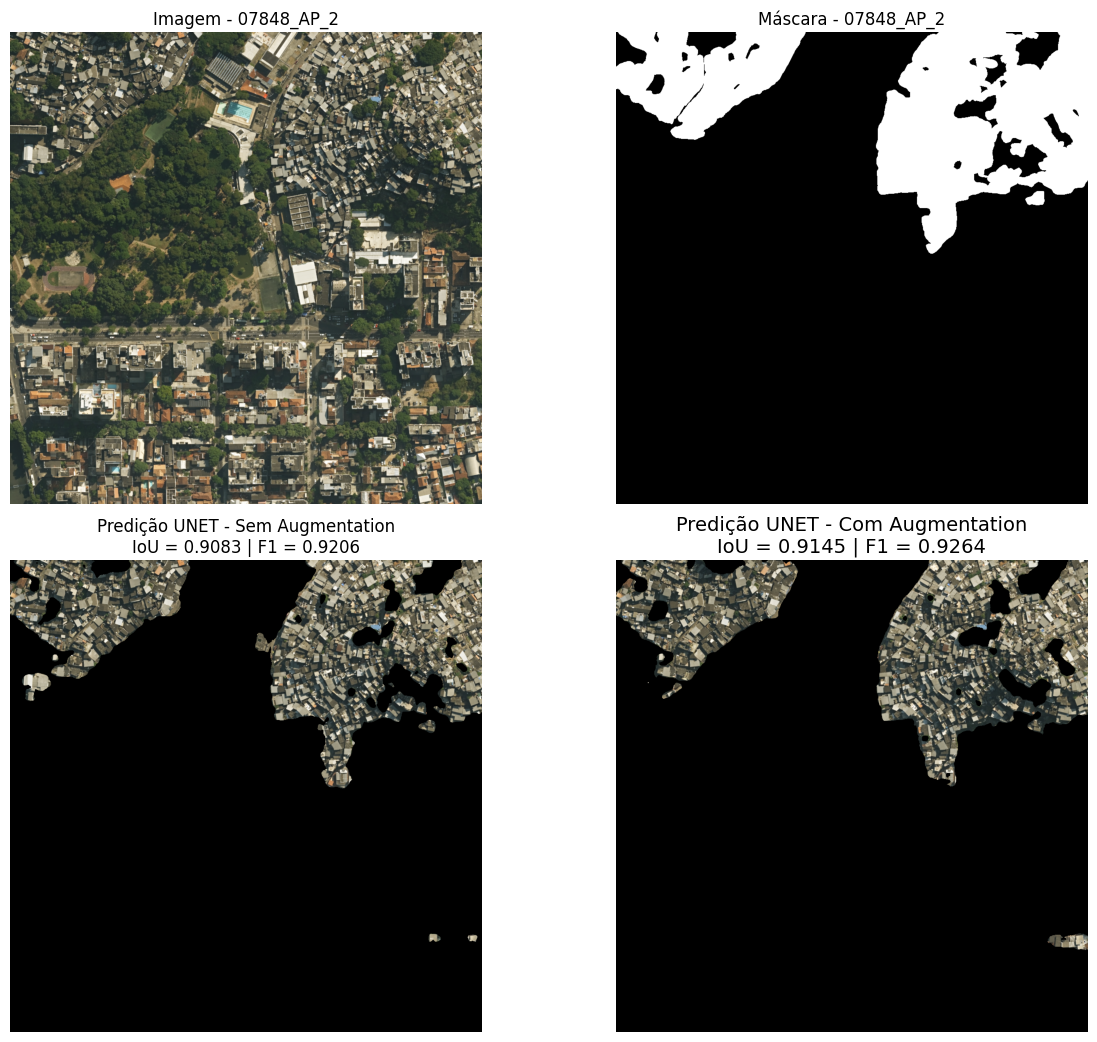
Figure 18: Visual comparison of predictions for image 07848 (Planning Area 2). From left to right: (a) original satellite image; (b) reference mask; (c) prediction of the model without data augmentation; (d) prediction of the model with data augmentation. The scene displays segments of Parque Vila Isabel, separated by Parque Recanto do Trovador and Vila Olímpica Artur da Távola, in the Vila Isabel neighborhood, near the intersection of Rua Visconde de Santa Isabel and Barão do Bom Retiro.
Source: Own elaboration
In image 08157, referring to Planning Area 2, the favela Vidigal is observed, located in the neighborhood of the same name, near Avenida Niemeyer (Figure 19). It is noted that both models erroneously classified an extensive area as favela, which does not correspond to the reference mask nor is it registered as such in the IPP or IBGE databases. This region presents a mixed pattern of occupation: although it contains constructions that clearly do not fit the favela classification, others have ambiguous visual characteristics that could raise questions. Additionally, the rugged terrain morphology, with a steep slope, contributes to a certain irregularity in the shapes of lots and buildings, which may have influenced the classification errors.
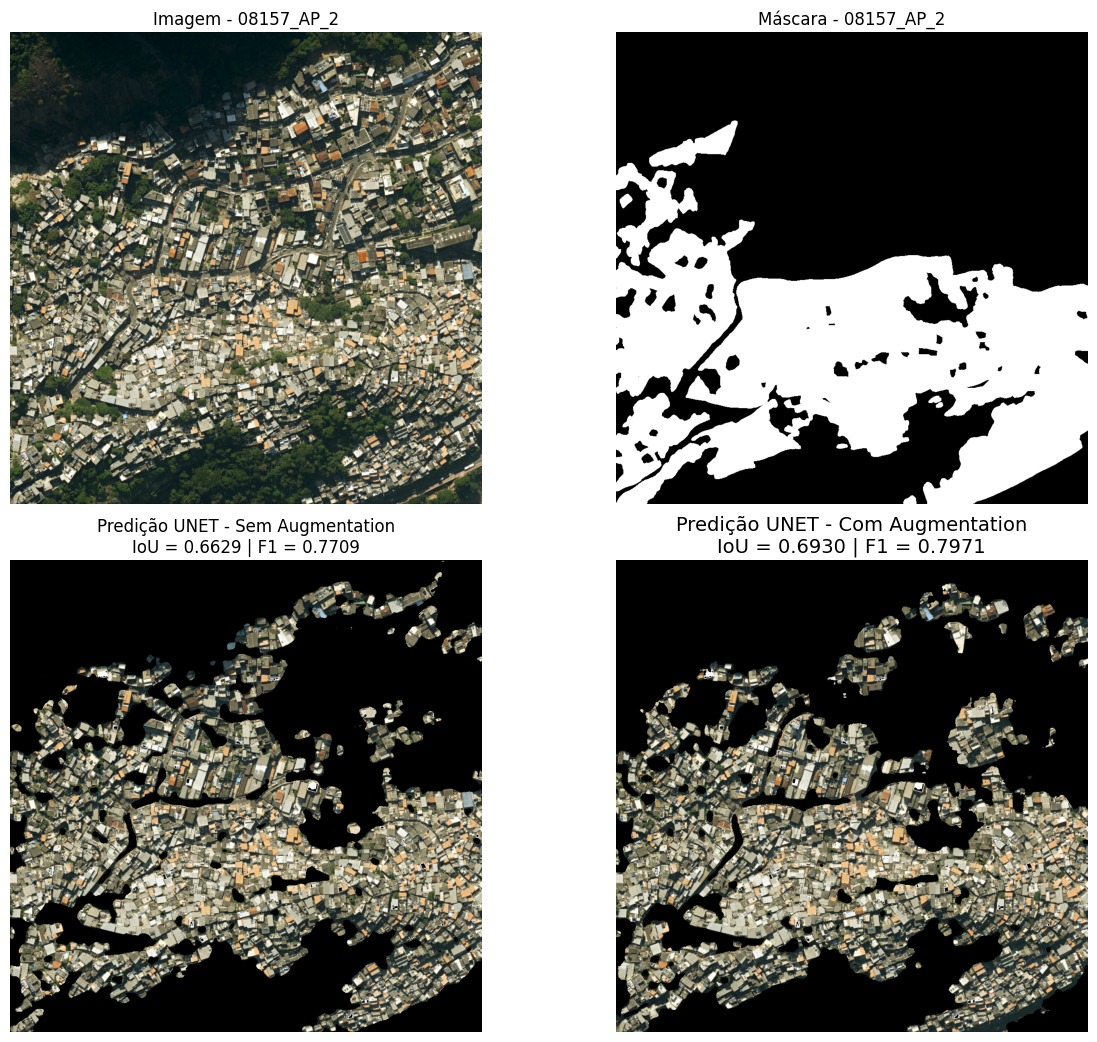
Figure 19: Visual comparison of predictions for image 08157 (Planning Area 2). From left to right: (a) original satellite image; (b) reference mask; (c) prediction of the model without data augmentation; (d) prediction of the model with data augmentation. The scene shows the favela Vidigal, in the homonymous neighborhood, near Avenida Niemeyer.
Source: Own elaboration
Image 07691 shows the favela Nova Brasília, located in the Complexo do Alemão in Planning Area 3, near the intersection of Estrada de Itararé and Avenida Itaóca (Figure 20). The prediction generated by the model with data augmentation showed superior performance, characterized by a lower occurrence of false positives (non-favela areas erroneously classified) compared to the model without data augmentation. The areas incorrectly segmented as favela by both models correspond, for the most part, to residential condominiums.
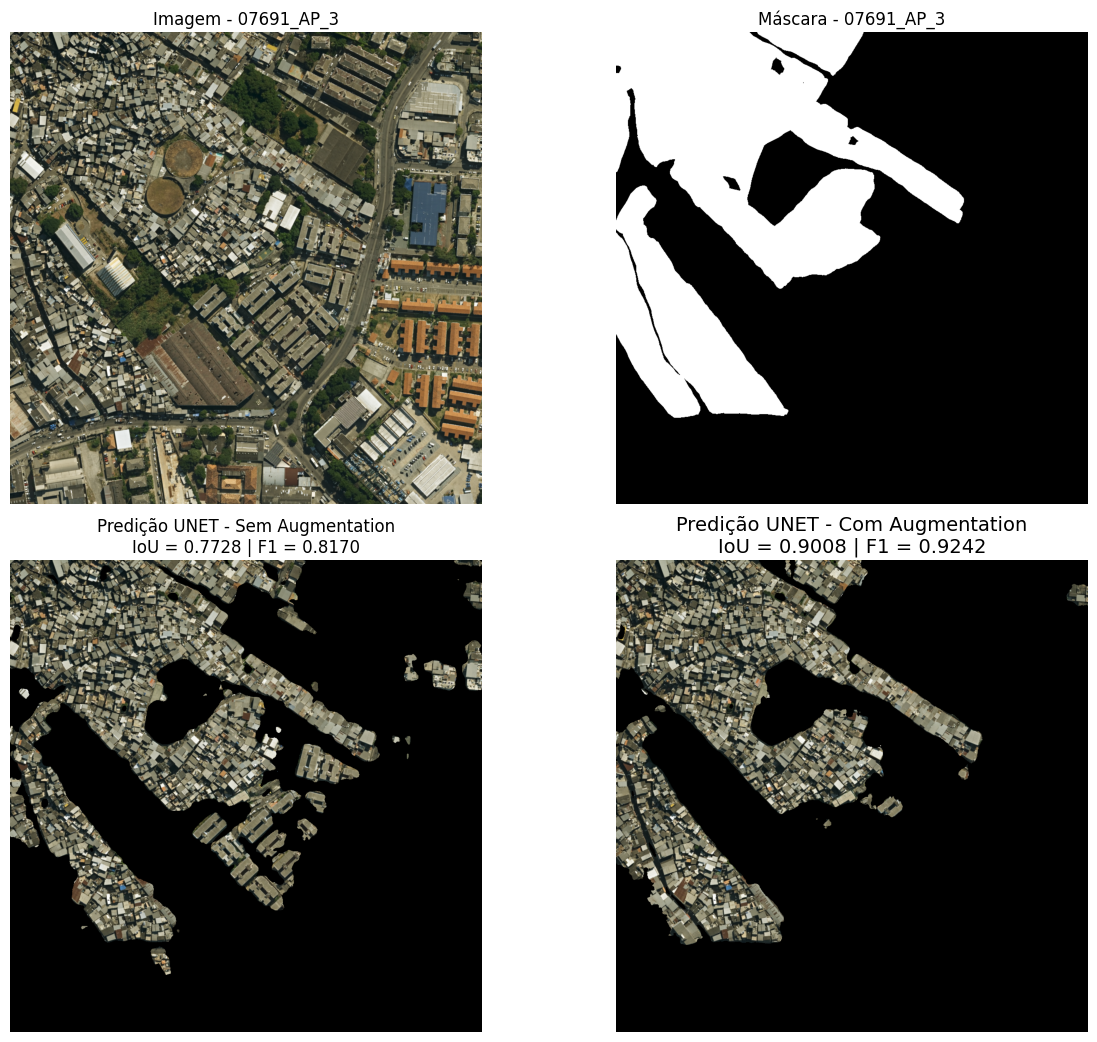
Figure 20: Visual comparison of predictions for image 07691 (Planning Area 3). From left to right: (a) original satellite image; (b) reference mask; (c) prediction of the model without data augmentation; (d) prediction of the model with data augmentation. The scene displays the favela Nova Brasília, in the Complexo do Alemão, near the meeting of Estrada de Itararé and Avenida Itaóca.
Source: Own elaboration
Image 07170, from Planning Area 3, displays the small favela Castelo de Lucas, recorded only in the IPP database and located in the Parada de Lucas neighborhood, at the meeting of Rua Cordovil and Rua Amadeu Amaral (Figure 21). In such a reduced area, both models had low overlap with IoU below 0.5. The model without data augmentation still managed some overlap with the favela area, evidenced by an F1-Score of 0.0006; however, it erroneously classified various areas as favela. The model with data augmentation erroneously classified a smaller area as favela but had an F1-Score of zero.
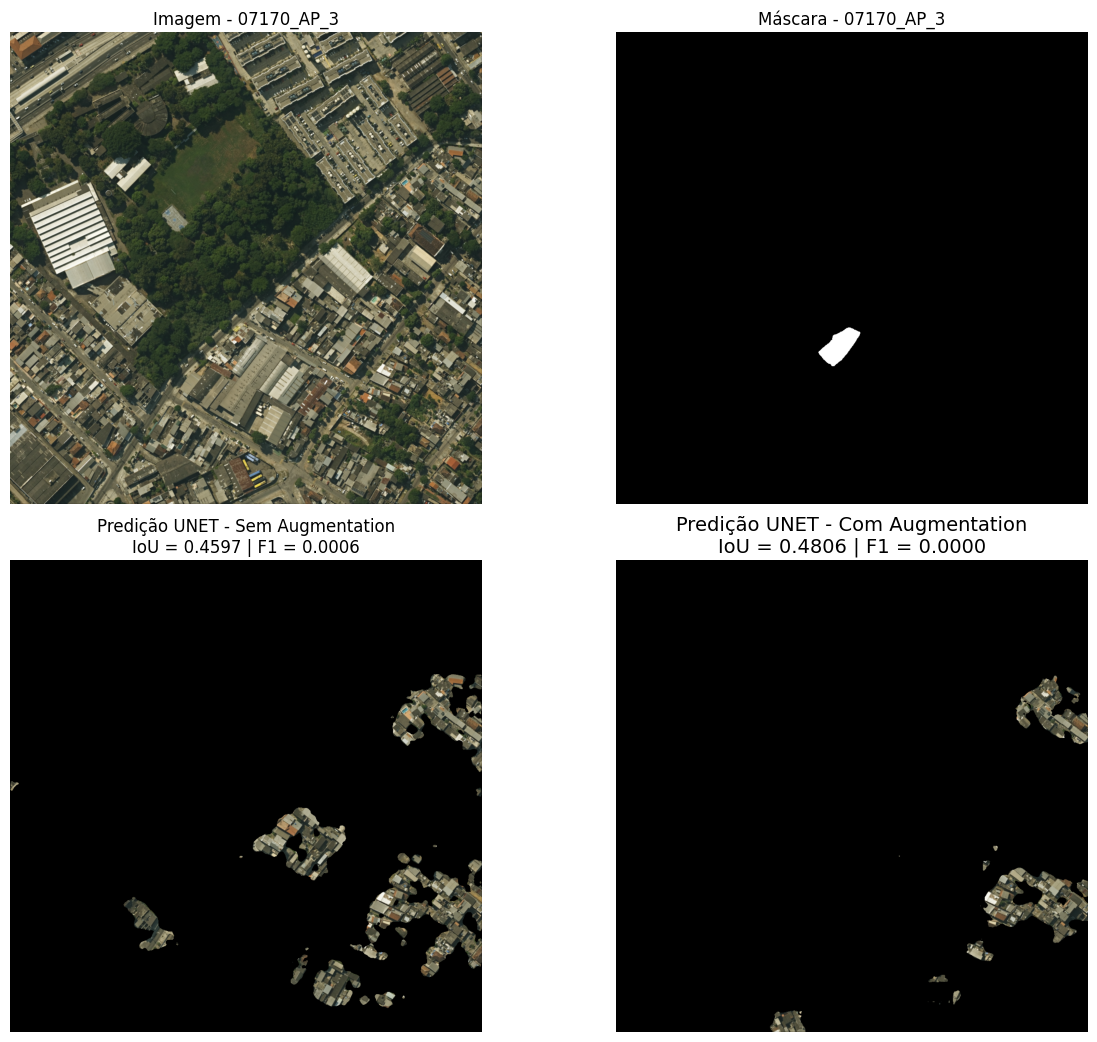
Figure 21: Visual comparison of predictions for image 07170 (Planning Area 3). From left to right: (a) original satellite image; (b) reference mask; (c) prediction of the model without data augmentation; (d) prediction of the model with data augmentation. The scene shows the small favela Castelo de Lucas, recorded exclusively by the IPP, situated in the Parada de Lucas neighborhood, at the confluence of Rua Cordovil and Amadeu Amaral.
Source: Own elaboration
Image 05804, from Planning Area 4, shows the favela Comunidade Corumau, located in the Taquara neighborhood, opposite Estrada Curumau (Figure 22). Both models achieved high values of IoU and F1-Score; however, the model trained with data augmentation showed superior performance. From a qualitative point of view, it is observed that this model delineated the favela contours with greater fidelity and generated a smaller amount of false positives — that is, areas not belonging to the favela incorrectly classified — when compared to the model without data augmentation. The main regions erroneously segmented correspond to terraces of townhouses and small residential buildings, whose spectral and textural characteristics may resemble those of favela areas in satellite images, making distinction difficult for both models.
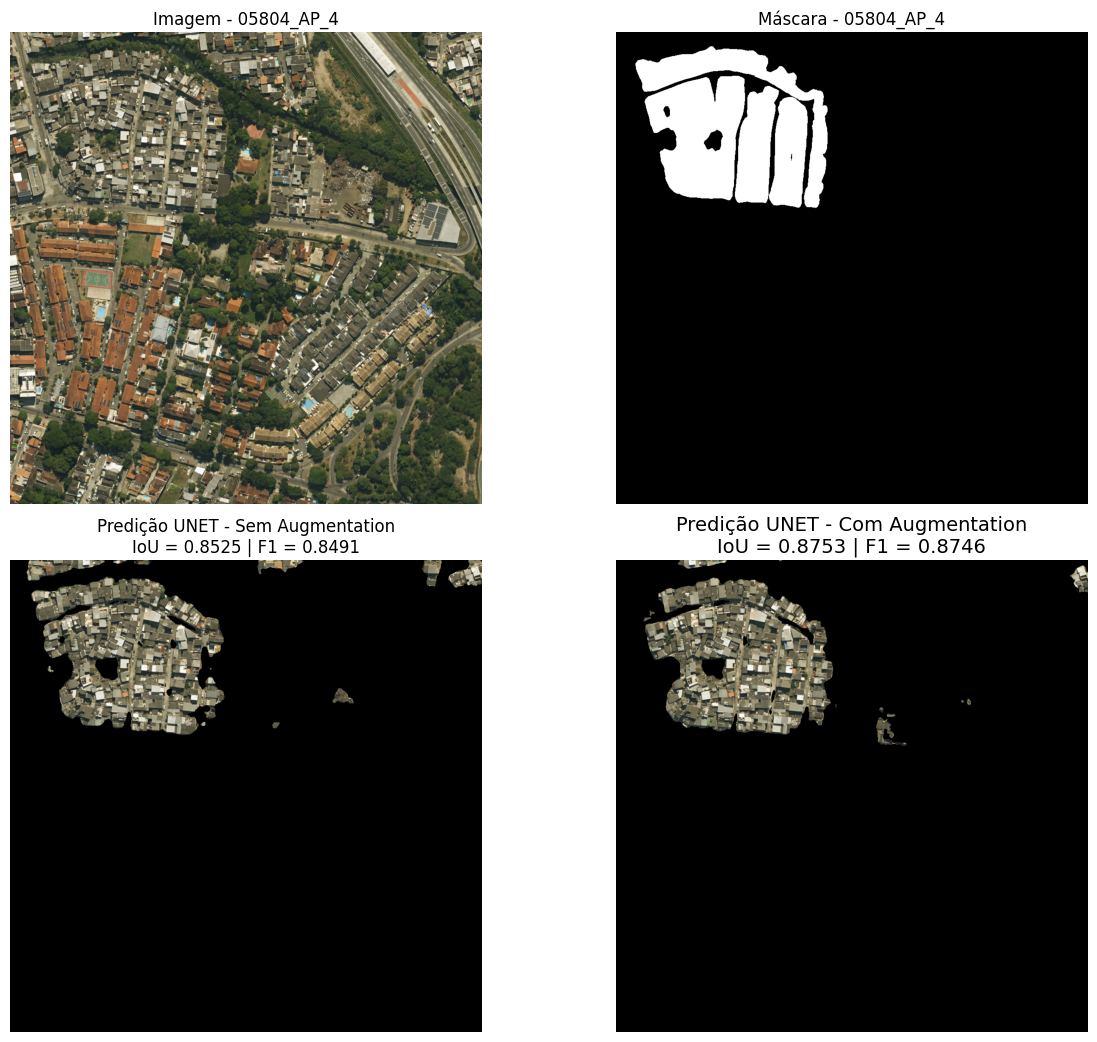
Figure 22: Visual comparison of predictions for image 05804 (Planning Area 4). From left to right: (a) original satellite image; (b) reference mask; (c) prediction of the model without data augmentation; (d) prediction of the model with data augmentation. The scene displays the favela Comunidade Corumau, in Taquara, opposite Estrada Curumau.
Source: Own elaboration
Image 05729, from Planning Area 4, shows a small residential agglomerate classified as a favela only in the IPP database, situated opposite Estrada da Boiúna, in the Taquara neighborhood, in the lower left corner of the scene (Figure 23). Both models managed to partially identify this set of buildings, correctly attributing the favela class to it. However, false positives were also observed in other regions that are not registered as favelas in the reference mask nor in official databases. The area segmented in the upper left corner of the image, near Rua Pereira, presents ambiguous morphological and spectral characteristics, which may justify the classification divergence and raise questions regarding its real categorization. On the other hand, the buildings identified in the lower right corner only by the model without data augmentation correspond, in reality, to a small condominium located on Estrada Curumau, near the Túnel Senador Nelson Carneiro, constituting an unequivocal classification error.
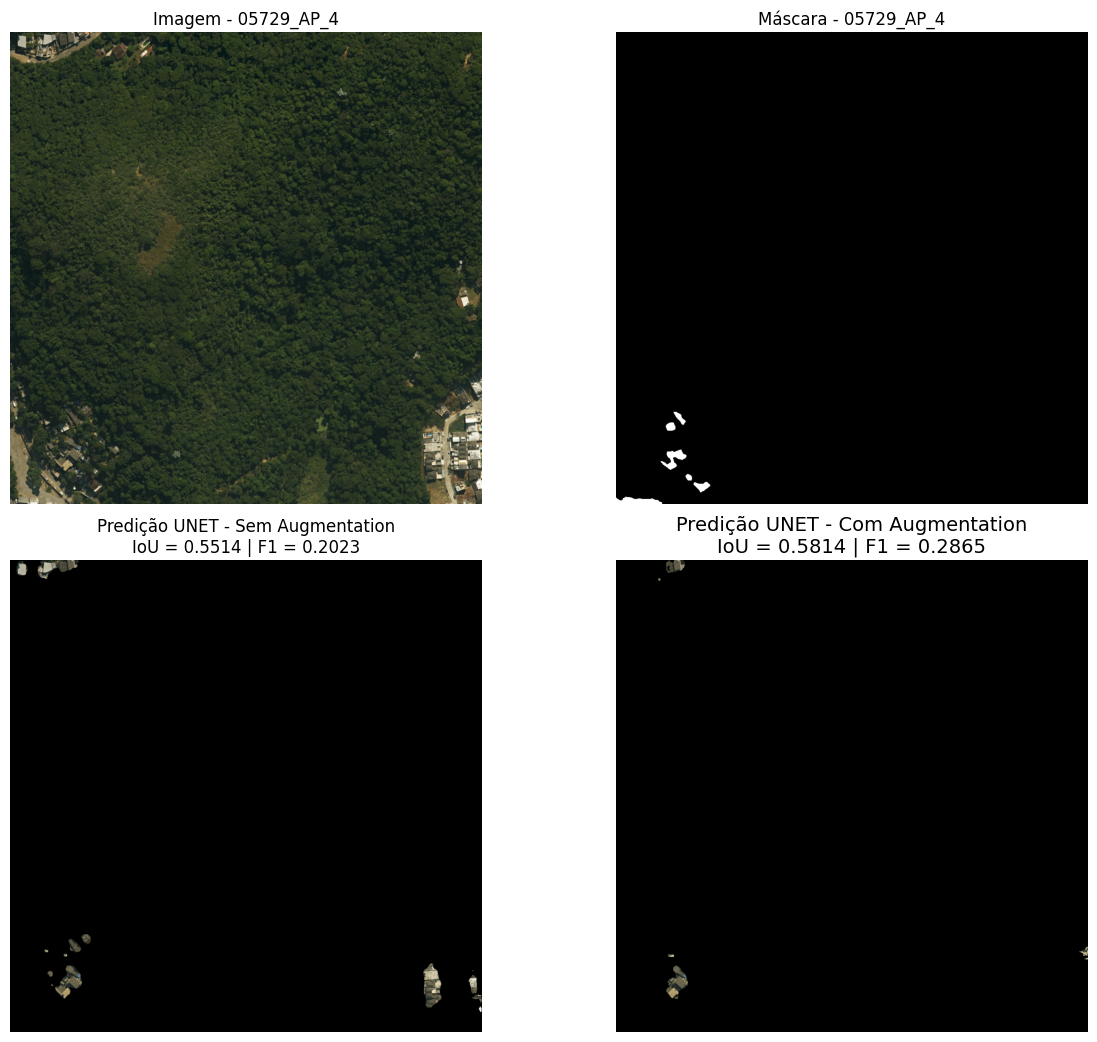
Figure 23: Visual comparison of predictions for image 05729 (Planning Area 4). From left to right: (a) original satellite image; (b) reference mask; (c) prediction of the model without data augmentation; (d) prediction of the model with data augmentation. The scene displays, in the lower left corner, a small residential agglomerate cataloged as a favela only by the IPP, opposite Estrada da Boiúna, in Taquara.
Source: Own elaboration
Final Considerations
The obtained results confirm the promising performance of the U-Net architecture for identifying favelas in orthoimages. Overall, the model trained with data augmentation showed superior performance in the metrics of IoU, F1-Score, and Precision, indicating higher quality in the overlap of segmented areas, a better balance between classification errors, and greater control over the occurrence of false positives. In contrast, this model recorded slightly lower Recall values compared to the model trained without data augmentation, evidencing a more conservative behavior in identifying areas of interest.
This result reflects the classic trade-off between Precision and Recall, where data augmentation contributes to making the model more selective, reducing incorrect classifications (false positives), albeit at the cost of losing some true detections. This characteristic can be interpreted as desirable in applications where reducing false positives is a priority, such as in urban analyses and territorial planning. Furthermore, quantitative and qualitative analyses indicate that the use of data augmentation favors more stable and spatially coherent segmentation, especially in areas with greater morphological heterogeneity, reinforcing its relevance as a strategy to increase the model's generalization capacity.
Despite the observed advances, relevant challenges still persist. The model trained with data augmentation, although presenting higher precision, demonstrates a more conservative tendency in identifying favela areas, reducing the occurrence of false positives but, in some cases, failing to detect legitimate areas, especially those of small size or inserted in complex visual contexts. On the other hand, the model trained without data augmentation, by presenting higher Recall, proved more sensitive to detecting these areas, but with a greater propensity to erroneously classify regions that do not correspond to this type of occupation.
In both cases, recurring errors were associated with areas that present visual characteristics similar to those of favelas, such as residential terraces, small condominiums, and degraded urban zones. Furthermore, the identification of small, fragmented favelas, segmented by the cutting grid or inserted in low-contrast visual environments, proved particularly challenging, highlighting limitations in distinguishing these areas due to the ambiguity of their spectral and spatial characteristics.
To overcome these limitations and improve the model, the following directions for future work are suggested:
- Incorporation of additional spectral bands, such as Near Infrared (NIR) and Short-Wave Infrared (SWIR), which can capture information about vegetation vigor, moisture, and construction materials, aiding in the distinction between favelas and other urban typologies.
- Refinement of the class scheme, with the subdivision of the broad "non-favela" category into semantically distinct classes. The creation of specific categories for urban typologies frequently confused — such as formal residential complexes, commercial buildings, industrial warehouses, and terrace roofs — would allow the model to learn more discriminative representations. This greater granularity in defining the learning objective has the potential to significantly reduce false positives, providing a more stratified and contextual understanding of the urban fabric.
- Evaluation of more advanced neural network architectures, such as HRNet, transformers for computer vision (e.g., SegFormer, Mask2Former), and Self-Supervised Learning (SSL) methods, which can improve the representation capacity of spatial and textural features, especially in scenarios with limited annotated data.
- Exploration of post-processing strategies for mask refinement, such as edge smoothing techniques, segmentation fusion, and geometry-based methods, aiming to correct spatial incoherences and reduce noise in predictions.
- Integration of contextual and socioeconomic data at the census tract level, which can offer additional insights for differentiating low-income urban areas with similar morphologies.
- Collaborative review of the annotation process, involving multiple experts in the generation of reference masks. Since the interpretation of visual characteristics that define a favela is not always consensual, the consolidation of annotations through union or intersection operations can produce more consistent and robust reference masks. This approach allows capturing both a more comprehensive definition (union) and a more conservative one (intersection) of the phenomenon, reducing individual subjective biases and creating training bases that improve the model's generalization capacity for different interpretive contexts.
- Expansion and diversification of data augmentation techniques, using libraries like Albumentations to introduce more complex and stochastic transformations, increasing the variability of the training set and the model's robustness to different image conditions.
The implementation of these proposals has the potential to significantly elevate the accuracy, reliability, and applicability of semantic segmentation models in mapping precarious settlements, contributing to more assertive and evidence-based urban policies.
References
ABASCAL, A. et al. Identifying degrees of deprivation from space using deep learning and morphological spatial analysis of deprived urban areas. Journal of Environmental Management, v. 95. 2022. Available at: https://www.sciencedirect.com/science/article/pii/S0198971522000643. Accessed on: 12 dec. 2023.
ALRASHEEDI, K.; DEWAN, A.; EL-MOWAFY, A. Using local knowledge and remote sensing in the identification of informal settlements in riyadh city, Saudi Arabia. Remote Sensing, v. 15, n. 15, p. 3895, 2021. Available at: https://www.mdpi.com/2072-4292/15/15/3895. Accessed on: 25 sep. 2023.
BUSLAEV, A. et al. Albumentations: fast and flexible image augmentations. arXiv preprint arXiv: 1809.06839. 2018. Available at: https://arxiv.org/pdf/1809.06839. Accessed on: 16 jan. 2024.
CINNAMON, J.; NOTH, T. Spatiotemporal development of informal settlements in cape town, 2000 to 2020: An open data approach. Habitat International, v. 112, 2023. Available at: https://www.sciencedirect.com/science/article/pii/S0197397523000139. Accessed on: 11 apr. 2024.
DATA.RIO. Limite Favelas 2019. 2019. Available at: https://www.data.rio/datasets/limite-favelas-2019/explore. Accessed on: 20 dec. 2023.
DATA.RIO. Limite Áreas de Planejamento (AP). 2023. Available at: https://www.data.rio/datasets/b9e30861acfe4bea947e6278a6b30ce3_1/explore. Accessed on: 20 dec. 2023.
DONG, Shiwei. Spatial Stratification Method for the Sampling Design of LULC Classification Accuracy Assessment: A Case Study in Beijing, China. Remote Sensing, v. 14, n. 4, 2022. Available at: https://www.mdpi.com/2072-4292/14/4/865. Accessed on: 03 feb. 2024.
GHAFFARIAN, S.; EMTEHANI, S. Monitoring urban deprived areas with remote sensing and machine learning in case of disaster recovery. Urban Science, v. 9, n. 4, 2021. Available at: https://www.mdpi.com/2225-1154/9/4/58. Accessed on: 12 dec. 2023.
IBGE. Aglomerados Subnormais 2019: Classificação preliminar e informações de saúde para o enfrentamento à COVID-19. 2020. Available at: https://biblioteca.ibge.gov.br/visualizacao/livros/liv101717_notas_tecnicas.pdf. Accessed on: 06 dec. 2023.
IBGE. Favelas e Comunidades Urbanas: IBGE muda denominação dos aglomerados subnormais. 2024. Available at: https://agenciadenoticias.ibge.gov.br/agencia-noticias/2012-agencia-de-noticias/noticias/38962-favelas-e-comunidades-urbanas-ibge-muda-denominacao-dos-aglomerados-subnormais. Accessed on: 05 nov. 2025.
KEMPER, T. et al. Towards an automated monitoring of human settlements in south africa using high resolution spot satellite imagery. International Society for Photogrammetry and Remote Sensing. v. XL-7/W3, [S.n.], 2015. Available at: https://core.ac.uk/download/pdf/38631179.pdf. Accessed on: 4 mar. 2024
LAKSHMANAN, Valliappa; GÖRNER, Martin; GILLARD, Ryan. Practical machine learning for computer vision. " O'Reilly Media, Inc.", 2021.
LING, Antony. Cortiços eram melhores que as favelas. Caos Planejado, 2018. Available at: https://caosplanejado.com/corticos-eram-melhores-que-favelas/. Accessed on: 23 dec. 2023.
LU, W. et al. A Geoscience-Aware Network (GASlumNet) Combining UNet and ConvNeXt for Slum Mapping. Remote Sensing, v. 16, n. 2, p. 260, 2021. Available at: https://www.mdpi.com/2072-4292/16/2/260. Accessed on: 14 may 2024.
MAIYA, S. R.; BABU, S. C. Slum segmentation and change detection: A deep learning approach. arXiv preprint arXiv: 1811.07896. 2018. Available at: https://arxiv.org/pdf/1811.07896. Accessed on: 13 mar. 2024.
MARINS, Paulo. História da Vida Privada no Brasil: Habitação e Vizinhança: Limites da Privacidade no Surgimento das Metrópoles Brasileiras. 3. ed. São Paulo: Companhia Das Letras, 1998. P. 86.
OLIVEIRA, L. T. et al. Capturing deprived areas using unsupervised machine learning and open data: a case study in São Paulo, Brazil. European Journal of Remote Sensing, 2023. Available at: https://www.tandfonline.com/doi/full/10.1080/22797254.2023.2214690. Accessed on: 5 mar. 2024.
UN BRASIL. ONU-Habitat: população mundial será 68% urbana até 2050. NAÇÕES UNIDAS BRASIL. 2022. Available at: https://brasil.un.org/pt-br/188520-onu-habitat-popula%C3%A7%C3%A3o-mundial-ser%C3%A1-68-urbana-at%C3%A9-2050. Accessed on: 17 sep. 2023.
UN BRASIL. Os objetivos de desenvolvimento sustentável no Brasil. NAÇÕES UNIDAS BRASIL. 2023. Available at: https://brasil.un.org/pt-br/sdgs/11. Accessed on: 17 sep. 2023.
PREFEITURA DA CIDADE DO RIO DE JANEIRO. Conselho Estratégico de Informações da Cidade: Atas de Reuniões. 2012. Available at: https://www.rio.rj.gov.br/documents/91329/1f8a19d9-91d6-430d-81f4-52081055114e. Accessed on: 13 nov. 2025.
PREFEITURA DA CIDADE DO RIO DE JANEIRO. Painel Rio: Conheça mais o rio de hoje para construir o rio de amanhã. 2025. Available at: https://pds-pcrj.hub.arcgis.com/pages/unidades. Accessed on: 12 nov. 2025.
PROVOST, Foster; FAWCETT, Tom. Data Science para Negócios: O que você precisa saber sobre mineração de dados e pensamento analítico de dados. Rio de Janeiro: Alta Books, 2016.
RONNEBERGER, Olaf; FISCHER, Philipp; BROX, Thomas. U-Net: Convolutional Networks for Biomedical Image Segmentation. arXiv preprint arXiv: 1505.04597, 2015. Available at: https://arxiv.org/pdf/1505.04597. Accessed on: 16 jan. 2024.
SILVA, Pedro; BIANCHINI, Zélia; DIAS, Antonio. Amostragem: Teoria e Prática Usando R. Rio de Janeiro: [S.n.], 2023. Available at: https://amostragemcomr.github.io/livro/index.html. Accessed on: 2 feb. 2026.
USGS (United States Geological Survey). The Universal Transverse Mercator (UTM) Grid. [S.l.: s.n.], 2001. P. 2. Documento online. Available at: https://pubs.usgs.gov/fs/2001/0077/report.pdf. Accessed on: 10 jan. 2024.
WURM, M. et al. Semantic segmentation of slums in satellite images using transfer learning on fully convolutional neural networks. ISPRS Journal of Photogrammetry and Remote Sensing, v. 150, 2019. Available at: https://www.sciencedirect.com/science/article/pii/S0924271619300383. Accessed on: 11 dec. 2023
About the Authors
Jedielso Sales de Souza holds a degree in Statistics from the Escola Nacional de Ciências Estatísticas (ENCE). He works at the Brazilian Institute of Geography and Statistics (IBGE) as the Head of the Central Agency of the Rio de Janeiro State Superintendence, being responsible for managing and training teams involved in the collection of various statistical surveys. In the 2022 Demographic Census, he served as an area coordinator in the central region of the city of Rio de Janeiro, where he gained experience in mapping favelas and urban communities. His work integrates interests in statistics, spatial data analysis, and studies on favelas.
Andrea Diniz da Silva is a professor and researcher in the undergraduate and graduate programs of the Escola Nacional de Ciências Estatísticas - ENCE/IBGE; leader of the research group "Big Data e Estatísticas Públicas" (Big Data and Public Statistics); researcher in the groups "DHPJS - Direitos Humanos, Poder Judiciário e Sociedade" (Human Rights, Judiciary, and Society) and "CAST - Computational Agriculture Statistics Laboratory". She holds a Bachelor's degree in statistics from the Universidade do Estado do Rio de Janeiro (UERJ), a Master's in Population Studies and Social Research, and a Ph.D. in Population, Territory, and Public Statistics, both from ENCE. She completed a sandwich Ph.D. program at the University of Wollongong, Australia. She works with survey methods and the use of big data for the production of public statistics. She holds the position of Head of International Relations and Coordinator of the Working Group on Innovation Policy at the IBGE.
Ian Monteiro Nunes is a Computer Engineer with a Master's and Ph.D. in Data Science from the Department of Informatics at PUC-Rio. He is currently the Head of the Data Intelligence and Innovation Management Office at the IBGE, a pioneering area focused on R&D and modernization of the Agricultural Census, and a Data Science professor at the Escola Nacional de Ciências Estatísticas (ENCE). His work includes coordinating the R&D project "Representation Learning for Crop Segmentation in Brazil" at LNCC and participating in the Big Data and Official Statistics research group. With solid experience at the intersection of academia and public management, Ian leads digital transformation initiatives using Computer Vision, Remote Sensing, and Machine Learning. His research areas encompass image segmentation, deep learning, domain adaptation, and open-set recognition.
Author Contributions
Conceptualization, [J.S.S]; methodology, [J.S.S., A.D.S., I.M.N]; software, [J.S.S]; validation, [J.S.S]; formal analysis, [J.S.S]; investigation, [J.S.S]; resources, [J.S.S]; data curation, [J.S.S]; writing—original draft preparation, [J.S.S]; writing—review and editing, [J.S.S., A.D.S., I.M.N]; visualization, [J.S.S]; supervision, [A.D.S., I.M.N]. All authors have read and agreed to the published version of the manuscript.
Data Availability
The data for this research are available at: https://drive.google.com/drive/folders/10j4KrWzsuuQuK8yODZRRhCscWvNig17J?usp=sharing
Conflicts of Interest
The authors declare no conflicts of interest.
About Coleção Estudos Cariocas
Coleção Estudos Cariocas (ISSN 1984-7203) is a publication dedicated to studies and research on the Municipality of Rio de Janeiro, affiliated with the Pereira Passos Institute (IPP) of the Rio de Janeiro City Hall.
Its objective is to disseminate technical and scientific production on topics related to the city of Rio de Janeiro, as well as its metropolitan connections and its role in regional, national, and international contexts. The collection is open to all researchers (whether municipal employees or not) and covers a wide range of fields — provided they partially or fully address the spatial scope of the city of Rio de Janeiro.
Articles must also align with the Institute’s objectives, which are:
- to promote and coordinate public intervention in the city’s urban space;
- to provide and integrate the activities of the city’s geographic, cartographic, monographic, and statistical information systems;
- to support the establishment of basic guidelines for the city’s socioeconomic development.
Special emphasis will be given to the articulation of the articles with the city's economic development proposal. Thus, it is expected that the multidisciplinary articles submitted to the journal will address the urban development needs of Rio de Janeiro.