
Volume 13 Issue 4 *Corresponding author mataugusto1999@gmail.com Submitted 20 Nov 2025 Accepted 07 Jan 2026 Published 28 Jan 2026 Citation SOUZA, M. A.; FERRAZ, D. P. G. B. Mapping vegetation loss due to urbanization in Barra da Tijuca (1984–2024) using the LandTrendr algorithm and Landsat time series. Coleção Estudos Cariocas, v. 13, n. 4, 2026.
DOI: 10.71256/19847203.13.4.196.2025 The article was originally submitted in PORTUGUESE. Translations into other languages were reviewed and validated by the authors and the editorial team. Nevertheless, for the most accurate representation of the subject matter, readers are encouraged to consult the article in its original language.


| Mapping vegetation loss due to urbanization in Barra da Tijuca (1984–2024) using the LandTrendr algorithm and Landsat time series Mapeamento da perda de vegetação por urbanização na Barra da Tijuca (1984-2024) com o algoritmo LandTrendr e séries temporais Landsat Mapeo de la pérdida de vegetación por urbanización en Barra da Tijuca (1984–2024) con el algoritmo LandTrendr y series temporales Landsat Matheus Augusto de Souza1* and Debora da Paz Gomes Brandão Ferraz2 1Universidade Federal do Rio de Janeiro, Av. Athos da Silveira Ramos, 274, Cidade Universitária, Rio de Janeiro/RJ, CEP: 21941-916, ORCID: 0009-0009-9759-6691, mataugusto1999@gmail.com 2Universidade do Estado do Rio de Janeiro - Instituto de Geografia Cabo Frio, Rua Arízio Gomes da Costa, 186, Jardim Flamboyant, Cabo Frio/RJ, CEP 28905-320, ORCID: 0000-0003-2826-1715, debora.ferraz93@gmail.com
AbstractDetecting changes in natural areas is essential for their preservation. This study evaluated deforestation associated with urbanization in Barra da Tijuca (Rio de Janeiro), using the LandTrendr algorithm on a time series of Landsat images (1985-2024). The method achieved high precision, with an overall accuracy of 0.92, an F1-score of 0.91, and a Kappa of 0.83. The results indicated that the period of greatest change occurred between 1985 and 1990, with 22.5 km² altered, a value three times higher than the period of 2010-2015 (7.4 km²). These transformations are associated with intense real estate expansion and urban development. Keywords: change detection, remote sensing, NDVI, Google Earth Engine
ResumoA detecção de mudanças em áreas naturais é essencial para sua preservação. Este estudo avaliou o desflorestamento associado à urbanização na Barra da Tijuca (RJ), utilizando o algoritmo LandTrendr em séries temporais de imagens Landsat (1985 - 2024). O método alcançou alta precisão, com acurácia global de 0,92, F1-score de 0,91 e Kappa de 0,83. Os resultados indicaram que o período de maior mudança ocorreu entre 1985 e 1990, com 22,5 km² alterados, valor três vezes superior ao período de 2010-2015 (7,4 km²). Estas transformações estão associadas à intensa expansão imobiliária e ao desenvolvimento urbano. Palavras-chave: detecção de mudanças, sensoriamento remoto, NDVI, Google Earth Engine
Resumen Detectar los cambios en las áreas naturales es esencial para su conservación. Este estudio evaluó la deforestación asociada a la urbanización en Barra da Tijuca (Río de Janeiro), utilizando el algoritmo LandTrendr en series temporales de imágenes Landsat (1985-2024). El método alcanzó una alta precisión, con una exactitud global de 0,92, una puntuación F1 de 0,91 y un índice Kappa de 0,83. Los resultados indicaron que el periodo de mayor cambio se produjo entre 1985 y 1990, con 22,5 km² alterados, un valor tres veces superior al del periodo 2010-2015 (7,4 km²). Estas transformaciones están asociadas a la intensa expansión inmobiliaria y al desarrollo urbano. Palabras clave: detección de cambios, teledetección, NDVI, Google Earth Engine |
Introduction
The Administrative Region XXIV – Barra da Tijuca, Rio de Janeiro (RJ), is characterized by its high population density and intense urbanization. The development of this region intensified in the 1970s, driven by Lúcio Costa’s Pilot Plan (1969), which aimed to transform it into a major urban center. The project encouraged the construction of large condominiums and the separation of urban sectors, as highlighted by Mendonça (2023). According to Abreu (2006), the combination of these characteristics attracted real estate developments and consolidated Barra da Tijuca as a highly valued area and a reference for high-income populations, reaching, in 2010, the third highest Municipal Human Development Index (HDI-M) in the city.
Despite the accelerated development, monitoring of the region is essential, given the presence of important Conservation Units and Environmental Protection Areas (APA), such as Pedra Branca State Park, Pedra Branca APA, and Tijuca National Park, which harbor remnants of the Atlantic Forest, including ombrophilous forests, restingas, and mangroves. This biome is considered a global priority for biodiversity conservation, as described by Mazzurana (2016). However, evidence indicates increasing pressure on these protected areas. Sousa (2019) discusses the environmental impacts resulting from deforestation and irregular occupations, both by low-income populations and by high-end developments.
The dynamics of irregular occupation are exacerbated by the actions of criminal groups, such as militias, in promoting illegal constructions and money laundering, facts corroborated by local news reports such as that by Peixoto and Nascimento (2023). Sousa (2019) highlights that the actions of these groups often respond to signals from the real estate market more quickly than the public authorities. These interventions, combined with the expansion of peripheral communities on slopes and formal real estate development, result in vegetation suppression and geological risks. Additionally, the irregular disposal of waste impacts the ecological integrity of mangroves, despite the natural resilience of this ecosystem, as highlighted by Soffiati (2024).
In view of this socio-environmental challenge, it is essential to understand the dynamics of this expansion quantitatively in order to support territorial management (Tahir et al., 2025). The analysis of time series of remote sensing imagery is a robust tool for observing various phenomena that alter land use and land cover, whether due to environmental dynamics or human interventions, such as deforestation and urbanization (Zhu; Woodcock, 2014; Gómez et al., 2016). This analysis allows for a greater understanding of the phenomena, factors, and impacts of these changes. For the analysis of large volumes of remote sensing data (Big EO Data), the three-dimensional array model is the most appropriate and allows temporal classification in two ways: by classifying each time series individually and then merging the results in space (an approach that follows the Time-First paradigm, prioritizing time and then space); or by classifying each image separately and then comparing the resulting classifications over time (an approach that follows the Space-First paradigm, prioritizing space and then time) (Vinhas et al., 2016). According to Maus et al. (2016), a time series analysis can combine both temporal classifications, which was corroborated by Vinhas et al. (2016).
This study uses the LandTrendr (LT) algorithm — Landsat-based Detection of Trends in Disturbance and Recovery — to identify and characterize periods of change in naturally vegetated areas and to measure the magnitude of changes that occurred between 1984 and 2024. LT is an effective spectro-temporal segmentation tool for detecting change patterns (Kennedy; Yang; Cohen, 2010). Although developed for forest monitoring, the algorithm has been widely applied in urban analyses. Yan and Wang (2021) used seven bands/indices in LT to obtain information on urban change in Karachi (Pakistan) from 2000 to 2020. They considered the majority value of the information as the result, in an approach similar to the majority voting method, which, according to the authors, effectively overcomes uncertainty in extracting information on urban expansion compared to the use of a single band/index. Hu et al. (2024) used the shortwave infrared (SWIR) band in LT to extract building construction time from monthly Landsat time series data. This approach was applied to detect changes in building construction, demolition, and reconstruction in the city of Beijing (China) from 1990 to 2020. Mugiraneza, Nascetti, and Ban (2020) aimed at the continuous monitoring of urban land cover change trajectories. To this end, they merged LT results using multiple indices to reconstruct dense annual land cover maps for the period from 1990 to 2019.
Considering this context, the objective of the present study was to analyze land use and land cover changes in Barra da Tijuca between 1984 and 2024 using the LandTrendr algorithm. The research seeks to quantify and map the loss of vegetated areas due to urban expansion, validating the results through an error matrix and accuracy metrics to ensure precision in the detection of the mapped changes.
- Materials and Methods
2.1 Study Area
The Administrative Region XXIV – Barra da Tijuca (Figure 1) corresponds to an area of approximately 165 km², located in Planning Area 4 (AP4) – the Southwest Zone of the municipality of Rio de Janeiro (RJ). This biome, due to the intense process of urbanization of large urban centers — mostly present in Brazilian coastal regions — has had its territory devastated, being the Brazilian biome that has suffered the most under the influence of urbanization. It is noteworthy that more than 60% of the Brazilian population resided within the domain of this biome in 2016, when it represented about 7% of its original forests, as presented by Mazzurana (2016). Locally, Barra da Tijuca is the 8th most populous region of the municipality, according to preliminary data from the 2022 Census (Prefeitura da Cidade do Rio de Janeiro, 2024), and recurrently faces problems related to urbanization, such as deforestation and the occupation of irregular housing in environmental protection areas, by populations of all income levels, as highlighted by Sousa (2018). The late urbanization process, which began shortly before the availability of Landsat data, allowed the selection of this area for observing the advance of anthropogenic areas over natural regions. Despite the limited territorial extent, the application of the algorithm proved feasible given the 30-meter spatial resolution of Landsat data, since the tool was specifically developed to operate with these sensors. In addition, the algorithm has been widely employed in the analysis of change trajectories in urban areas.
Figure 1: Study Area – Administrative Region of Barra da Tijuca, Rio de Janeiro (RJ)
Source: Authors (2025)
2.2 Materials
The LandTrendr algorithm (Landsat-based Detection of Trends in Disturbance and Recovery), developed by Kennedy et al. (2010) and implemented in Google Earth Engine (LT-GEE), is an approach that enables a comprehensive and faster analysis than that based on a single current image (Kennedy et al., 2018). The general objective of LandTrendr is to characterize a temporal trajectory of data values using a sequence of connected linear segments, delimited by breakpoints or nodes. The algorithm operates with an analysis interval of one image per year, and it is up to the user to parameterize it to extract the most appropriate information according to the objective, varying according to the spectral band and/or index used.
According to Câmara et al. (2016), the trajectory-based approach represents a new paradigm in change studies, highlighting time as the central variable, rather than space, as considered in many mapping approaches. This is known as “time first vs. space first,” in which the temporal response becomes the central element in the identification of certain phenomena (Weckmüller; Vicens, 2018).
Temporal data are analyzed prior to spatial data, and time series analysis is prioritized. LT was originally developed for monitoring forest changes, such as deforestation, burning, and regeneration, and currently includes new spectral indices, such as the Normalized Difference Snow Index (NDSI) and the Normalized Difference Moisture Index (NDMI). The objective of this tool is to map changes in each pixel over time, defining change events when they occur. The mapped events generate bands such as “year of change,” “magnitude of change,” “pre-change value,” and “duration of change.” This study focused on the use of the “magnitude of change,” “year of change,” and “duration of change” bands.
Landsat images were obtained free of charge from the USGS (United States Geological Survey) through the GEE (Google Earth Engine) Image Catalog. Landsat Surface Reflectance Tier 1 products were used, with a spatial resolution of 30 meters and a temporal resolution of 16 days, for the analysis of a 40-year image time series. Although the TM (Thematic Mapper) sensor aboard Landsat 5 and the ETM+ (Enhanced Thematic Mapper Plus) sensor aboard Landsat 7 are different, they operate in the same spectral bands, which ensures data integration. The OLI (Operational Land Imager) sensor aboard Landsat 8, whose operation began in 2013 and which is also integrated into LT, operates in more spectral bands than its predecessors, but in spectral regions common to them. As this is a time-series-based method, it is necessary that the data be normalized for differences between sensors and be free of atmospheric noise (such as clouds and shadows), ensuring data consistency over the years. GEE provides surface reflectance data for Landsat sensors already with geometric and atmospheric correction, normalized in its catalog.
The algorithm was implemented on the GEE platform, as proposed by Kennedy et al. (2018). Its execution requires the definition of three groups of parameters: collection parameters, execution parameters, and change parameters (Figure 2). The index used in the time series analysis to observe naturally vegetated areas that underwent suppression was the Normalized Difference Vegetation Index (NDVI – Equation 1).
 (1)
(1)
Figure 2: Input Parameters of the LT-GEE Algorithm
Source: Authors (2025)
2.2.1 LT Parameterization
As a collection parameter, the NDVI index was used. It is important to note that LandTrendr can be applied to different spectral metrics, including individual spectral bands and other spectral indices, such as, for example, the NBR index (Normalized Burn Ratio). The selection of this parameter is decisive for the interpretation of the detected change. For instance, when using NDVI, a decrease in pixel values implies the replacement or suppression of vegetation, whereas in bands such as shortwave infrared (SWIR), a decrease would indicate the opposite process (such as biomass recovery, loss of built-up area, or exposed soil), since non-vegetated surfaces tend to present higher reflectance at this wavelength. The choice of this index is justified by its importance in the analysis of a region naturally covered by Atlantic Forest. In addition, it is historically one of the most widely used indices in Remote Sensing analyses due to its simple formulation and the availability of long satellite time series, allowing the monitoring of phenology, productivity (biomass/primary production), drought detection and degradation, agricultural assessment, and large-scale ecological studies (Rouse et al., 1974; Ponzoni; Shimabukuro, 2010; Huang et al., 2021).
In the context of the study area, variations in NDVI values, although not directly representing the impact of urbanization, can be associated with its dynamics, since their variation over time may reflect changes in surface elements, such as vegetation cover, exposed soil, water bodies, or built-up areas. Thus, persistent reductions in NDVI values may indicate processes of vegetation replacement by anthropogenic surfaces.
Additionally, a seasonal filter was applied by selecting only images acquired between May and June. This interval, which corresponds to the end of the autumn transition season and precedes winter, tends to present drier and cooler conditions, reducing atmospheric instability and, consequently, cloud occurrence, which helps to reduce noise in the time series. Although the algorithm allows working with multiple periods throughout the year, the choice of this seasonal subset aims to ensure greater spectral consistency among the analyzed years, in order to avoid some limitations, such as the risk of generating No-Data areas due to the occasional presence of shadows, clouds, or other noise in the few images available for this period.
For the execution parameters, a maximum of three segments was defined, with the objective of detecting only changes that persisted. In this configuration, the period of stability prior to the change is defined as one segment, the transition of the change as a second segment, and the final segment represents the post-change period, in which the index remains stable and at a lower level than the previous one. This configuration allows the characterization of transitions such as, for example, an area with vegetation that becomes deforested and subsequently transforms into exposed soil prepared for a real estate development, based on a change recorded in the year 2000. This facilitates the interpretation of the observed transformation processes. The “minimum of 6 observations” parameter highlights the need for the model to analyze the results at least six times in order to adjust its outputs. As the objective of the study was solely to observe areas that underwent changes related to vegetation loss to become another land use, a parameter was applied to avoid the detection of index recovery within a one-year period; that is, if there were recovery of the index during this period, the event would not be classified as a change.
The algorithm segmentation is performed by dividing the spectral trajectory of each pixel over time. LT divides this trajectory into linear segments, representing phases of stability or moments of change. Prolonged periods of stability are characterized by low-slope segments, whereas abrupt disturbances, such as deforestation, generate short and steep segments, reflecting expressive variations in the spectral values of the pixels, as shown in Figure 3.
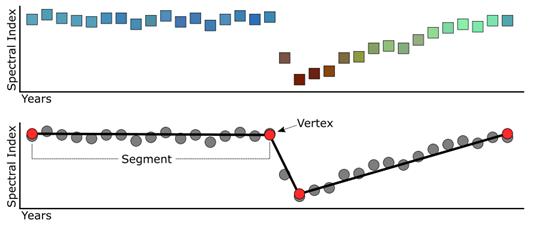
Figura 3. Segmentation of pixel time series by LandTrendr. Image data are reduced to a single spectral band or index and then divided into a series of straight-line segments through breakpoint (vertex) identification.
Source: Adapted from the LT-GEE Guide (available at: https://emapr.github.io/LT-GEE/landtrendr.html)
The magnitude of change is measured by comparing the index values used before and after the occurrence of the alteration. For example, a pixel that presented NDVI = 0.8 (forest) and changed to NDVI = −0.1 (exposed soil, water, etc.) exhibits a change magnitude of −0.9.
In this research, a negative variation of at least 0.1 was defined as a change, provided that there was no recovery of the index within a one-year period. As LT stores the absolute value of the spectral delta, the alteration in the example (a delta of 0.9) is presented with a magnitude of 900, indicating a strong loss of the natural characteristic. The change parameters used in the model were configured to observe occurrences that presented only vegetation loss. These occurrences were only considered if their magnitude (difference between the pre-change and post-change index values) was greater than 100.
Based on the modeling and parameter adjustments in the code, the LT-GEE algorithm provided an image containing information on vegetation loss, with the following bands: (1) Year of change detection; (2) Magnitude of change; (3) Duration of change; (4) Spectral value of the event prior to the change; (5) Rate of spectral change for the event (magnitude/duration); and (6) DSNR (Disturbance Signal-to-Noise Ratio) (Cohen et al., 2018). For the present study, the following outputs were considered: “Year of Change Detection,” “Magnitude of Change,” and “Duration of Change.” These data are presented in matrix format (pixel grid) and contain information on the year, magnitude, and duration of the change. LT also allows the observation of the NDVI response of selected pixels along the time series through graphs.
2.3 Validation
The validation of the results derived from LT was conducted in two complementary stages. First, the “Random Points in Polygons” tool in the QGIS geoprocessing software was used to generate 202 random points, equally divided (101 points) between the ‘Change’ and ‘No Change’ classes. These points served as the basis for producing the error matrix, calculating the Kappa Coefficient (which indicates the degree of agreement of the model; Cohen, 1960), and computing accuracy metrics, thus validating the results obtained with the algorithm modeling.
The total number of points was defined based on methodological recommendations for change mapping validation, which suggest samples between 150 and 250 points to ensure statistical robustness without compromising operational feasibility (Congalton; Green, 2019). Random sampling within each class ensures the independence of observations and allows valid inferences about the overall accuracy of the model.
Subsequently, for change analysis, a code in GEE — the Time Series Inspector (Yin et al., 2020) — was used, which allowed the parallel observation of images from the years 1985, 2010, and 2024, and the time series graphs for the NDVI index. After this analysis, each point was interpreted as ‘Change’ or ‘No Change’ according to the observed reference (ground truth). Finally, an error matrix was created, and accuracies and indicators were calculated to validate the classification.
- Results
The segmentation results produced by the LandTrendr (LT) algorithm generated maps of the “Magnitude of Change” (Figure 4), “Year of Change Detection” (Figure 5), and “Duration of Change” (Figure 6) bands. For the magnitude of change map, the classes were divided into five intervals; the first class (100–200) was defined to encompass the largest proportion of the observed magnitudes, while the remaining classes followed 200-unit intervals (Figure 4). For the map of the period of change occurrence, the 40-year interval was subdivided into eight regular five-year classes (Figure 5).
The magnitude analysis (Figure 4) shows that the lower-impact classes (100–200 and 200–400) were predominant, representing 46.7% and 38% of the changes, respectively. High-magnitude changes (800–961) were rare, accounting for only 0.08% of the events.
Figure 4: Map of change magnitude – Administrative Region XXIV (Barra da Tijuca, Rio de Janeiro, RJ), from 1984 to 2024.
Source: Authors, based on data from the U.S. Geological Survey (USGS) and Google Earth Engine.
The temporal analysis (Figure 5) identified that the period of greatest transformation occurred between 1985 and 1990, when 22.5 km² were altered, corresponding to 40.65% of all detected change. This value is approximately three times higher than that of the second period with the highest occurrence of changes (2010–2015), which recorded 7.4 km² of change (13.33% of the total). The 1985-1990 period also concentrated the largest proportion of the sum of change magnitudes (25.2% of the total), followed by 2010–2015 (16%).
Figure 5: Map of change period – Administrative Region XXIV (Barra da Tijuca, Rio de Janeiro, RJ), from 1984 to 2024.
Source: Authors, based on data from the U.S. Geological Survey (USGS) and Google Earth Engine.
The analysis of change duration for the Barra da Tijuca area, visualized in the mapping shown in Figure 6, indicated complex patterns. A concentration of changes with durations between 1 and 9 years was observed, which may represent vegetation suppression events that are completed and stabilize into a new type of cover (such as exposed soil or the initial stage of construction) within this interval.
Figure 6: Map of change duration – Administrative Region XXIV (Barra da Tijuca, Rio de Janeiro, RJ), from 1984 to 2024.
Source: Authors, based on data from the U.S. Geological Survey (USGS) and Google Earth Engine.
However, a second pattern with a higher number of changes stood out, with very long durations exceeding 34 years. The data suggest that changes initiated during the main transformation period (1985–1990) remain “active” to the present day. Rather than being interpreted as abrupt and isolated deforestation events, the algorithm detects these pixels as a gradual and continuous process of vegetation suppression. In these cases, the NDVI index likely never stabilized at a new low level, continuing to decline slowly throughout the entire analyzed time series.
After the analysis and classification of the validation points, the error matrix was generated (Table 1). The analysis of this matrix, together with the Kappa index, is essential to identify the main sources of model errors, which may be generated by both the researcher and the algorithm, and is necessary to assess the quality of the mapping (Zebende; Weckmüller; Vicens, 2020).
The commission and omission errors resulting from the model validation were 0.12 and 0.05, respectively. The commission error (12%), obtained from the ratio between false positives (12) and the total number of points classified as change (101), indicates that the algorithm incorrectly classified some areas as “Change.” The main cause identified for these errors was topographic influence. As identified by Ferraz and Vicens (2025), in slope regions, the influence of shadow on pixels causes irregular variation in NDVI in the time series, which hinders visual interpretation and leads the model to detect non-existent changes, as shown in Figure 7. In addition to this factor, some rocky outcrop areas were also incorrectly classified as change, probably due to the same shading effect. The omission error (5%), calculated from the ratio between false negatives (5) and the total number of real reference changes (94), was concentrated in some mangrove regions. In these locations, the detection of real changes was hindered by the complex spectral signature, which is influenced both by vegetation mixing (restinga and mangrove) and by the hydrological conditions of lagoons, as shown in Figure 8. It is inferred that the algorithm failed to detect these real changes due to the slow regeneration of vegetation in these areas, which may not have been captured by the parameters defined in the model.
Table 1: Error matrix, change (positive) and no change (negative), and applied metrics
Reference | LandTrendr |
Change | No change | Total |
Change | 89 | 5 | 94 |
No change | 12 | 96 | 108 |
Total | 101 | 101 | 202 |
Global accuracy | 0.92 |
Kappa | 0.83 |
F1-score | 0.91 |
User accuracy | 0.88 | 0.12 |
Producer accuracy | 0.95 | 0.05 |
Source: Authors (2025)
Figure 7: Example of Commission Error (False Positive). (a) True-color image with the reference point. (b) LT classification. (c) Historical series of the NDVI index for Landsat 4, 5, 7, and 8. (d) LT classification time series, with a drop in the second segment.
Source: Authors (2025)
Figure 8: Example of Omission Error (False Negative). (a) True-color image with the reference point. (b) LT classification. (c) Historical series of the NDVI index for Landsat 4, 5, 7, and 8. (d) LT classification time series, with a single segment.
Source: Authors (2025)
- Discussion
The application of LandTrendr made it possible to identify patterns of variation in NDVI throughout the time series and to locate areas with changes in vegetation cover. Since magnitude corresponds to the difference between the index value at the beginning and at the end of a change segment, values between 100 and 200, equivalent to variations of approximately 0.1 to 0.2 NDVI units, do not necessarily represent an effective and robust suppression of vegetation. Such variations may reflect only subtle changes in vegetative vigor or the presence of lower and more sparse formations. For this reason, the study deliberately adopted a more conservative threshold, so as not to exclude these smoother transitions. In addition, analysis of the spectral behavior of pixel curves over time is essential to properly interpret the observed dynamics and to distinguish natural variations from processes of actual vegetation cover change.
While Yan and Wang (2021) adopted a majority-voting approach using seven bands/indices to overcome uncertainties in the urban fabric of Karachi, the results of this study demonstrate that, for the specific objective of detecting vegetation suppression in Barra da Tijuca, the isolated use of the NDVI index showed satisfactory performance (Overall Accuracy of 0.92). This suggests that, in areas with well-defined forest–city transitions, less complex models can be as efficient as multi-index approaches.
Two detection thresholds were considered in the study: the minimum analysis area and the change magnitude threshold. Because Landsat images were used, the minimum analysis area threshold is represented by pixels of 900 m², given the 30 m spatial resolution of this series, i.e., each pixel measures 30 m × 30 m. The change magnitude threshold defines the minimum variation of the NDVI vegetation index required to be considered a relevant change. Changes covering an area much smaller than a pixel (sub-pixel) may not be detected, since their spectral contribution may not be representative at this resolution. Consequently, this scale may not be representative for “fine” changes, such as the expansion of informal settlements on hillsides or alterations within condominiums (for example, the removal of gardens for house expansion). Changes occurring within intervals shorter than one year are also not detected by the model, since these analyses target changes lasting more than one year and, in this study, without recovery of the index over a period of at least one year.
This scale limitation is a common challenge in Landsat-based studies, differing from approaches that use monthly data to detect rapid construction and demolition cycles, as proposed by Hu et al. (2024) in Beijing. Unlike the Chinese study, which focused on intra-urban building dynamics, the present analysis prioritized the definitive conversion of natural areas into anthropogenic areas, for which annual temporal resolution proved adequate.
The analysis of urban expansion in Administrative Region XXIV – Barra da Tijuca, between 1984 and 2024 using LT revealed pronounced growth. This was observed mainly in the period from 1985 to 1990, which accounted for 40.65% of the total area of changes classified by the algorithm, driven by intense real estate activity in the region. In the 1980s, Planning Area 4 (AP4), which includes the neighborhoods of Barra da Tijuca, Jacarepaguá, and Cidade de Deus, showed an annual growth rate of the population living in informal settlements far higher than those observed in already consolidated areas (AP1, AP2, and AP3), ranking behind only AP5, which includes neighborhoods such as Campo Grande, Bangu, and Guaratiba (Lago, 1999). In 2004, AP4 was the fastest-growing area in the city and represented the vector of urban expansion, moving from the South Zone toward Barra da Tijuca (Camarano et al., 2004).
In the period from 2010 to 2015, the second with the highest proportion of altered area according to the results, this proportion dropped to 13.33%. This fact is related to preparations for the 2016 Olympic Games held in the city of Rio de Janeiro, indicating a slowdown in urbanization in this region. The main changes during this period were basic sanitation works in the regional lagoons, the creation of the Olympic Golf Course (inaugurated in 2015), and the construction of the Grand Hyatt Hotel Rio de Janeiro (inaugurated in 2016).
Although LandTrendr is effective in detecting these losses, spectral confusion caused by topography remains a challenge. The identification of false positives in hillside shadow areas in this study reinforces the observations of Ferraz and Vicens (2025) regarding the influence of relief on NDVI variability, indicating that application of the algorithm in rugged terrain regions, common in Rio de Janeiro, requires careful validation of shaded areas.
Analysis of the Landsat sensor time series showed that the period from 1985 to 1990 was the most impactful, with a total altered area of approximately 22.5 km², reflecting intense real estate expansion in the region. Although the approach differs from previously cited studies analyzing urban areas with LT, the algorithm’s temporal segmentation was also able to detect urban expansion based on the degradation of vegetated areas, observed through the NDVI vegetation index. This is due to the natural characteristic of the region, which in its original conditions belonged to the Atlantic Forest biome, a tropical forest.
- Conclusion
The present study demonstrated the effectiveness of the algorithm in detecting the evolution of anthropogenic areas, both in already urbanized and peripheral regions, by using the loss of naturally vegetated areas as a methodological approach. This evidenced the loss of these vegetated areas due to urbanization.
Temporal segmentation proved to be a powerful tool for analyzing the individual trajectories of each pixel and for identifying subtle changes over time.
The accuracy indices demonstrate the applicability of the model in future studies under similar conditions and suggest revising the minimum magnitude value for a modeling approach that more effectively detects built-up areas. In addition, the implementation of the built-up area index NDBI (Normalized Difference Built-up Index) emerges as a possibility for correlation with the data resulting from modeling with the NDVI index.
With an overall accuracy of 0.92, an F1-score of 0.91, and a Kappa value of 0.83, the study demonstrated the robustness of the algorithm in identifying change patterns, while also pointing to the need to reassess the classification parameters to identify built-up areas resulting from deforested areas.
By analyzing the maps, it was possible to identify shape patterns consistent with built-up areas, which corroborates the possibility of using this approach to identify the advance of urban areas into previously vegetated regions.
Validation of the classification using the error matrix and the Kappa index reinforces the robustness of the results and suggests the applicability of LT in other urban contexts. Thus, the use of this tool is recommended for monitoring environmental changes, as it can support public policy strategies aimed at conservation, environmental preservation, and sustainable development in this region.
As a topic for future research, the implementation of the NDBI index directly in the algorithm is recommended. The objective would be to allow the analysis of correlations between the results obtained in this classification (based on NDVI) and those derived from the index specific to built-up areas (NDBI). Additionally, it is recommended to analyze correlations by cross-referencing the obtained data with historical series of socioeconomic, demographic, or urban planning data for the region.
References
ABREU, M. A. Evolução Urbana do Rio de Janeiro. 4a Edição. Instituto Municipal de Urbanismo Pereira Passos (IPP), Rio de Janeiro, RJ, 2006.
CÂMARA, G. et al. Using dynamic geospatial ontologies to support information extraction from big Earth observation data sets. International Conference on GIScience Short Paper Proceedings, v. 1, n. 1, 2016.
CAMARANO, A. A. et al. Tendências demográficas no município do Rio de Janeiro. Coleção Estudos Cariocas, v. 4, n. 1, p. 47-47, 2004.
COHEN, J. A coefficient of agreement for nominal scales. Educational and psychological measurement, v. 20, n. 1, p. 37-46, 1960.
COHEN, W. B. et al. A LandTrendr multispectral ensemble for forest disturbance detection. Remote Sensing of Environment, v. 205, p. 131-140, 2018.
CONGALTON, R. G.; GREEN, K. Assessing the Accuracy of Remotely Sensed Data: Principles and Practices. 3ª edição. Boca Raton: CRC Press, 2019.
COSTA, L. Plano Piloto para urbanização da baixada compreendida entre a Barra da Tijuca, o Pontal de Sernambetiba e Jacarepaguá. Agência Jornalística Image, Rio de Janeiro, 1969.
FERRAZ, D. P. G. B.; VICENS, R. S. Comparison between machine learning classification and trajectory-based change detection for identifying eucalyptus areas in Landsat time series. Remote Sensing Applications: Society and Environment, v. 37, [s.n.], 2025.
GÓMEZ, C.; WHITE, J. C.; WULDER, M. A. Optical remotely sensed time series data for land cover classification: A review. ISPRS Journal of Photogrammetry and Remote Sensing, v. 116, p. 55-72, 2016.
HU, T. et al. Extraction of Building Construction Time Using the LandTrendr Model With Monthly Landsat Time Series Data. IEEE Journal of Selected Topics in Applied Earth Observations and Remote Sensing, v. 17, p. 18335-18350, 2024.
HUANG, S. et al. A commentary review on the use of normalized difference vegetation index (NDVI) in the era of popular remote sensing. Journal of Forestry Research, v. 32, n. 1, p. 1-6, 2021.
KENNEDY, R. E.; YANG, Z.; COHEN, W. B. Detecting trends in forest disturbance and recovery using yearly Landsat time series: 1. LandTrendr—Temporal segmentation algorithms. Remote Sensing of Environment, v. 114, n. 12, p. 2897-2910, 2010.
KENNEDY, R.E. et al. Implementation of the LandTrendr Algorithm on Google Earth Engine. Remote Sensing, [s.l.]. v. 10, n. 691, p. 1-10, 2018.
LAGO, Luciana Corrêa. Desigualdade socioespacial e mobilidade residencial: a metrópole do Rio de Janeiro nos anos 80. Cadernos Metrópole, [S. l.], n. 02, p. 11–40, 1999.
MAUS, V. et al. A Time-Weighted Dynamic Time Warping Method for Land-Use and Land-Cover Mapping. IEEE Journal of Selected Topics in Applied Earth Observations and Remote Sensing, v. 9, n. 8, p. 3729-3739, 2016.
MAZZURANA, E. R. Mata Atlântica: patrimônio natural, cultural e biológico do Brasil. Revista Encontros Teológicos, [S. l.], v. 31, n. 3, 2016.
MENDONÇA, V. C. Do Sertão Carioca aos condomínios da Barra da Tijuca: uma viagem em torno dos territórios. Tese (Doutorado em Psicologia Social) – Instituto de Psicologia, Universidade do Estado do Rio de Janeiro, Rio de Janeiro, RJ. 247 p. 2023.
MUGIRANEZA, T.; NASCETTI, A.; BAN, Y. Continuous monitoring of urban land cover change trajectories with landsat time series and landtrendr-google earth engine cloud computing. Remote Sensing, v. 12, n. 18, p. 2883, 2020.
PEIXOTO, G.; NASCIMENTO, R. Prédio irregular avaliado em R$ 4 milhões é demolido na Ilha da Gigoia. G1 Rio de Janeiro, 15/08/2023. Available at: https://g1.globo.com/rj/rio-de-janeiro/noticia/2023/08/15/predio-irregular-e-demolido-na-ilha-da-gigoia.ghtml. Accessed on: 10 nov. 2025.
PONZONI, F. J.; SHIMABUKURO, Y. E. Sensoriamento Remoto no Estudo da Vegetação. São José dos Campos/SP: Instituto Nacional de Pesquisas Espaciais – INPE, 2010.
Prefeitura da Cidade do Rio de Janeiro. Censo 2022: População e domicílios por bairros (dados preliminares). Available at: https://www.data.rio/datasets/fd354740f1934bf5bf8e9b0e2b509aa9_2/explore?showTable=true. Accessed on: 18 oct. 2024.
Prefeitura da Cidade do Rio de Janeiro. IDH-M: Uma análise do Índice de Desenvolvimento Humano Municipal para a Cidade do Rio de Janeiro. Available at: http://rio.rj.gov.br/dlstatic/10112/6165511/4162028/analise_idhm_rio_v4_compur.pdf. Accessed on: 18 oct. 2024.
ROUSE, J. W. et al. Monitoring Vegetation systems in the Great Plains with ERTS, Proceedings. Third Earth Resources Technology Satellite-1 Symposium, Greenbelt: NASA SP-351, p. 3010-3017, 1974.
SOFFIATI, A. Manguezais do Estado do Rio de Janeiro. Revista Visão Socioambiental, 08/03/2024. Available at: https://visaosocioambiental.com.br/manguezais-do-estado-do-rio-de-janeiro/. Accessed on: 10 nov. 2025.
SOUSA, A. V. de. Do peixe ao lixo: transformações urbanas e seus efeitos na produção de espaços sociais no Itanhangá. 2018. 23f. Trabalho de Conclusão de Curso (Especialização em Política e Planejamento Urbano) – IPPUR/UFRJ, Rio de Janeiro, 2018.
SOUSA, A. V. Transformações urbanísticas, práticas estatais e mercado imobiliário na Lagoa da Tijuca/RJ. XIII Reunião de Antropologia do Mercosul. Porto Alegre, RS. 20 p. 2019.
TAHIR, Z. et al. Predicting land use and land cover changes for sustainable land management using CA-Markov modelling and GIS techniques. Scientific Reports, v. 15, n. 1, p. 3271, 2025.
VINHAS, L. et al. Web Services for Big Earth Observation data. Geoinfo, p. 166-177, 2016.
WECKMÜLLER, R.; VICENS, R. S. As geotecnologias e a detecção de trajetórias evolutivas da paisagem: possibilidades metodológicas e aplicações. Revista Brasileira de Geografia Física, v. 11, n. 6, p. 2140-2159, 2018.
YAN, X.; WANG, J. Dynamic monitoring of urban built-up object expansion trajectories in Karachi, Pakistan with time series images and the LandTrendr algorithm. Scientific reports, v. 11, n. 1, p. 23118, 2021.
YIN, H. et al.. Monitoring cropland abandonment with Landsat time series. Remote Sensing of Environment, v. 246, p. 111873, 2020.
ZEBENDE, J. V.; WECKMÜLLER, R.; VICENS, R. S. Análise da Trajetória Evolutiva da Cobertura Florestal do Município de Teresópolis/RJ utilizando o Algoritmo LandTrendr. Anuário do Instituto de Geociências - UFRJ. p. 316-324, 2020.
ZHU, Z.; WOODCOCK, C. E. Continuous change detection and classification of land cover using all available Landsat data. Remote Sensing of Environment, v. 144, p. 152-171, 2014.
About the Authors
Matheus Augusto de Souza is an undergraduate student in Mathematical and Earth Sciences at the Federal University of Rio de Janeiro (UFRJ), with an emphasis on Remote Sensing and Geoprocessing. Since June 2024, he has been working as an Undergraduate Research fellow at the ESPAÇO Laboratory of Remote Sensing and Environmental Studies (UFRJ). During his training, he served as a teaching assistant for the courses Geoprocessing and Remote Sensing Project at UFRJ. His academic experience focuses on the analysis of spatial data and satellite image time series, using software such as ArcGIS, QGIS, and Google Earth Engine, with emphasis on the LandTrendr algorithm for change detection. He has skills in programming languages such as Python, R, and JavaScript. He currently works as a Development Assistant at a geotechnologies company.
Debora da Paz Gomes Brandão Ferraz holds a PhD in Geography from the Federal Fluminense University (UFF). She obtained her bachelor’s degree (2014) and master’s degree (2017) in Geography from the same institution. During her training, she was affiliated with the Physical Geography Laboratory at UFF, where she developed activities related to remote sensing and geoprocessing. Her experience focuses on mapping and analyzing forest dynamics in the state of Rio de Janeiro, using satellite imagery and software such as ArcGIS, QGIS, eCognition, and Google Earth Engine, with emphasis on the LandTrendr algorithm for change detection. She served as a substitute professor at the Federal University of Rio de Janeiro (UFRJ) in the field of Geotechnologies in 2024. She is currently a substitute professor at the State University of Rio de Janeiro (UERJ), Cabo Frio campus.
Author Contributions
Conceptualization, [D.P.G.B.F., M.A.S.]; methodology, [D.P.G.B.F., M.A.S.]; software, [M.A.S.]; validation, [M.A.S.]; formal analysis, [M.A.S., D.P.G.B.F.]; investigation, [M.A.S., D.P.G.B.F.]; data curation, [M.A.S., D.P.G.B.F.]; writing—original draft preparation, [M.A.S.]; writing—review and editing, [D.P.G.B.F.]; supervision, [D.P.G.B.F.]. All authors have read and agreed to the published version of the manuscript.
Data Availability
The processing scripts and the resulting data from this study are publicly available in the GitHub repository, accessible at: https://github.com/mattaugustt/landtrendr_barra_da_tijuca_cec
Acknowledgements
The authors acknowledge the contributions of the Federal University of Rio de Janeiro (UFRJ), especially the ESPAÇO Laboratory of Remote Sensing and Environmental Studies, for providing the necessary infrastructure for the development of this research.
Conflicts of Interest
The authors declare no conflicts of interest.
About Coleção Estudos Cariocas
Coleção Estudos Cariocas (ISSN 1984-7203) is a publication dedicated to studies and research on the Municipality of Rio de Janeiro, affiliated with the Pereira Passos Institute (IPP) of the Rio de Janeiro City Hall.
Its objective is to disseminate technical and scientific production on topics related to the city of Rio de Janeiro, as well as its metropolitan connections and its role in regional, national, and international contexts. The collection is open to all researchers (whether municipal employees or not) and covers a wide range of fields — provided they partially or fully address the spatial scope of the city of Rio de Janeiro.
Articles must also align with the Institute’s objectives, which are:
- to promote and coordinate public intervention in the city’s urban space;
- to provide and integrate the activities of the city’s geographic, cartographic, monographic, and statistical information systems;
- to support the establishment of basic guidelines for the city’s socioeconomic development.
Special emphasis will be given to the articulation of the articles with the city's economic development proposal. Thus, it is expected that the multidisciplinary articles submitted to the journal will address the urban development needs of Rio de Janeiro.