
Volume 13 Issue 4 *Corresponding author nathandamas@ufpr.br Submitted 21 Nov 2025 Accepted 8 Dec 2025 Published 23 Dec 2025 Citation ANTONIO, N. D. et al. Estimativa da heterogeneidade de eixos viários da plataforma OpenStreetMap por meio da determinação da sua Acurácia Posicional: um estudo preliminar no município do Rio de Janeiro – RJ. Coleção Estudos Cariocas, v. 13, n. 4, 2025.
DOI: 10.71256/19847203.13.4.197.2025 The article was originally submitted in PORTUGUESE. Translations into other languages were reviewed and validated by the authors and the editorial team. Nevertheless, for the most accurate representation of the subject matter, readers are encouraged to consult the article in its original language.


| Estimation of positional accuracy heterogeneity of OpenStreetMap road networks: a preliminary study in the municipality of Rio de Janeiro - RJ Estimativa da heterogeneidade de eixos viários da plataforma OpenStreetMap por meio da determinação da sua Acurácia Posicional: um estudo preliminar no município do Rio de Janeiro – RJ Estimación de la heterogeneidad de la precisión posicional de los ejes viales de la plataforma OpenStreetMap: un estudio preliminar en el municipio de Río de Janeiro - RJ Nathan Damas Antonio1*, Elias Nasr Naim Elias2, Irving da Silva Badolato3,
Silvana Philippi Camboim4 e Marcio Augusto Reolon Schmidt5 1Universidade Federal do Paraná, Av. Cel. Francisco H. dos Santos, 100 - Jardim das Américas, Campus Centro Politécnico, Bloco VI, Curitiba - PR, 81530-000, ORCID: 0000-0002-1469-2867, nathandamas@ufpr.br 2Universidade do Estado do Rio de Janeiro, Campus Francisco Negrão de Lima, Rua São Francisco Xavier, 524, Maracanã - Pavilhão João Lira Filho, Faculdade de Engenharia, Rio de Janeiro - RJ, 20550-013, ORCID: 0000-0003-2289-5055, elias.naim@eng.uerj.br 3Universidade do Estado do Rio de Janeiro, Campus Francisco Negrão de Lima, Rua São Francisco Xavier, 524, Maracanã - Pavilhão João Lira Filho, Faculdade de Engenharia, Rio de Janeiro - RJ, 20550-013, ORCID: 0000-0002-4058-4392, irvingbadolato@eng.uerj.br 4Universidade Federal do Paraná, Av. Cel. Francisco H. dos Santos, 100 - Jardim das Américas, Campus Centro Politécnico, Bloco VI, Curitiba - PR, 81530-000, ORCID: 0000-0003-3557-5341, silvanacamboim@ufpr.br 5Universidade Federal de Uberlândia, Av. João Naves de Ávila, 2121 Campus Santa Mônica, Bloco 1Y, secretaria FECIV, Santa Mônica, 38408100 - Uberlândia, MG, ORCID: 0000-0003-2716-2360, marcio.schmidt@ufu.br
AbstractThis article estimates the heterogeneity of positional accuracy of the OpenStreetMap (OSM) road network in the municipality of Rio de Janeiro, highlighting implications for transport analyses and urban environmental management. The application of the Brazilian Cartographic Accuracy Standard to six independent samples demonstrated, in a statistically significant manner, that OSM quality is not homogeneous, ranging between Classes B and C at the 1:10,000 scale. The largest positional errors, reaching up to 9.07m, occurred in consolidated formal areas, indicating that heterogeneity is multifactorial and associated with temporal misalignment between cartographic datasets, with direct impacts on environmental and mobility-related applications. Keywords: OpenStreetMap, positional accuracy, data heterogeneityResumoEste artigo estima a heterogeneidade da acurácia posicional da rede viária do OpenStreetMap (OSM) no município do Rio de Janeiro, destacando implicações para análises de transportes e gestão ambiental urbana. A aplicação do Padrão de Exatidão Cartográfica em seis amostras independentes demonstrou, de forma estatisticamente significativa, que a qualidade do OSM não é homogênea, variando entre as classes B e C na escala 1:10.000. Os maiores erros posicionais, de até 9,07m, ocorreram em áreas formais consolidadas, indicando que a heterogeneidade é multifatorial e associada à defasagem temporal entre bases cartográficas, com impactos diretos em aplicações ambientais e de mobilidade. Palavras-chave: OpenStreetMap, acurácia posicional, heterogeneidade de dados ResumenEste artículo estima la heterogeneidad de la exactitud posicional de la red vial de OpenStreetMap (OSM) en el municipio de Río de Janeiro, destacando implicaciones para análisis de transporte y gestión ambiental urbana. La aplicación del Estándar Brasileño de Exactitud Cartográfica a seis muestras independientes demostró, de manera estadísticamente significativa, que la calidad del OSM no es homogénea, variando entre las clases B y C en la escala 1:10.000. Los mayores errores posicionales, de hasta 9,07m, se observaron en áreas formales consolidadas, lo que indica que la heterogeneidad es multifactorial y está asociada a la desalineación temporal entre bases cartográficas, con impactos directos en aplicaciones ambientales y de movilidad. Palabras clave: OpenStreetMap, precisión posicional, heterogeneidad de datos |
Introduction
The last decade has witnessed a paradigm shift in the generation and dissemination of geospatial information. Driven by the establishment of Web 2.0 (O’Reilly, 2007), the user of cartographic products has transcended the role of a passive consumer to become a fundamental element in data generation (Cormode; Krishnamurthy, 2008). This phenomenon, conceptualized by Goodchild (2007) as Volunteered Geographic Information (VGI), has democratized map production by allowing individuals without specialized technical training to contribute to the mapping of geographic space (Ganapati, 2011).
Within this ecosystem, OpenStreetMap (OSM) has become consolidated as the largest and most globally relevant Volunteered Geographic Information (VGI) project. With more than 10 million registered users and a database exceeding 11 billion features (nodes, ways, and relations)[1], OSM offers a dynamic alternative to reference cartography products traditionally developed by National Mapping Agencies (Kent, 2009). The main advantage of OSM lies in its rapid updating, a characteristic of immense importance in contexts such as Brazil. In a country where investment in official cartography has historically been low, resulting in coverage of only 5% of the territory at the 1:25,000 scale (Sluter et al., 2019), VGI data emerge as a promising, and sometimes, unique source for territorial planning and management.
However, the rapid adoption and applicability of these data in projects requiring metric reliability encounter a central challenge: quality assessment. The “undocumented” and decentralized nature of OSM contributions means that quality cannot be assumed, fostering an extensive line of international research focused on its measurement (Elwood; Goodchild; Sui, 2012; Haklay, 2010; Girres; Touya, 2010). This aspect aligns with the “patchwork quilt” designation proposed by Goodchild (2007), in which VGI data quality is based on contributor motivation, feature density, and contribution period.
The measurement of geospatial data quality constitutes one of the stages in the production and validation process of reference mapping. For such evaluation to be rigorous and comparable, it is based on a set of established metrics and standards. Indicators for geospatial data quality assessment are defined by ISO (International Organization for Standardization) 19157 (ISO, 2013) and include Positional Accuracy, Thematic Accuracy, Logical Consistency, Completeness, and Usability. In Brazil, the Technical Specification for Geospatial Data Quality Control (ET-CQDG) (Brasil, 2015) was developed in 2015 by the Directorate of the Geographic Service (DSG) and approved by the Army. This document defines criteria for evaluating geospatial data quality derived from ISO 19157 (ISO, 2013), complemented by the Technical Manual for the Assessment of Geospatial Data Quality of the Brazilian Institute of Geography and Statistics (IBGE, 2019).
Since reference mapping data are produced by professionals in a homogeneous manner, conditions not aligned with VGI premises, a series of studies worldwide have sought to analyze quality parameters of these data types, aiming to determine their potential for integration into reference cartographic databases. One of the earliest analyses associated with collaborative data was conducted by Haklay (2010), who evaluated the positional accuracy and completeness of OSM data in comparison with the United Kingdom’s reference mapping (Ordnance Survey) and identified their potential use. In assessing positional accuracy, Haklay (2010) employed the buffer comparison method, while completeness was evaluated through grid-based comparison of road lengths. In this context, the criteria proposed by Haklay (2010) have guided international research focused on evaluating positional accuracy and completeness of geographic data. These principles were applied by Jasin and Hamandani (2020) in Iraq, Ferster et al. (2019) in Canada, Ibrahim, Ramadan and Hefny (2019) in Egypt, Zhang and Malczewski (2018) also in Canada, and Brovelli and Zamboni (2018) in Italy.
It is worth emphasizing that these studies identified the main challenges of VGI data as being associated with information heterogeneity, since data quality varies according to the study area and the represented elements. In this context, the methodologies addressed by Ibrahim, Darwish and Hefny (2019) and Brovelli and Zamboni (2018) explicitly considered heterogeneity characteristics in their applications.
Although heterogeneity is widely discussed in recent VGI research, early studies already pointed to this challenge when assessing OSM quality, particularly regarding positional accuracy and completeness. Girres and Touya (2010), when analyzing an area in France, identified significant spatial variability by applying the Hausdorff distance method, finding an average of 13.57 m and a standard deviation of 8.32 m for the evaluated linear segments, evidencing dispersion and inconsistency of features. Similarly, Forghani and Delavar (2014) found in a region of Iran that OSM road quality exhibited substantial variation when analyzed through different geometric checks, including road length, minimum boundary geometry, central meridian, and directional distribution, based on a grid of cells. The authors highlight that these variations reinforce heterogeneity as one of the main problems associated with OSM data.
Beyond strictly cartographic evaluations, OSM data quality has been widely discussed in the context of environmental management, as OSM databases have been used as inputs for land-use and land-cover analyses, environmental modeling, risk studies, and sustainable urban planning. Several studies highlight that the reliability of environmental results based on OSM is directly associated with positional accuracy and feature completeness, especially in complex and unequal urban contexts (Goodchild; Li, 2012; Fonte et al., 2017; Li et al., 2020). In the transportation field, accurate representation of the road network is a structuring element for accessibility analyses, mobility simulations, assessment of exposure to air pollutants, and risk scenario modeling, making OSM quality heterogeneity a critical factor for network-based environmental applications (Graser; Straub; Dragaschnig, 2014; Poiani et al., 2016; Lane et al., 2013).
Given these issues, it is evident that understanding how contribution behavior in OSM occurs is essential to determining its integration potential. This issue is even more relevant in Global South countries such as Brazil. Facing a continental-scale challenge, with 8.52 million square kilometers and a complex, predominantly urban population (88%) of 212 million people (IBGE, 2023a), the country suffers from low large-scale mapping coverage and cartographic obsolescence. Added to this scenario is the limited number of studies specifically focused on estimating its heterogeneity. Machado and Camboim (2019), for example, presented a study addressing challenges and potentialities in integrating OSM data with reference data for the municipality of Curitiba-PR, resulting in an increase in information categories through data integration. Additionally, Teixeira and Schmidt (2023) evaluated the positional accuracy of road centerlines in a neighborhood of Uberlândia-MG, also evidencing the potential use of these data in the region.
The municipality of Rio de Janeiro offers a unique laboratory for deepening issues related to OSM quality and heterogeneity. The city is not merely a “datum” to be mapped; it is, in itself, the central problem of heterogeneity. The “dual” or “divided” city is not just a rhetorical figure but a morphological reality opposing the formal urban fabric, characterized by high coverage of official data, to extensive areas of informal settlements (favelas), often invisible on traditional maps (Perlman, 2010; Novaes, 2014; Kalkman, 2019). This structural duality has urgent practical implications for VGI data quality (Haklay, 2010; Hecht; Kunze; Hahmann, 2013; Camboim; Bravo; Sluter, 2015). Heterogeneity in the positional accuracy of OSM road centerlines directly affects the effectiveness of urban mobility systems (routing applications) (Graser; Straub; Dragaschnig, 2014; Hosseini et al., 2025) and, critically, disaster response logistics (such as landslides and floods), where the precision of alleys and access routes in informal areas is vital (Alcântara et al., 2023; Lima; Freiman; Camboim, 2022; Poiani et al., 2016). In this context, OSM can either reproduce these spatial inequalities, if volunteers preferentially map the “formal city”, or remedy them by providing the only existing detailed mapping of the “informal city,” especially when community and technical initiatives focused on favelas are present (Bortolini; Camboim, 2019; Herfort et al., 2021; Figueiredo; Veríssimo; Franco, 2022; Hallopeau et al., 2025).
In addition to spontaneous data production, OSM also incorporates organized community mapping actions with direct implications for environmental and transportation studies. Initiatives led by the Humanitarian OpenStreetMap Team (Hot) have played a central role in expanding, detailing, and correcting road mapping in peripheral areas and informal settlements traditionally underrepresented in official cartographic databases. These collaborative mappings, often carried out through targeted campaigns (mapathons) and technical validation processes, have proven fundamental for improving road network connectivity, representing road hierarchies, and identifying local access routes, which are critical elements for accessibility analyses, route planning, urban mobility modeling, and environmental and humanitarian emergency response (Haklay, 2010; Hagen, 2016; Poiani et al., 2016; Herfort et al., 2021). In the transportation context, studies indicate that data produced through Hot initiatives significantly increase the completeness and functional reliability of the OSM road network, especially in Global South regions, contributing to more robust assessments of urban mobility, emergency logistics, exposure to environmental risks, and spatial justice analyses (Goodchild; Li, 2012; Mobasheri et al., 2017; Li et al., 2020; Mahabir et al., 2020).
Transportation systems constitute one of the most relevant environmental vectors in cities, accounting for approximately 15% of global greenhouse gas emissions and about 23% of energy-related CO₂, corresponding to approximately 8.9 GtCO₂e in 2019, with an upward trend in the absence of additional policies (IPCC, 2022; IEA, 2024). These impacts strongly depend on urban form and road network connectivity, which influence travel patterns, modal choice, and traffic volumes (Vehicle Miles Traveled – Vmt) (Ewing; Cervero, 2010). In the context of Rio de Janeiro, road traffic and public transportation rank among the main contributors to urban air quality degradation, particularly regarding fine particulate matter (PM₂.₅) concentrations, highlighting the close relationship between mobility, environment, and urban health (C40 Cities, 2022). In this scenario, geocoding errors and planimetric displacements in road network representation can introduce significant biases in environmental exposure analyses based on proximity buffers, reinforcing that positional accuracy and OSM network completeness are fundamental conditions for robust environmental modeling (Lane et al., 2013; Fonte et al., 2017; Li et al., 2020).
In light of the above, this study aims to estimate the heterogeneity of OSM road centerlines in Rio de Janeiro through the evaluation of their positional accuracy. Thus, the article seeks not only to quantify data quality but also to explore its applicability and potential in issues related to urban planning and environmental management, particularly regarding the use of road networks in urban mobility analyses, accessibility assessment, environmental risk exposure studies, and decision support in socially unequal urban contexts. The central question of this article, therefore, is to identify whether there are different relationships between regions with greater or lesser positional discrepancy and how errors are distributed within the complex urban fabric of Rio de Janeiro.
The hypothesis is that VGI data quality is a direct reflection of unequal urban structure: positional accuracy will be significantly higher and more homogeneous in consolidated areas of the “formal city,” while it will be degraded, unstable, and highly heterogeneous in informal settlements, reflecting distinct contribution patterns and possibly differences in the quality of satellite imagery used as a basis for digitization. Additionally, it is assumed that this heterogeneity has direct implications for the reliability of analyses based on transportation networks, particularly those applied to urban environmental management, accessibility assessment, and risk analysis in socially vulnerable areas of Rio de Janeiro.
To achieve the objectives and test the hypothesis, the article is structured as follows: Section 2 addresses the applied methodology. Section 3 presents and discusses the results. Finally, Section 4 concludes by discussing the implications of the findings related to OSM heterogeneity in Rio de Janeiro and points to directions for future research.
- Methodology
The study area used for conducting the analyses was the municipality of Rio de Janeiro–RJ. According to data from the IBGE Demographic Census, the resident population of the municipality was 6,211,223 inhabitants (IBGE, 2022a), with an area of 1,200.330 square kilometers (IBGE, 2022b). The reference features corresponded to the official cartography produced by the Instituto Pereira Passos (IPP), which is responsible for managing and providing the municipality’s reference mapping. Its collection includes maps at scales of 1:2,000, 1:5,000, and 1:10,000 (IPP, 2025). Accordingly, the vector files composing the road centerlines were extracted. These data were originally produced in 2013, updated using orthophotos in 2019, and published in 2021, at a scale of 1:2,000 (IPP, 2021). Figure 1 shows the location map of the municipality of Rio de Janeiro-RJ.
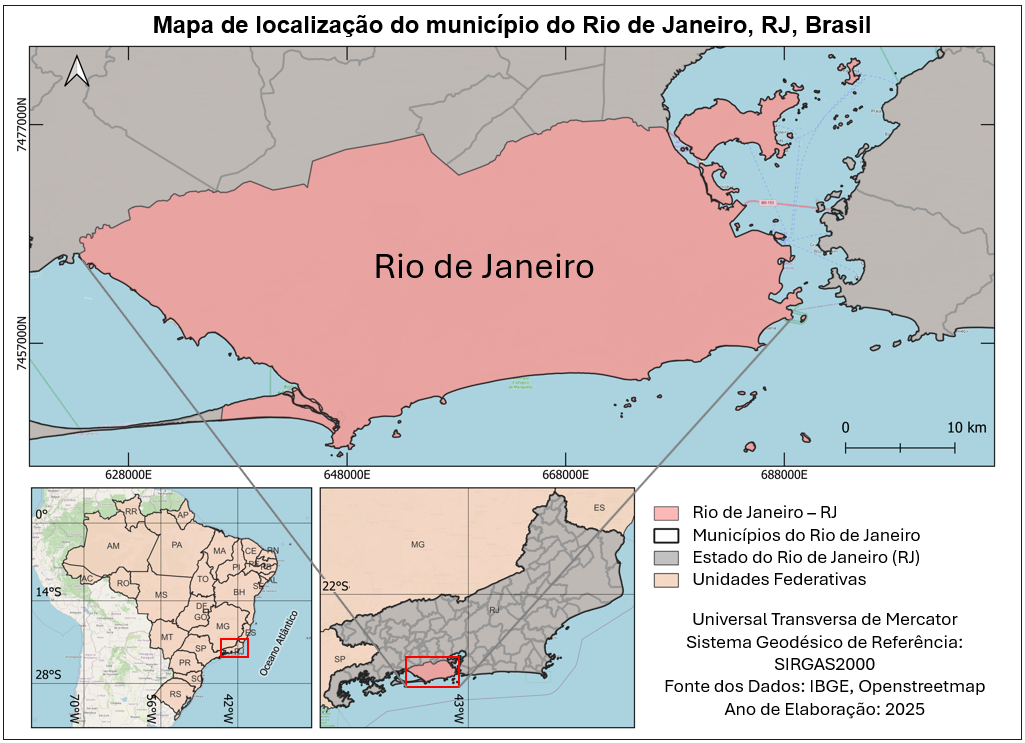
Figure 1: Location map for Rio de Janeiro
Source: The authors (2025)
To proceed with the acquisition of OSM features, it was first important to understand how contributions occur and how they are stored. In this context, a given category of features is characterized by a tag, which is assigned through a key and a value. In addition, OSM has a documentation platform called WikiOSM, characterized as a collaborative repository that describes and standardizes the use of tags based on its geometric primitives of points, lines, and polygons, as well as describing tools, plugins, and instructions to be employed in the editing process (OpenStreetMap Wiki, 2025). Contributions to OSM occur through its official editors. The iD Editor is the online tool available directly on the OSM[2] website, through a simple interface in which the user registers and begins editing. JOSM may also be used; this is a more advanced editor in which edits are carried out through software that allows specific and complex mapping, validation processes, and data import (OpenStreetMap Wiki, 2025; JOSM, 2025).
In the case of road centerlines (the focus of this study), the tag used corresponded to the key highway, and the values were characterized according to the classification corresponding to terrestrial roads. Table 1 exemplifies a tag with the key highway and the value motorway.
Table 1: Characterization of the tag with key highway and value motorway.
Key | Value | Description | Design |
highway | motorway | A motorway (in Brazil, via expressa when compliant with Dnit standards) is a road with restricted access for motorized vehicles and designed for high speeds, usually subject to toll payment, with two or more traffic lanes and one shoulder/hard shoulder lane, featuring a central divider (guardrails, concrete barriers, or a simple earthen strip), with no at-grade intersections (crossings with other motorized roads, railway crossings, pedestrian crossings, etc.) or obstructions (traffic lights, speed bumps/humps, and other traffic-calming devices, etc.). Intersections with other roads are grade-separated through tunnels or bridges; therefore, traffic lights are not used. | 
|
Source: Adapted from OpenStreetMap Wiki (2025)
To obtain the highways, the QuickOSM plugin, version 2.2, available in the QGIS 3.34.8 software, was used. This plugin allows filtering specific tags and clipping features within user-defined areas. Thus, the vector files composing the road centerlines from IPP and OSM were loaded into QGIS 3.34.8 so that the analyses could be carried out. The features were extracted on October 7, 2025, and correspond to all highways available in the OpenStreetMap (OSM) database from its creation up to the date of data collection. These data were obtained through the QuickOSM plugin, version 2.2, integrated into QGIS 3.34.8, which allows querying and downloading OSM information directly within the GIS environment. This plugin facilitates the selection of features by type, tag, or area of interest, automating the data request and import process into the project.
Subsections 2.1 and 2.2 present the methods employed for positional accuracy assessment, data heterogeneity verification, and the geospatial application developed.
2.1 Planimetric Positional Accuracy Assessment
For the evaluation of positional accuracy, point features representative of intersections between road segments and of the vertices composing the road centerlines were considered. The identification of homologous features was carried out manually in QGIS 3.34.8 through a systematic visual analysis that compared the reference dataset with data derived from OSM. This procedure involved overlaying the two datasets and individually inspecting each intersection and vertex, ensuring that the selected points corresponded to the same road structures. The identified features were then manually recorded through the creation of point vector files, which served as the basis for positional accuracy analyses. The final classification was based on the Cartographic Accuracy Standard for Digital Cartographic Products (PEC-PCD), established by the Technical Specification for the Acquisition of Vector Geospatial Data (ET-ADGV) (Brasil, 2018). The PEC-PCD consists of an update of Decree No. 89.817 - Technical Standards for National Cartography (Brasil, 1984), which was formerly referred to as PEC. Table 2 presents the values established in the PEC and the planimetric PEC-PCD, as well as the associated Standard Error.
Table 2: Cartographic accuracy standard for digital cartographic products and respective standard error
PEC (1984) | PEC-PCD (2018) | Planimetric PEC | Planimetric Standard Error | PEC (1984) |
| A | 0,28 mm x Scale Denominator | 0,17 mm x Scale Denominator | 0,28 mm x Scale Denominator |
A | B | 0,5 mm x Scale Denominator | 0,3 mm x Scale Denominator | 0,5 mm x Scale Denominator |
B | C | 0,8 mm x Scale Denominator | 0,5 mm x Scale Denominator | 0,8 mm x Scale Denominator |
C | D | 1,0 mm x Scale Denominator | 0,6 mm x Scale Denominator | 1,0 mm x Scale Denominator |
Source: Adapted from Brasil (2018)
In the PEC-PCD, cartographic products are classified according to classes A, B, C, and D. Class A corresponds to the highest level of rigor in the evaluation, while class D represents the lowest. These classes are linked to the product scale and allow its classification based on the maximum error obtained from discrepancies in a sample of points. For each class, a defined PEC-PCD value exists, associated with a Standard Error (SE), which corresponds to 60.8% of that value. The SE is derived from a statistical indicator based on the normal distribution, considering 90% confidence (Brasil, 1984; 2018).
In 2015, DSG established the ET-CQDG (Brasil, 2015), which brings together methodologies for assessing the quality of reference mapping. With regard to positional accuracy, the standard provides for the calculation of Euclidean Distances (ED) obtained between homologous points of the reference product and the analyzed product. Based on these ED values, to determine the classification of the product at a specific scale, two conditions are verified: whether 90% of the ED values are less than or equal to the corresponding PEC-PCD, and whether the Root Mean Square Error (RMSE) is less than or equal to the SE defined for the class and scale presented in Table 1. These conditions were used to carry out the analyses.
For the selection of the sample size, the criteria of Galo and Camargo (1994) and Merchant (1982) were adopted, which define that 20 point features are sufficient to obtain the positional accuracy of an area. In this context, a study conducted by Fernandes, Alixandrini Junior, and Elias (2015), based on sampling criteria presented by Nogueira Jr. (2003), showed that the sample size of point features tends to remain constant between 20 and 24 point features as the size of the study area increases. In this context, with the objective of estimating positional accuracy and analyzing heterogeneity, six sample sets were obtained, each composed of 20 features. The selection of these samples was carried out by three different users, each of whom randomly selected two samples, totaling the six analyzed sets. It is emphasized that the selection process was conducted in an unbiased manner, with no prior guidance regarding specific areas or territorial characteristics. The resulting samples were distributed throughout the municipality of Rio de Janeiro, covering different types of urban fabrics, both formal and informal.
2.2 Development of a Geospatial Application
After the selection of homologous features and the grouping of the different samples, the calculation of the PEC-PCD for each of them was based on the development of a plugin in QGIS 3.34.8. This plugin is characterized as an update and improvement of the QPEC toolset (Elias et al., 2023). Regarding the evaluation of positional accuracy of point features, QPEC was based on queries using SQL-like programming language and processes grouped in the QGIS 3.34.8 graphical modeler, so that the script could later be exported. In this context, the data input consisted of inserting reference features and evaluated features, and the result was presented in the attribute table with the minimum PEC-PCD class accepted for each of the Brazilian Systematic Mapping (BSM) scales (1:1,000, 1:2,000, 1:5,000, 1:10,000, 1:25,000, 1:50,000, 1:100,000, and 1:250,000) (Brasil, 2015, 2018). If, at the evaluated scale, the feature was not accepted in any class, the message “Rejected” was displayed.
Based on these aspects and aiming to improve the tool, new conditions were included for the execution of the analyses. Among the improvements, the possibility was added for the user to directly indicate the attribute table fields of the input layers that should be used to identify homologous points. Configuration options for result visualization were also incorporated. Thus, if the user wishes to query the data at a specific scale, it is sufficient to enter the value in the field “Enter the desired scale denominator”. Alternatively, if the user prefers to view the results for all scales provided by the BSM, this can be done by selecting the option “Display results for all BSM scales”.
Finally, the tool was converted into a QGIS plugin, allowing the user to integrate it directly into the Processing Toolbox. With this adaptation, the resource ceased to be an isolated script and began to operate as an installed module. Figure 2 presents the plugin inserted into the toolbox (red) and the adjustments to the data input fields (blue). Thus, Figures 3 and 4 present the pseudocode for the query performed by the plugin and for the criteria used to evaluate the accepted class according to the PEC-PCD. The plugin then performs the matching of homologous features through a join on the identifying attributes provided by the user, computes the set of Euclidean discrepancies (DE) for each homologous feature (fi) and the RMSE of the set, and stores the computed values. To compute the Euclidean discrepancies, the planimetric differences (ΔX and ΔY) are evaluated for each fi.
The option to display results for all scales provided by the BSM differs mainly by diverting to an execution loop that determines the accepted class for each scale in the BSM (Figure 3). If a class is approved for a given evaluated scale, the approved class is stored and the remaining classes at the same scale are no longer evaluated. If no class is approved for the evaluated scale, the result “rejected” is stored. Alternatively, when the user wishes to detail the evaluation of classes for a specified scale, the return results (Figure 4) are directly stored for each evaluated class. The metric constants shown in Table 1 and the scale denominator are passed to the evaluation routine as arguments so that any scale can be computed.
Figure 2: Improvements to the QPEC plugin.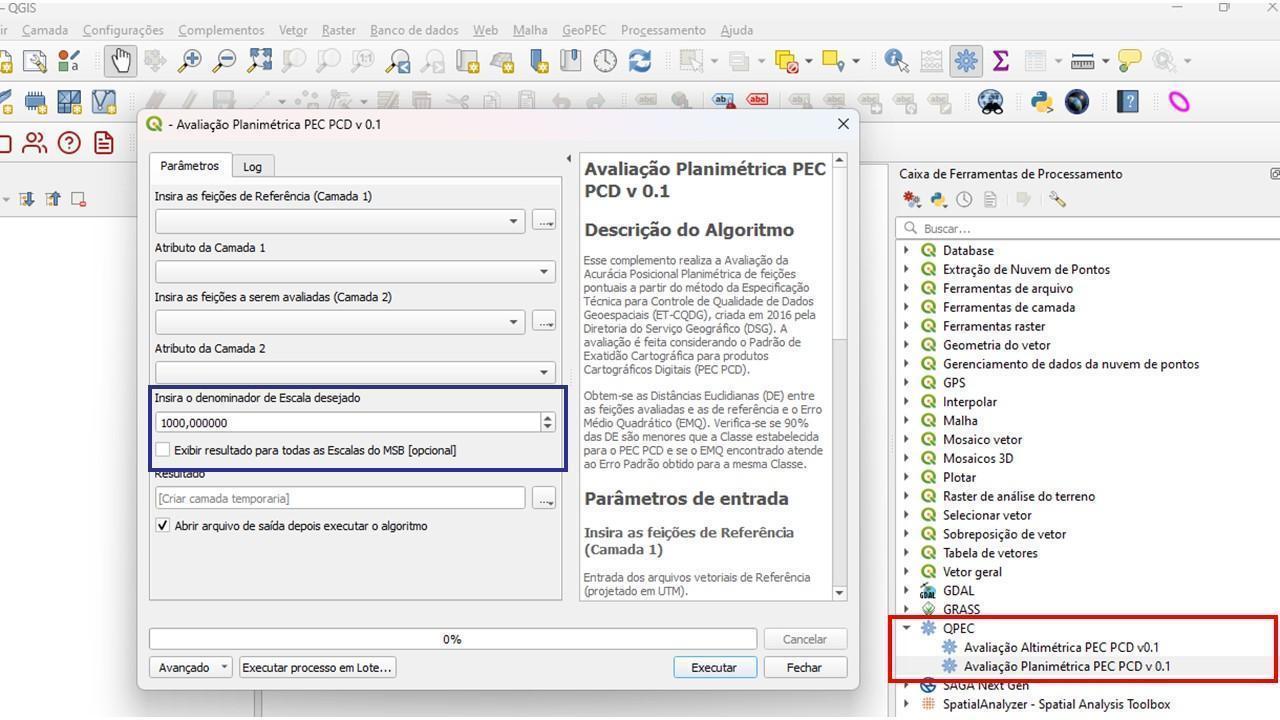
Source: The authors (2025)
As the results stored in Ac include the ED and RMSE values (rms, in Figures 3 and 4) used to define the PEC-PCD, an automatic symbology based on the classification of Euclidean Distances into four quartiles (Q1, Q2, Q3, and Q4) was incorporated. When the stored results are displayed, each quartile receives a distinct color, automatically applied to the evaluated features. The color scale follows a progressive gradient, in which darker tones represent greater discrepancies, allowing a direct visual interpretation of the distribution of errors in the analyzed set. Maps with the results are presented in Section 3. The QGIS plugin is available on GitHub (Elias, 2025). The repository provides a .zip file, which can be downloaded and installed in QGIS via the option “Install from ZIP file” in the plugin manager.
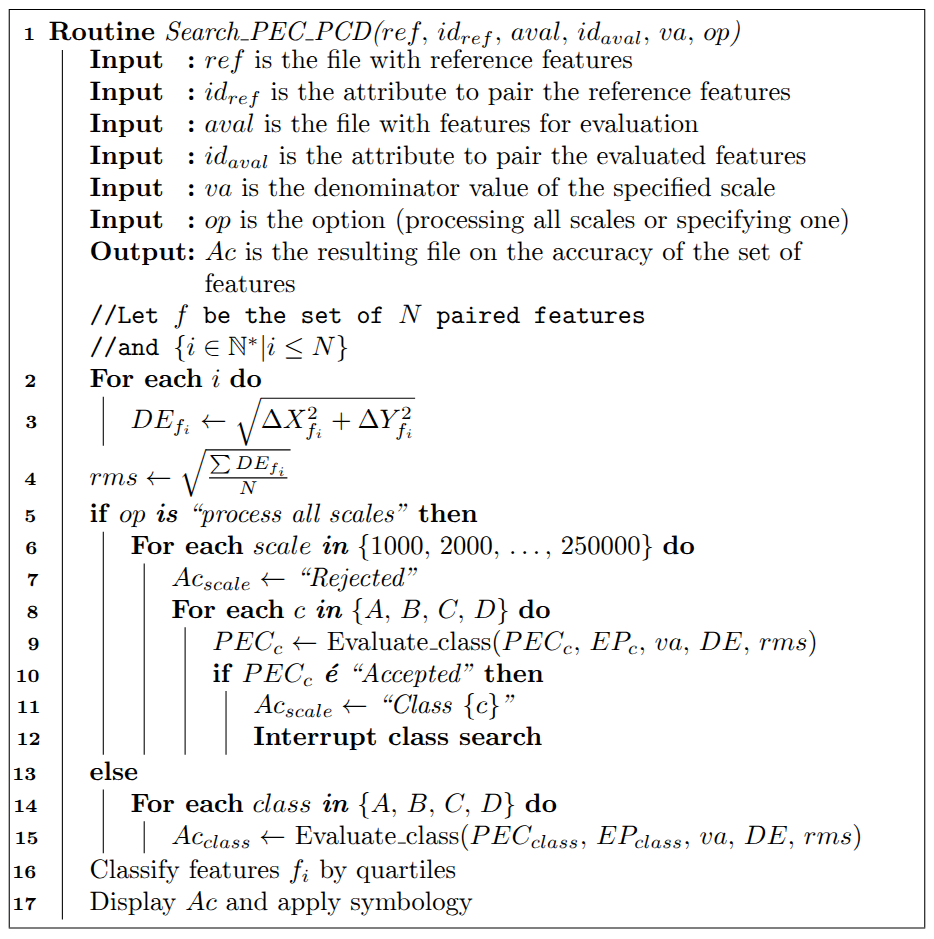
Figure 3: Pseudocode for executing the plugin based on the selection of all BSM scales.
Source: The authors (2025)
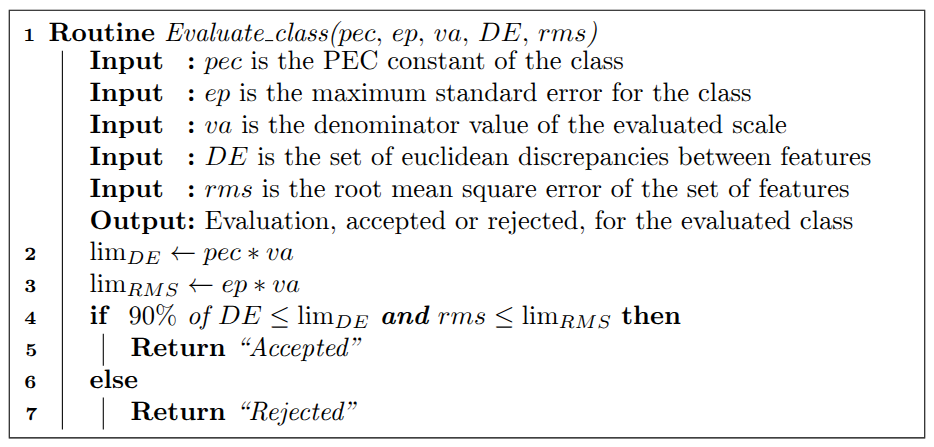
Figure 4: Pseudocode for executing the plugin based on the insertion of a specific scale.
Source: The authors (2025)
- Results and Discussion
Based on the analyses carried out, the maps in Figures 5, 6, 7, 8, 9, and 10 display the distribution of the sample sets within the study area, as well as the quartile results obtained from the application of QPEC. Subsections 3.1, 3.2, and 3.3 present the discussion of the results obtained.
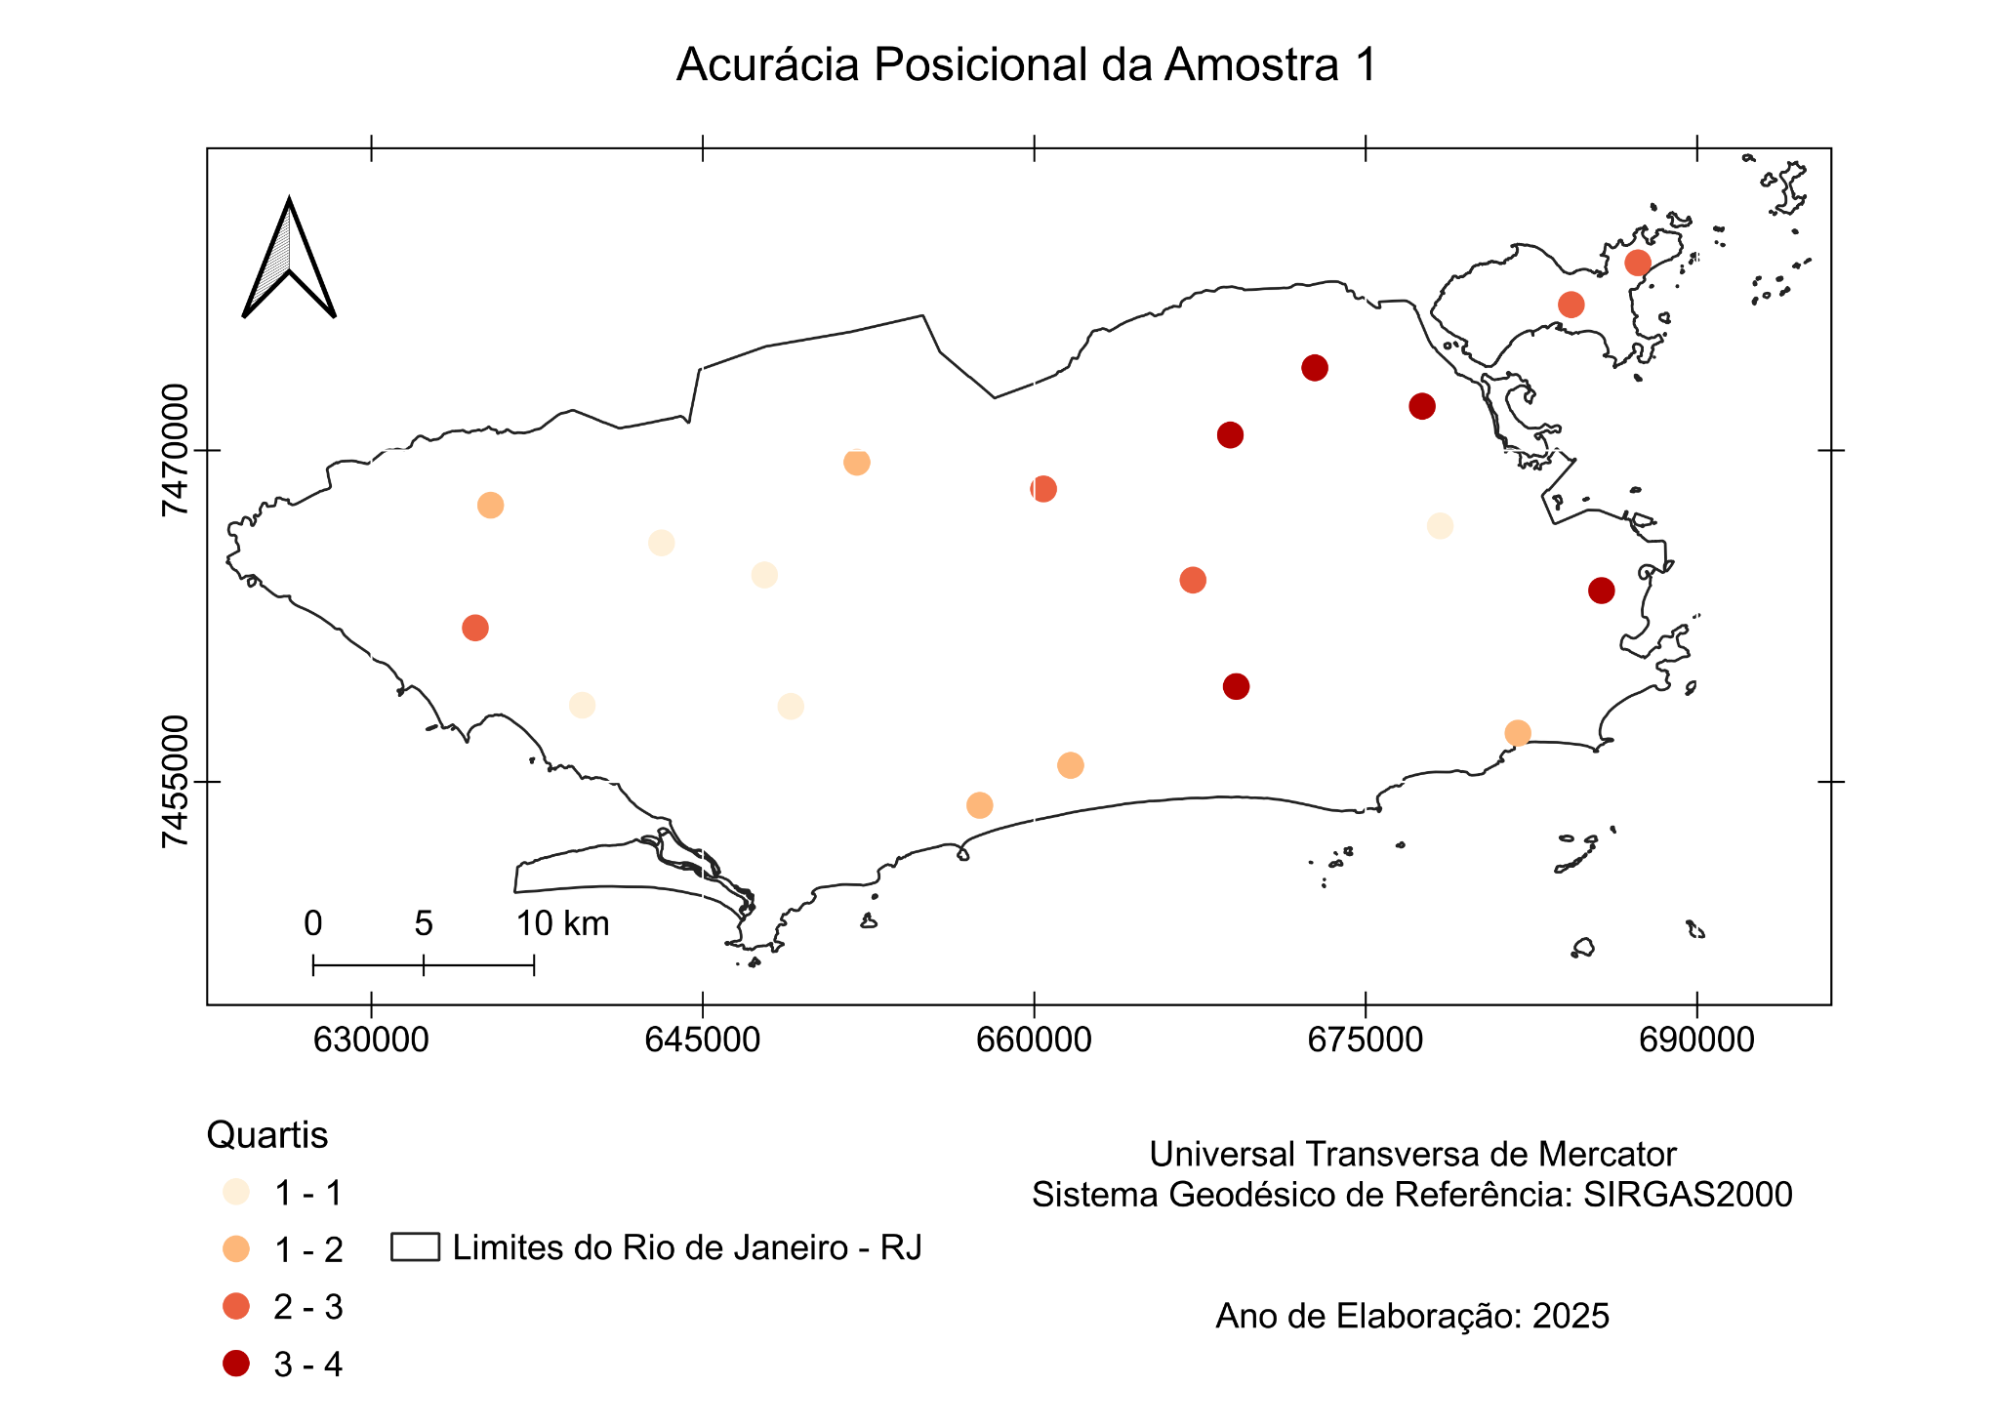
Figure 5: Distribution of point features from Sample 1.
Source: The authors (2025)
Figure 6: Distribution of point features from Sample 2.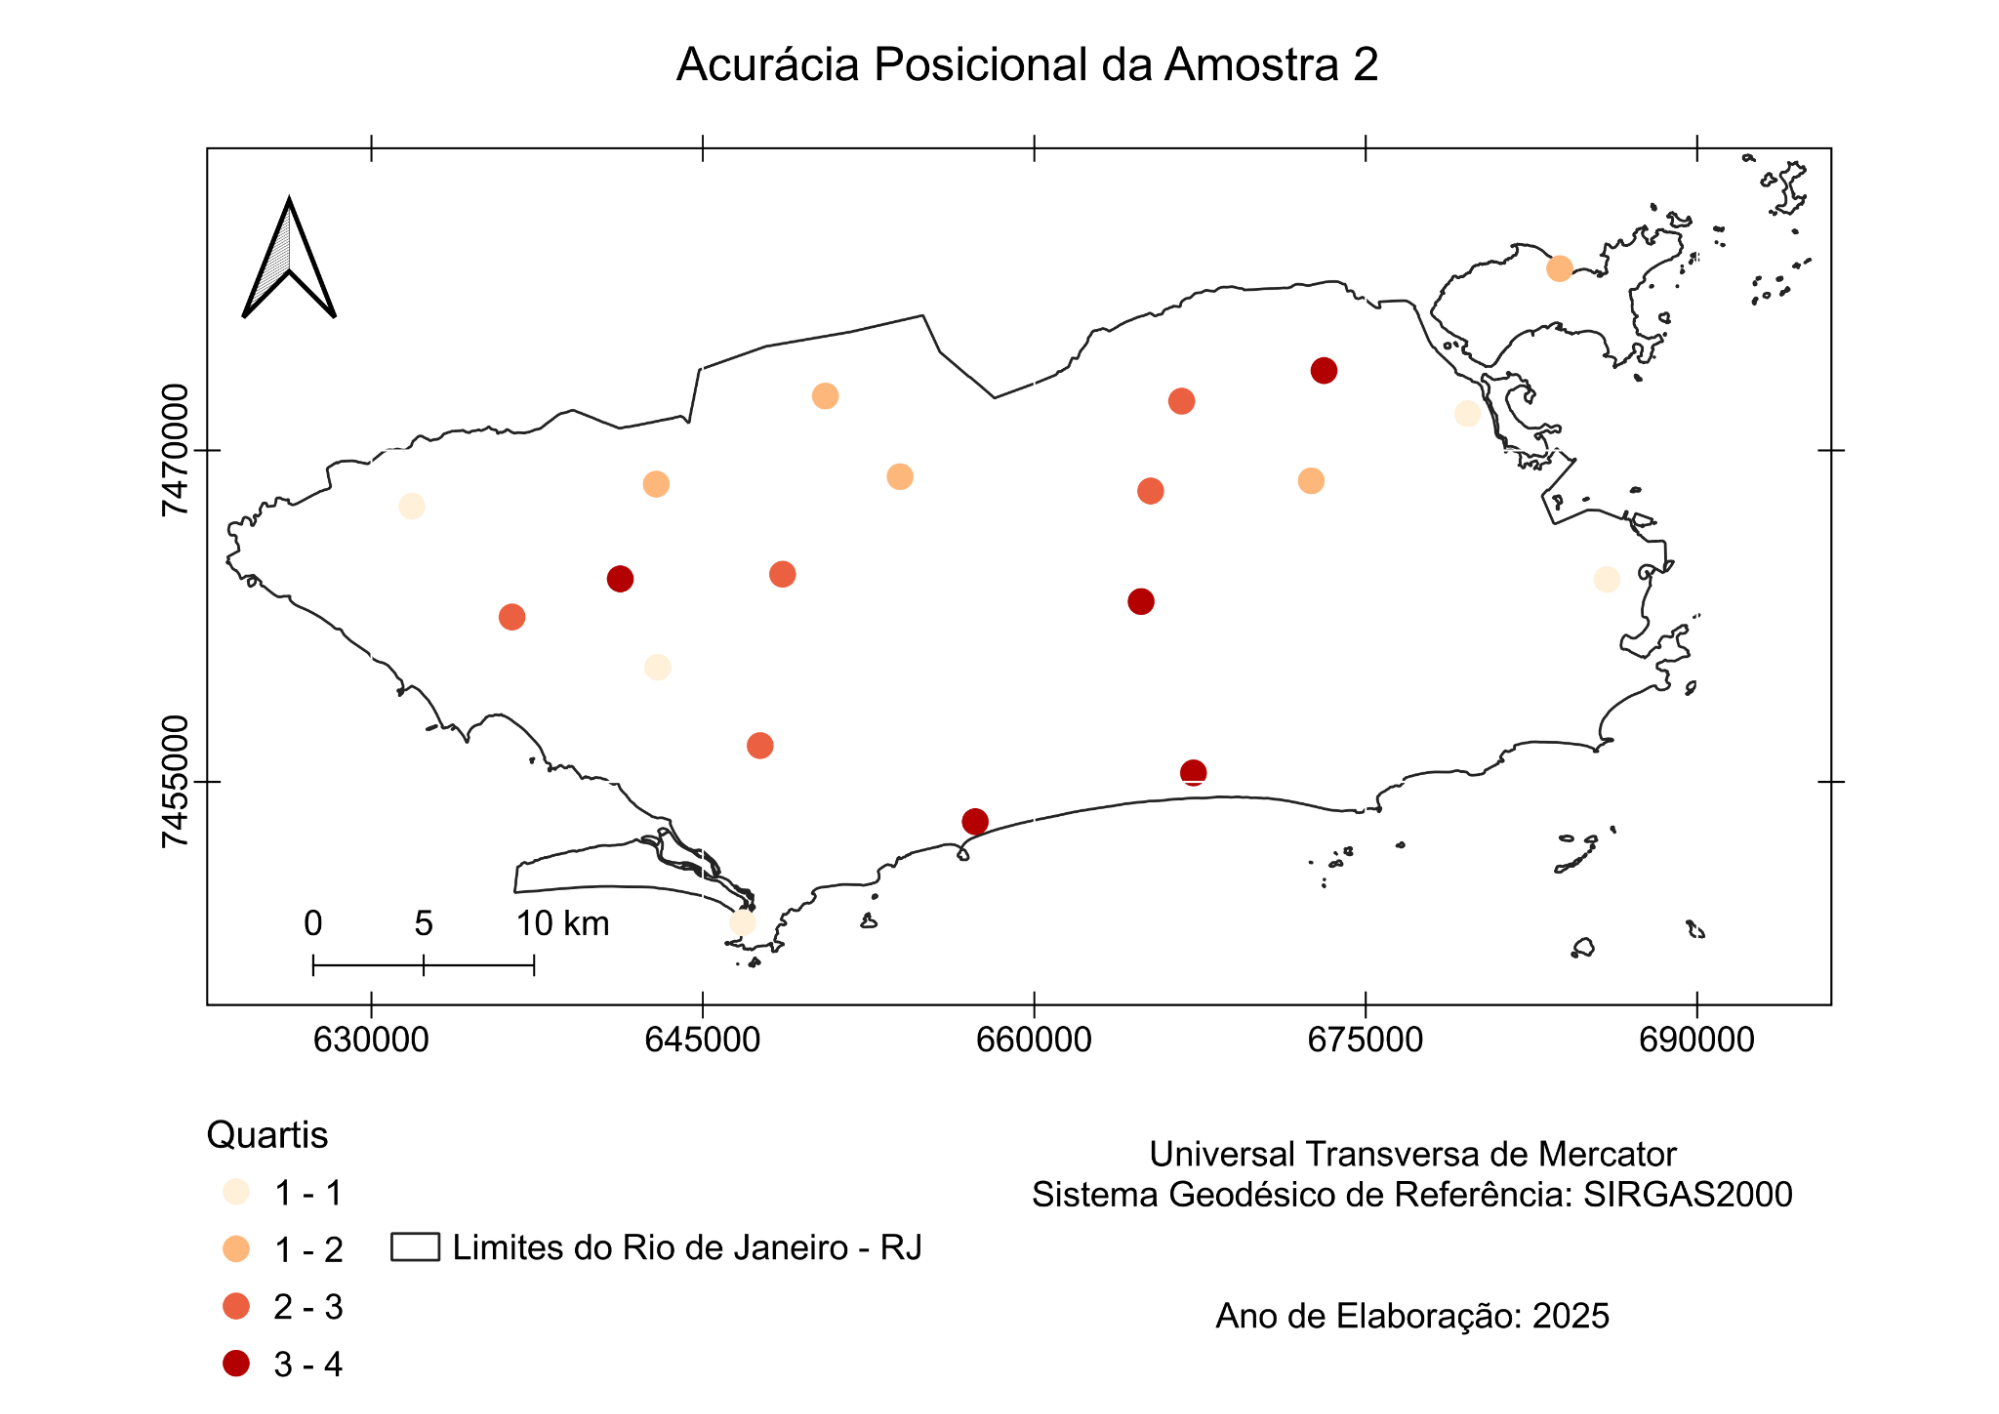
Source: The authors (2025)
Figure 7: Distribution of point features from Sample 3.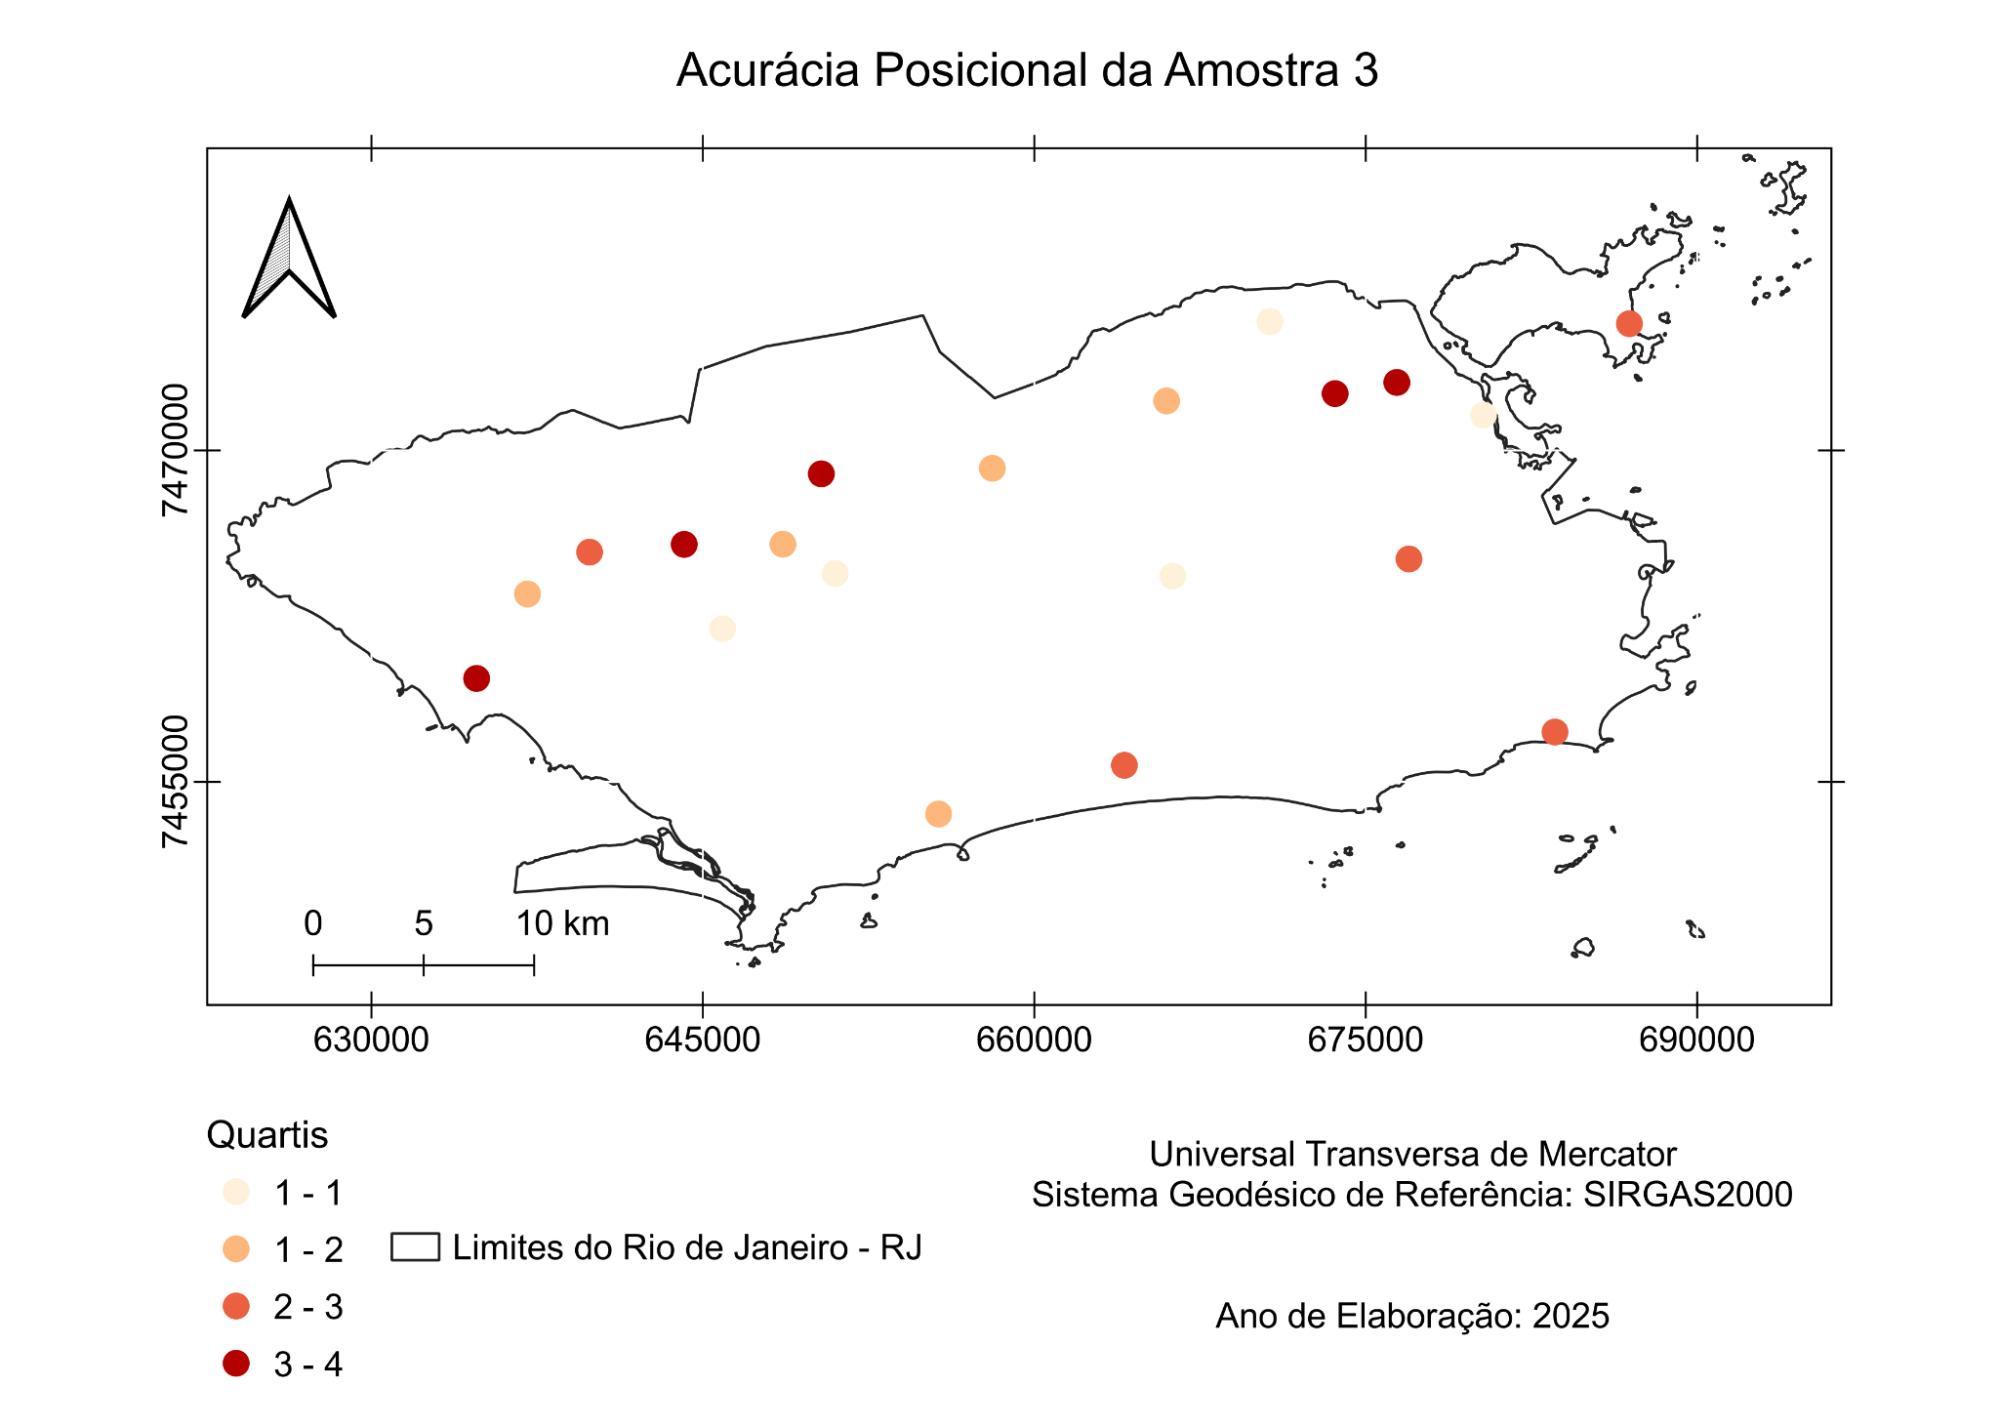
Source: The authors (2025)
Figure 8: Distribution of point features from Sample 4.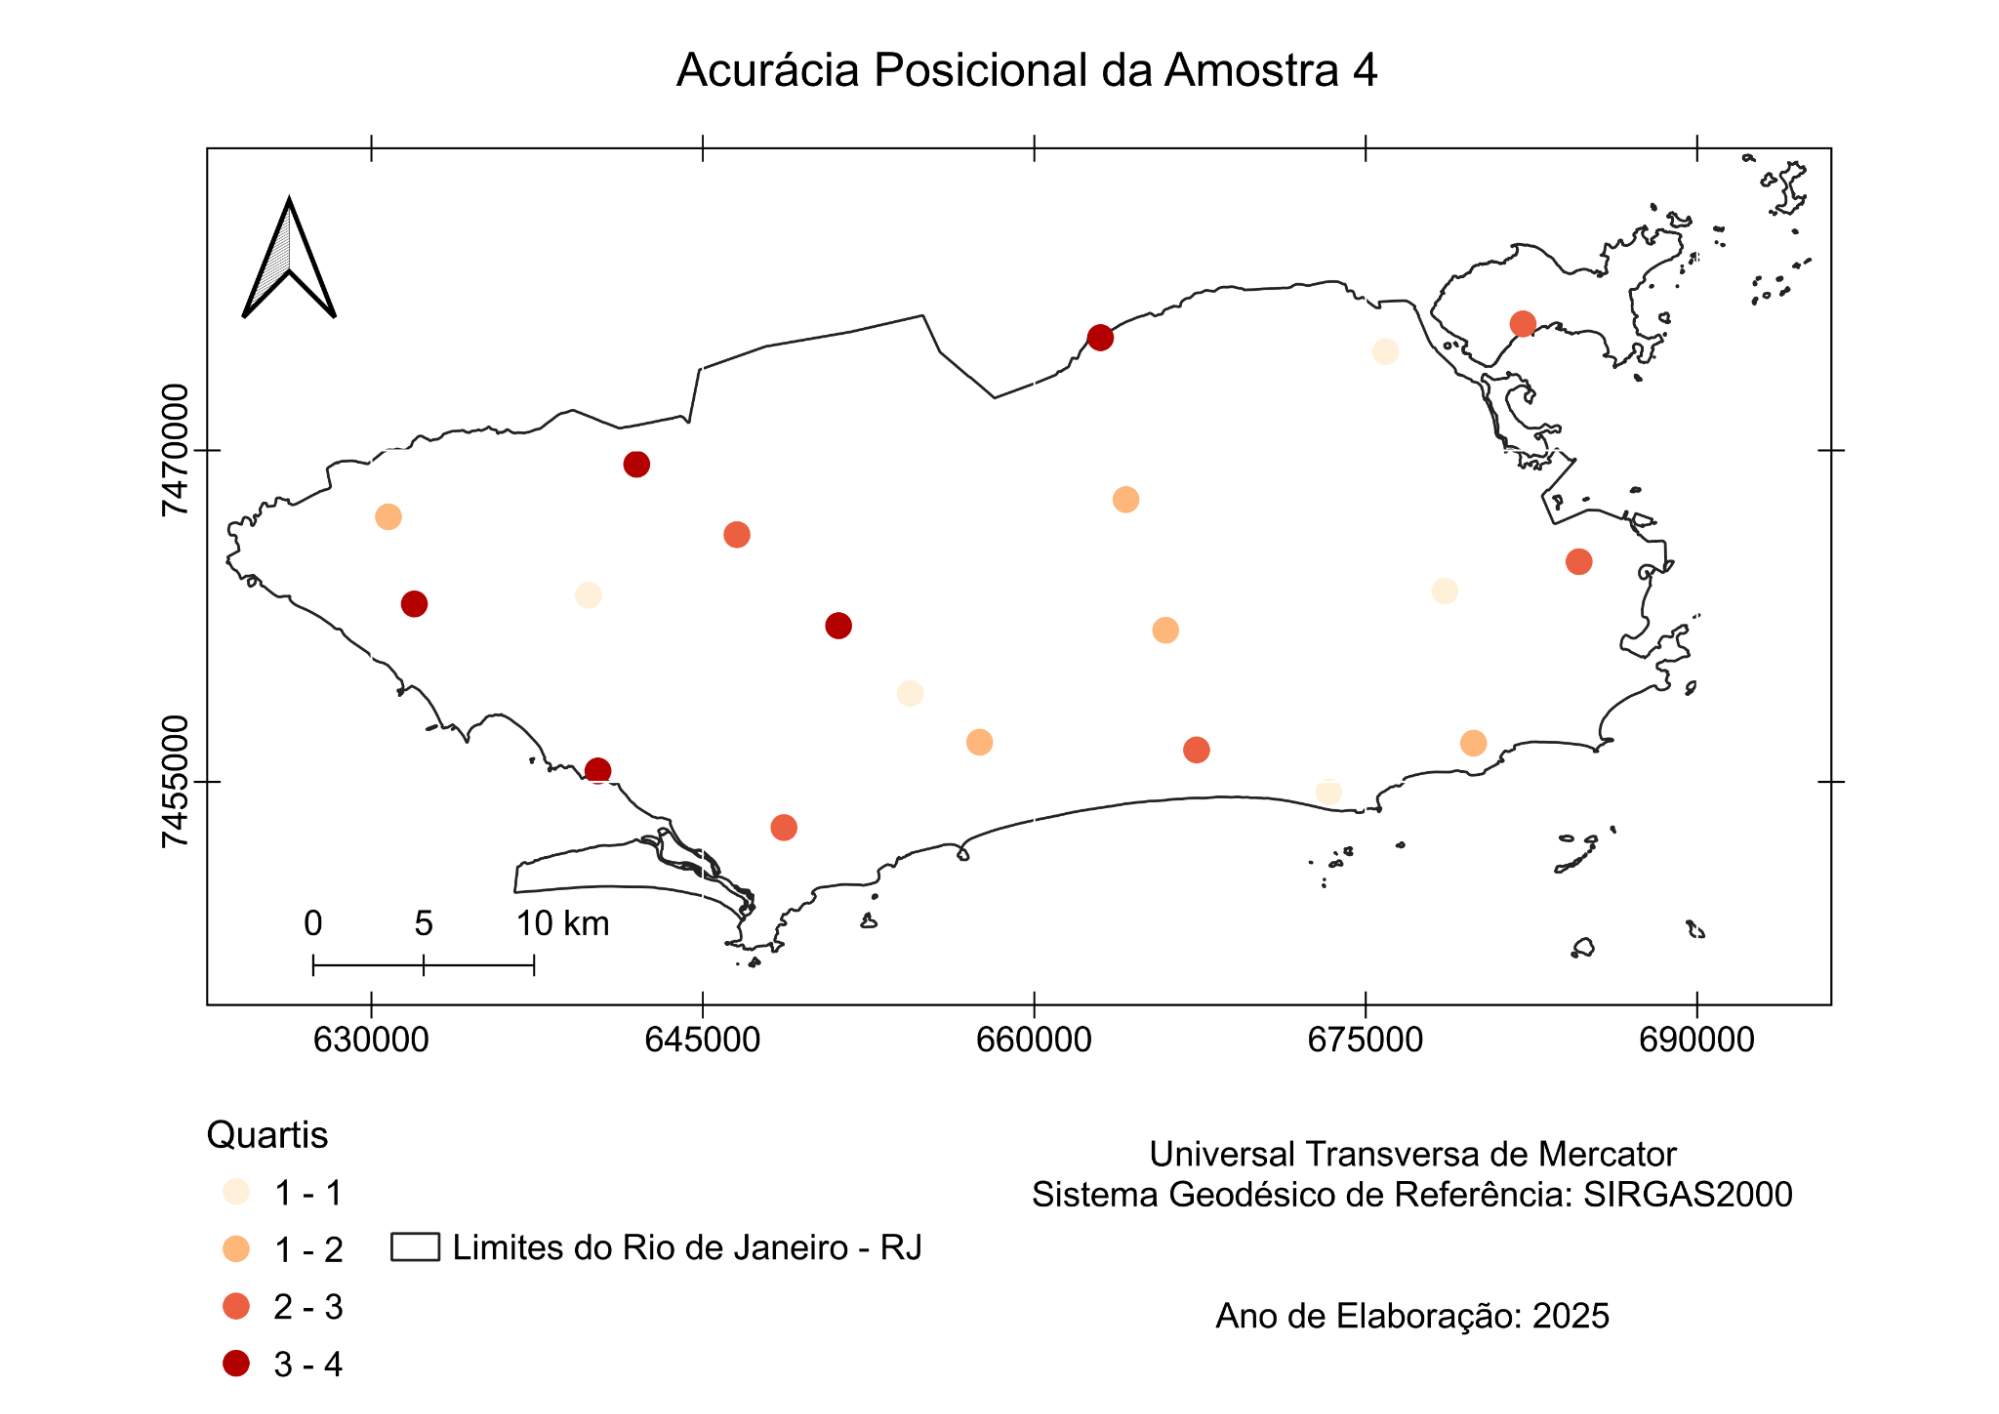
Source: The authors (2025)
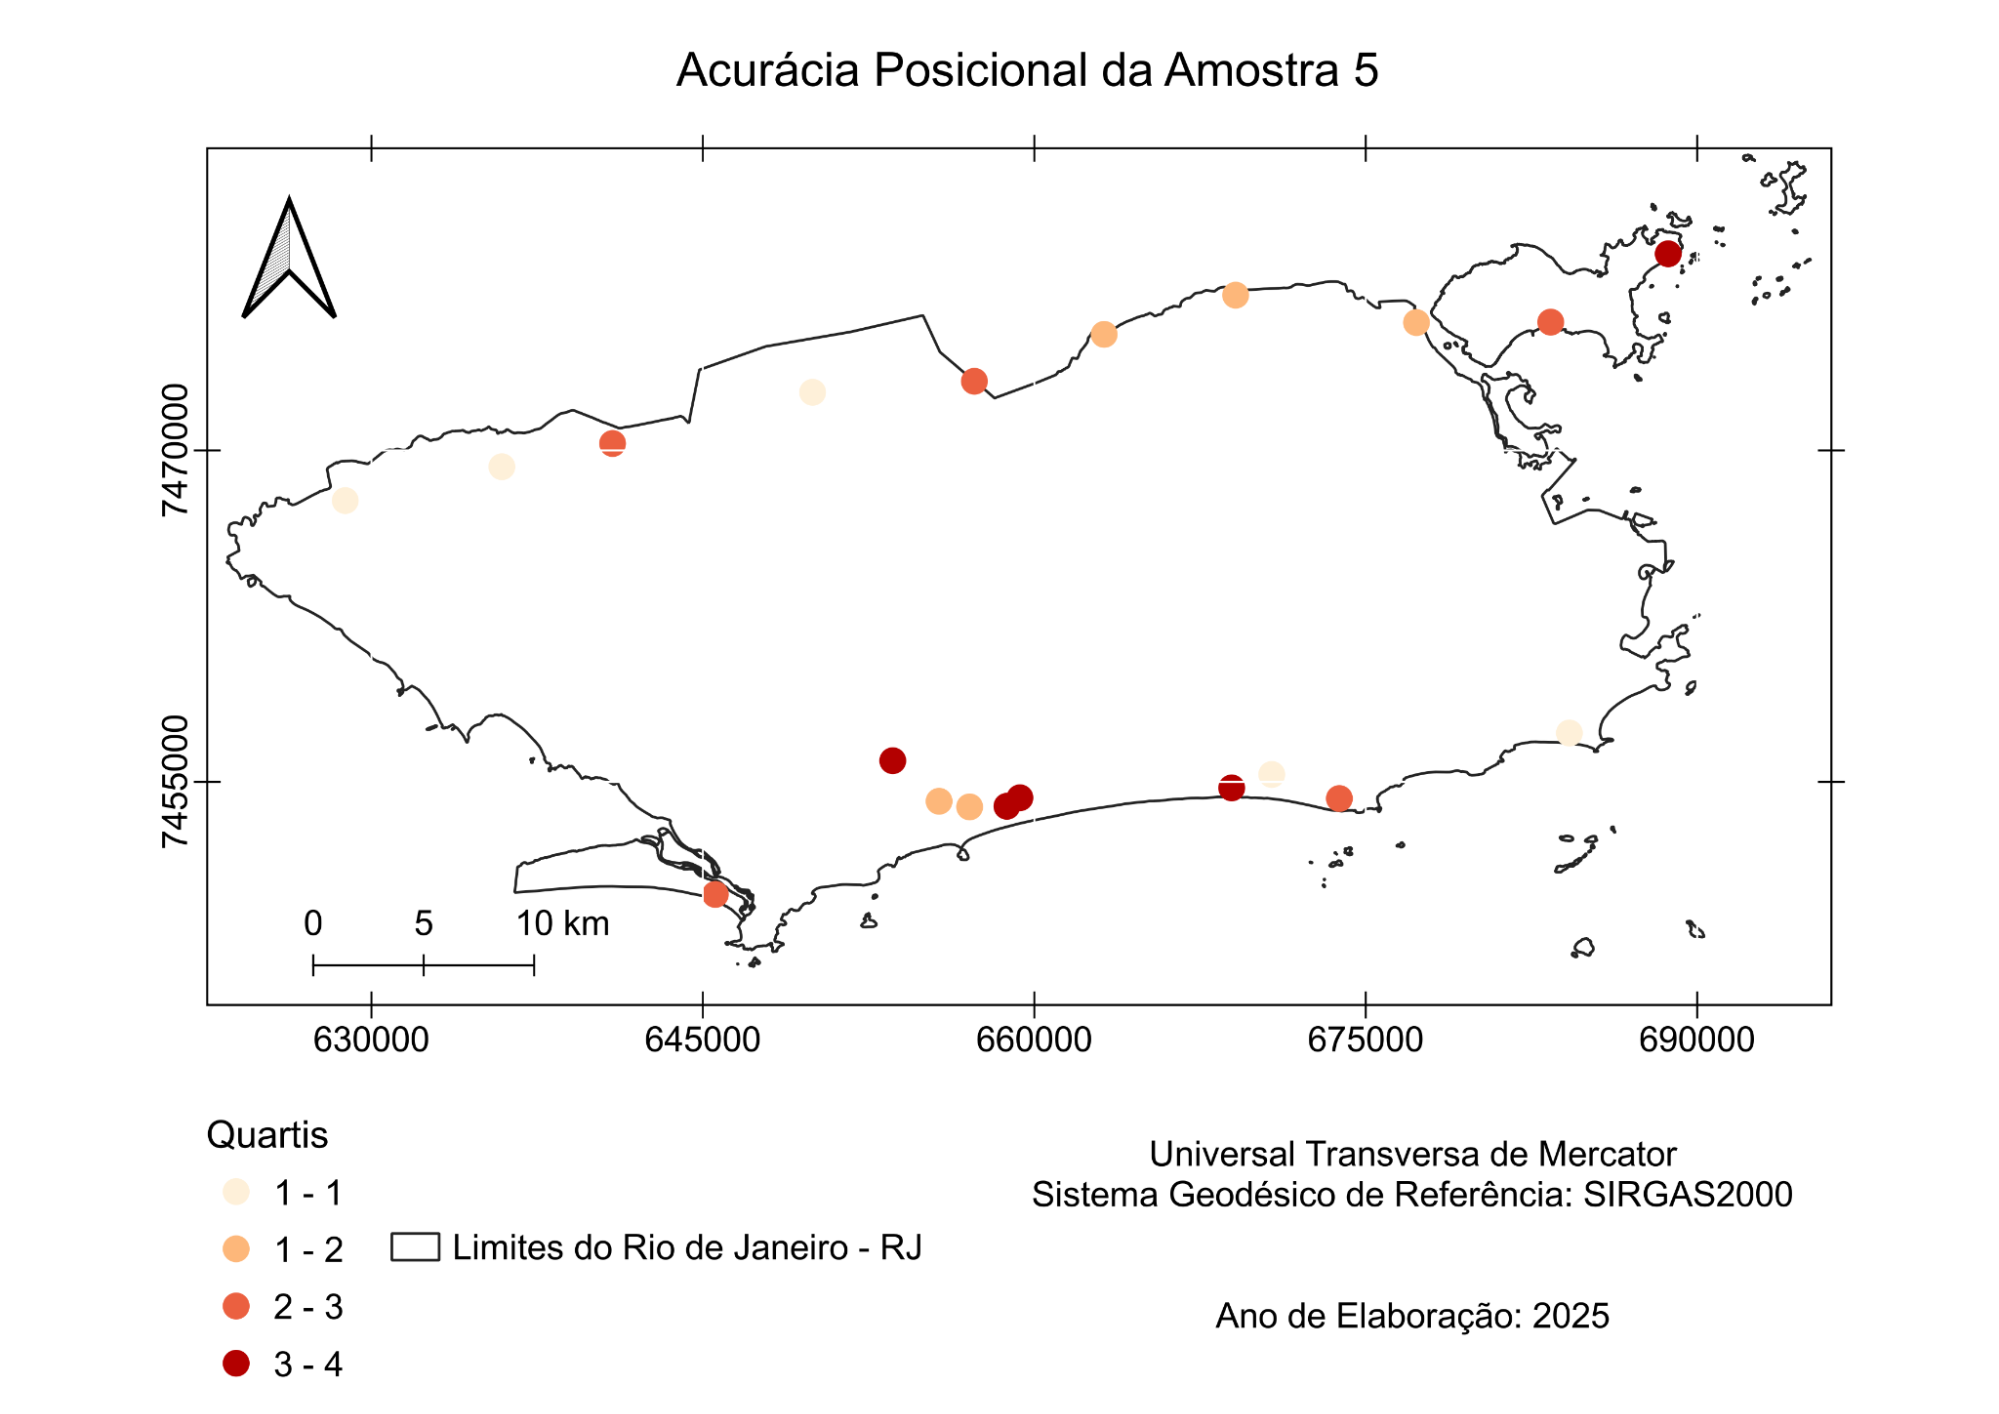
Figure 9: Distribution of point features from Sample 5.
Source: The authors (2025)
Figure 10: Distribution of point features from Sample 6.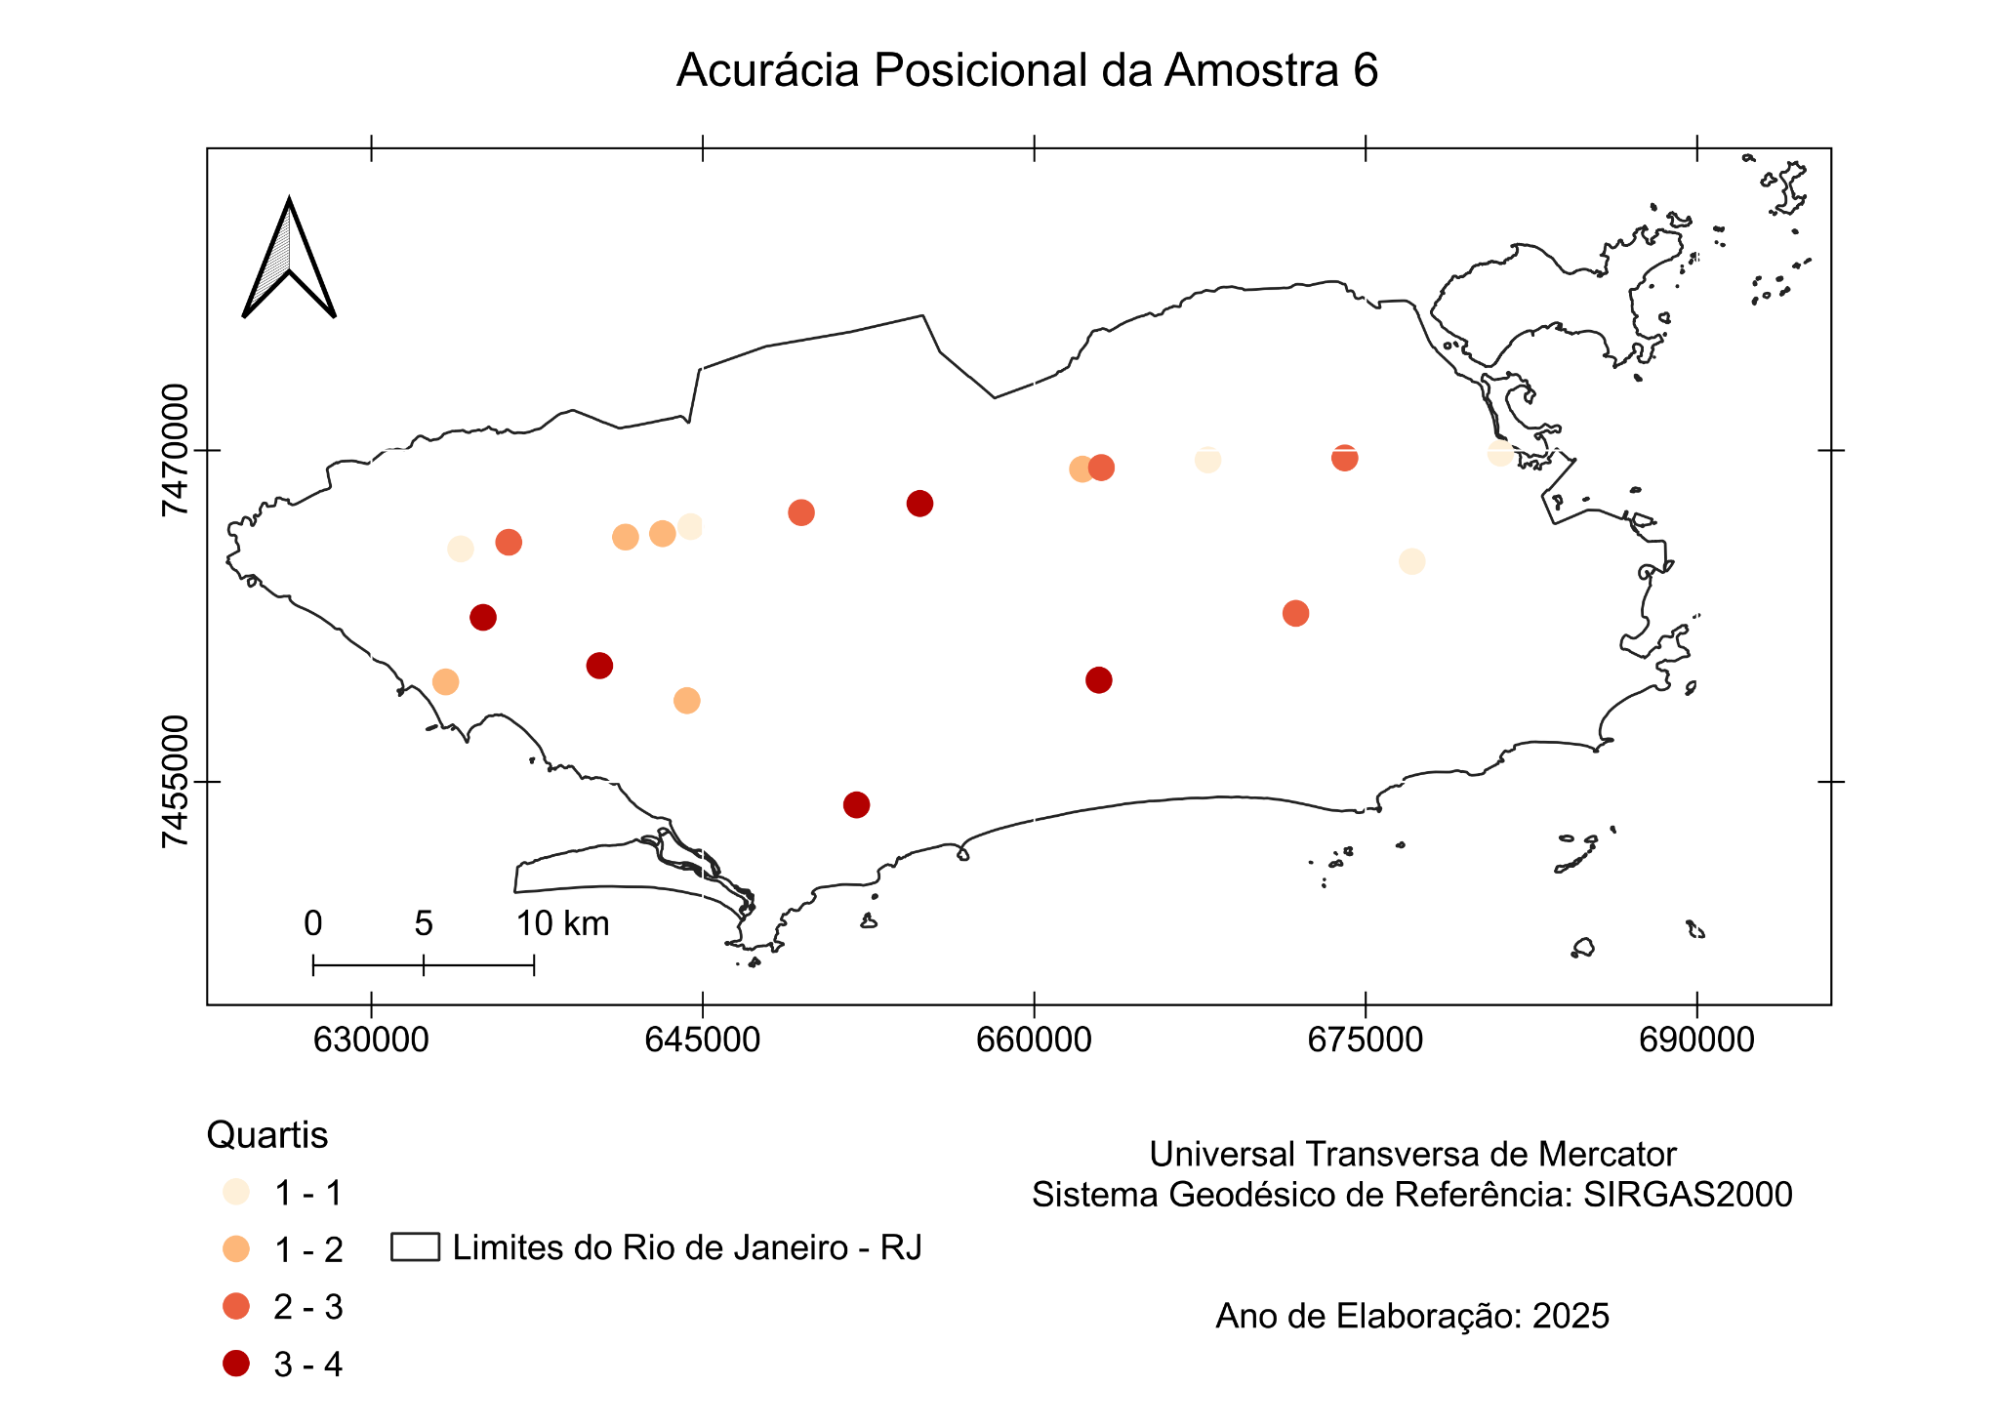
Source: The authors (2025)
3.1. Aggregated Statistical Analysis and PEC-PCD Classification
Tables 3 and 4 present, respectively, the descriptive statistics of the calculated Euclidean Distances (ED) and the classification of results according to PEC-PCD for each sample. In addition, Table 5 presents the quartile subdivision intervals obtained by applying the QPEC plugin. It is observed that, with the notable exception of Sample 6, the Root Mean Square Error (RMSE) remained within a relatively consistent range, varying between 2.53 m (Sample 2) and 2.92 m (Sample 3). Sample 6 stands out for presenting both the highest RMSE (3.79 m) and the largest maximum discrepancy recorded (9.07 m).
The results show that, for five of the six samples (1, 2, 3, 4, and 5), OSM data in Rio de Janeiro fall into Class A at the 1:25,000 scale and Class D at the 1:5,000 scale. This is a relevant finding, as it anchors the OSM product to an official quality standard of the Brazilian Systematic Mapping, indicating its potential for use at less detailed scales.
Additionally, the error scatter plots in Figure 9 allow for an analysis of sample trend (bias). Visually, no systematic bias is identified, such as a displacement of the entire dataset toward a specific quadrant (e.g., northeast). Errors, although of varying magnitudes, are distributed around the origin (0,0), suggesting that discrepancies are mostly random in nature (imprecision) rather than a systematic registration error between the OSM and IPP datasets.
The aggregated results establish a baseline: OSM in Rio de Janeiro generally exhibits positional quality compatible with Class A at 1:25,000. However, these values mask significant statistical and spatial variations between and within samples, which demonstrate data heterogeneity and are the focus of subsection 3.2.
Table 3: Descriptive statistics of Euclidean Discrepancies (ED) and Root Mean Square Error (RMSE) by sample
Sample | minimum (ED) (m) | Maximum (ED) (m) | mean (ED) (m) | median (ED) (m) | RMSE (m) |
Sample 1 | 0,25 | 5,88 | 2,36 | 2,57 | 2,66 |
Sample 2 | 0,62 | 5,41 | 2,25 | 2,47 | 2,53 |
Sample 3 | 0,16 | 7,11 | 2,34 | 1,68 | 2,92 |
Sample 4 | 1,09 | 7,41 | 2,40 | 2,15 | 2,80 |
Sample 5 | 0,58 | 5,13 | 2,63 | 2,69 | 2,88 |
Sample 6 | 0,84 | 9,07 | 3,11 | 2,24 | 3,79 |
Source: The authors (2025)
Table 4: Sample classification according to the Cartographic Accuracy Standard (PEC-PCD) by class and scale
Sample | Class A | Class B | Class C | Class D |
Sample 1 | 1:25.000 | 1:10.000 | - | 1:5.000 |
Sample 2 | 1:25.000 | 1:10.000 | - | 1:5.000 |
Sample 3 | 1:25.000 | 1:10.000 | - | 1:5.000 |
Sample 4 | 1:25.000 | 1:10.000 | - | 1:5.000 |
Sample 5 | 1:25.000 | 1:10.000 | - | - |
Sample 6 | 1:25.000 | - | 1:10.000 | 1:5.000 |
Source: The authors (2025)
Table 5: Distribution of Euclidean Discrepancies (ED) into quartiles by sample
Sample | Quartile 1 (m) | Quartile 2 (m) | Quartile 3 (m) | Quartile 4 (m) |
Sample 1 | 0,25 - 1,37 | 1,39 - 2,54 | 2,61 - 2,88 | 2,96 - 5,88 |
Sample 2 | 0,62 - 1,29 | 1,30 - 2,43 | 2,52 - 2,74 | 2,99 - 5,41 |
Sample 3 | 0,16 - 1,11 | 1,20 - 1,62 | 1,75 - 3,58 | 3,80 - 7,11 |
Sample 4 | 1,09 - 1,23 | 1,39 - 2,12 | 2,18 - 2,53 | 3,11 - 7,41 |
Sample 5 | 0,58 - 1,87 | 1,96 - 2,67 | 2,24 - 3,61 | 3,33 - 5,13 |
Sample 6 | 0,84 - 1,56 | 1,82 - 2,23 | 2,71 - 3,05 | 4,44 - 9,07 |
Source: The authors (2025)
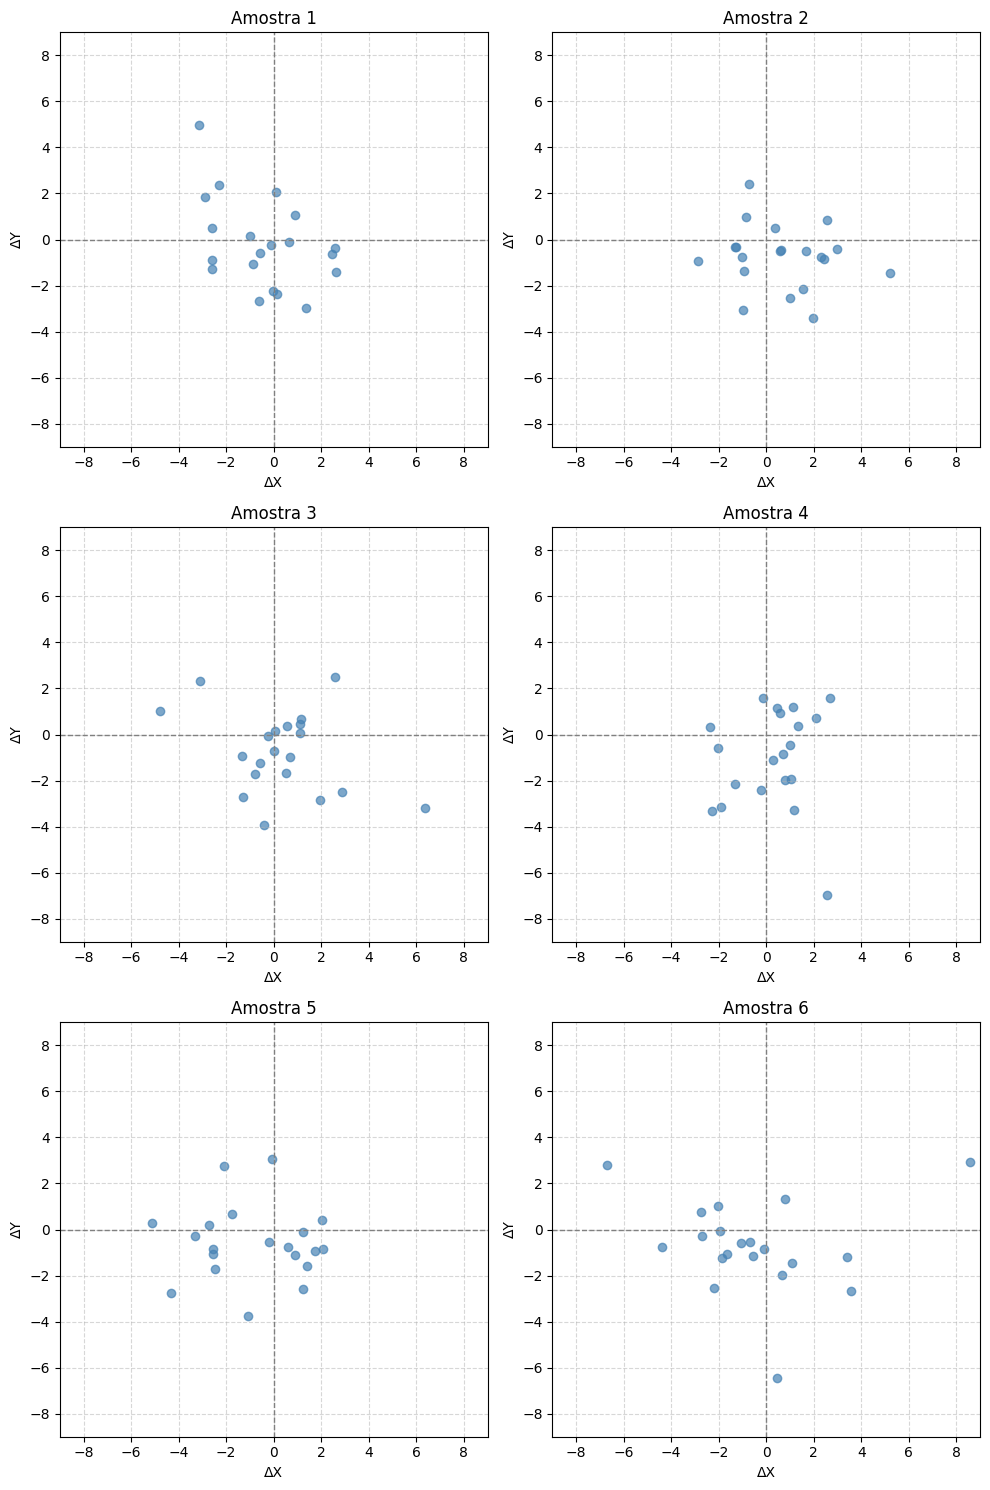
Figure 11: Error scatter plot of samples
Source: The authors (2025)
3.2. Variability Between Samples
As established in subsection 3.1, aggregated analysis points to consistent average quality (Class A at 1:25,000). However, a detailed analysis of individual samples reveals the main characteristic of VGI data: heterogeneity.
The most prominent case is Sample 6, which presented an RMSE of 3.79 m. This value is significantly discrepant, being nearly 50% higher than the RMSE of Sample 2 (2.53 m). Furthermore, Sample 6 recorded the largest maximum discrepancy among all sets, with one point reaching 9.07 m of error.
This statistical discrepancy has a direct cartographic consequence, as shown in Table 3. While five of the six samples achieved Class B at the 1:10,000 scale, Sample 6 was the only one to fail this criterion, being downgraded to Class C at the same scale.
These data statistically confirm the “patchwork” thesis (Goodchild, 2007). The positional quality of OSM in Rio de Janeiro is not monolithic. Selecting a sample of 20 points in a slightly different location drastically alters the official classification of the cartographic product. This demonstrates clear inter-sample heterogeneity, where overall average quality (discussed in 3.1) is insufficient to describe data behavior in its full complexity.
3.3. The Spatial Dimension of Heterogeneity
Heterogeneity manifests not only between sample averages (inter-sample), as shown in subsection 3.2, but also, crucially, within each dataset (intra-sample) and in its spatial distribution.
Table 4, which details discrepancy quartiles, reveals this internal variation. In Sample 6, for example, points with minimal discrepancies (Quartile 1, starting at 0.84 m) coexist with points exhibiting severe errors (Quartile 4, reaching 9.07 m). This wide dispersion, in which the largest error is more than ten times the smallest within the same set, demonstrates that quality is not uniform even in nearby neighborhoods.
The true contribution of this study lies in the analysis of the spatial distribution of these errors. The maps (Figures 5–10), which use the quartile-based symbology automatically generated by QPEC, allow for a visual investigation of the central research question: identifying whether there are distinct relationships between areas of higher or lower positional discrepancy and how errors are distributed across Rio de Janeiro’s complex urban fabric.
The initial hypothesis, grounded in the “dual city” literature (Perlman, 2010; Novaes, 2014; Kalkman, 2019), posited that the largest discrepancies (Quartiles 3 and 4, darker tones) would be concentrated in two main areas:
- informal settlements (favelas), where VGI mapping might be less precise or where the official IPP (2021) base has greater representation difficulty; and
- areas of rapid urban expansion, where roadworks may postdate the 2021 reference mapping, causing OSM (more up-to-date) to appear “incorrect” relative to the outdated official base (Camboim; Bravo; Sluter, 2015).
However, the heterogeneity of positional accuracy in Rio de Janeiro cannot be explained solely by the formal/informal socio-spatial dichotomy. Other technical and temporal variables, especially temporal lag, are decisive. The IPP reference base dates from 2021, while OSM is continuously updated. It is highly likely that elevated discrepancies (Q4) in formal areas are not OSM “errors,” but rather “updates” (new returns, bike lanes, road changes) captured by OSM but absent from the now-outdated official base.
Spatial analysis (Figures 3–8) reinforces the heterogeneity thesis: it is not merely statistical (subsection 3.2), but deeply spatial and multifactorial. Results suggest that the “dual city” (Perlman, 2010) is not the sole explanation; temporal mismatch and data source quality are determining factors that must be investigated in future studies.
The results obtained show that the heterogeneity of positional accuracy of the OSM road network in the municipality of Rio de Janeiro, characterized by PEC-PCD values predominantly classified between Classes B and C at the 1:10,000 scale and maximum errors on the order of 9.07 m, has direct implications for urban environmental management and for analyses based on transportation systems. In studies that use road networks as an analytical framework, such as assessments of accessibility to services, traffic flow modeling, vehicle emission estimates, or analyses of exposure to atmospheric pollutants, planimetric displacements of only a few meters may result in erroneous classifications of proximity to road corridors, especially in sensitive buffer areas between 50 and 100 m. These distortions affect the delineation of risk areas, the identification of exposed populations, and the assessment of socio-environmental inequalities, introducing significant biases in environmental justice inferences (Lane et al., 2013). In this sense, the discrepancies observed in the upper quartiles (Q3 and Q4) do not constitute merely a cartographic problem, but rather a critical source of uncertainty for network-based environmental applications. Moreover, in areas subject to extreme environmental events, the completeness and connectivity of the road network, particularly in informal settlements, condition accessibility for emergency response and the definition of safe routes, reinforcing the need for integration between OSM data, remote sensing products, and strategies for detecting cartographic gaps to support environmental management and urban resilience actions (Li et al., 2020a; Neivas, 2023).
In the context of the municipality of Rio de Janeiro, characterized by high urban density, pronounced socio-spatial contrasts, and the recurrence of critical environmental events such as floods and landslides, the quality of road network representation directly conditions the capacity for emergency route planning, access to vulnerable areas, and disaster response. The presence of elevated positional errors in certain regions may compromise network connectivity analyses, affecting both sustainable mobility strategies and urban adaptation and resilience actions. Thus, the results reinforce that evaluating the positional accuracy of OSM constitutes an essential input for the responsible use of these data in integrated public policies on transportation, environment, and risk management.
3.4. Methodological Implications and the Contribution of QPEC
It is necessary to discuss the methodological implications that enabled the execution of this heterogeneity analysis itself. The central approach of this study—evaluating not one but six independent samples (Figures 3–8) for the same cartographic product, would be excessively labor-intensive and impractical if carried out using manual statistical calculation and classification methods.
In this context, the development of the QPEC plugin (Figure 2), detailed in Section 2.2, was the methodological contribution that effectively made the investigation of heterogeneity feasible. The automation of RMSE calculations and PEC-PCD criteria, following the standards of ET-CQDG (Brasil, 2015), allowed the analysis to be replicated efficiently, rapidly, and in a standardized manner for the six datasets.
More important than the automation of calculations was the tool’s visualization capability. The QPEC functionality that automatically generates standardized quartile-based symbology (Q1–Q4) was essential for spatial analysis. This capability enabled the transformation of raw statistical data (Table 2) into spatial intelligence (Figures 5–10), making it possible to support the discussion presented in subsection 3.3 and to connect metric discrepancies with the complex urban reality of Rio de Janeiro.
Additionally, the spatial explicitness of heterogeneity provided by QPEC expands the potential use of OSM data in applications focused on environmental management and transportation systems. By enabling the objective identification of areas with greater positional uncertainty in the road network, the tool provides methodological support for incorporating data quality as an explicit variable in accessibility analyses, urban mobility modeling, vehicle emission estimates, and environmental exposure studies. In this sense, integrating QPEC results into environmental and transport models not only improves analytical robustness but also enables a critical reading of the spatial limitations of OSM, particularly in peripheral areas and informal settlements, where road network reliability is decisive for urban planning, emergency response, and the formulation of more equitable environmental and mobility public policies.
- Conclusions
This study aimed to estimate the heterogeneity of the road network axes of the OSM platform in the municipality of Rio de Janeiro, based on the hypothesis that the positional quality of VGI data would be a direct reflection of the socio-spatial structure of the “dual city.” To this end, a robust methodology for evaluating positional accuracy (PEC-PCD) was implemented through six independent samples, automated using the QPEC tool. The results not only confirmed the existence of heterogeneity, but also revealed a complexity that challenges the initial hypothesis. The main findings of this study can be summarized in three points:
- OSM in Rio de Janeiro exhibits a robust “average” positional quality. The aggregated analysis showed that, most of the time, the data meet strict official cartographic standards, fitting into Class A at the 1:25,000 scale and Class D at the 1:5,000 scale. This alone validates the potential integration of these data for planning at smaller scales;
- Statistical heterogeneity is a proven fact. The “average quality” masks significant variations. Sample 5 presented an RMSE almost 50% higher than the others, failing the classifications achieved by the other five samples. This statistically confirms the “patchwork” thesis (Goodchild, 2007) and demonstrates that an accuracy analysis based on a single sample, a common practice, would be methodologically flawed and would lead to misleading conclusions about product quality;
- Spatial heterogeneity is multifactorial and refutes the initial hypothesis. The most significant finding of this study was the observation that the “dual city” (Perlman, 2010; Novaes, 2014) is not the only, nor perhaps the main, explanation for the variation in positional quality.
This last point has profound implications. From the perspective of environmental management and transportation, the findings of this study indicate that the heterogeneity of OSM positional accuracy must be explicitly considered in applications that use road networks as an analytical basis. In the municipality of Rio de Janeiro, where urban mobility, air quality, exposure to environmental risks, and access to services are strongly interconnected, the geometric reliability of the road network conditions the robustness of environmental and decision-support models. Thus, the systematic evaluation of OSM quality not only qualifies its potential for integration with official datasets, but also contributes to a more critical and transparent use of VGI data in sustainable mobility policies and environmentally oriented urban planning.
In this sense, this work reinforces that collaborative mapping initiatives, when evaluated under objective quality criteria, can play a strategic role in urban environmental governance. By highlighting where and how the collaborative road network presents greater or lesser reliability, a technical basis is created to guide both the analytical use of OSM and targeted actions to improve mapping, aligning geoprocessing, social participation, and environmental management in complex urban contexts.
The heterogeneity of accuracy in Rio de Janeiro is multifactorial. The discussion suggests that temporal lag is a variable as or more determinant than the formal/informal dichotomy. In areas of rapid road changes (common in the “formal city”), OSM, because it is continuously updated, may be more accurate than the official 2021 database, making a high discrepancy (error) actually an indicator of greater VGI timeliness.
For urban planning in Rio de Janeiro, this means that data integration (Camboim; Bravo; Sluter, 2015) cannot follow a simple rule (e.g., “use IPP in favelas and OSM on paved areas”). The scenario is the opposite: OSM may be the most up-to-date source for mobility in the formal city, while the official IPP database may be the only geometrically accurate source in informal settlements.
From a methodological standpoint, the study highlights the contribution of the QPEC plugin, whose application was decisive in enabling the analysis of multiple samples and in translating statistical metrics (Table 2) into interpretable spatial representations (Figures 5–10).
4.1. Limitations and Future Research
As a study focused on the methodology of heterogeneity, this work has limitations that open avenues for future research. The analysis of six samples demonstrated the existence of heterogeneity, but did not map it exhaustively. The correlation between errors (Q4) and the “dual city” was carried out visually and qualitatively, based on the samples.
Future research may explore several directions, such as expanding the positional accuracy analysis to the entire extent of the municipality using grid-based methods (Forghani; Delavar, 2014) or census-tract analyses, in order to create a definitive map of accuracy heterogeneity and to quantitatively correlate discrepancies with informal settlement areas and, crucially, with the date of the last OSM edit versus the date of road works, so as to isolate the “temporal lag” variable.
In addition, future investigations may deepen the relationship between OSM quality heterogeneity, urban transportation systems, and environmental management applications. In particular, the explicit incorporation of positional accuracy and road network completeness metrics into accessibility models, vehicle emission estimates, and analyses of exposure to atmospheric pollutants would allow a quantitative assessment of the impact of geometric errors on environmental outcomes. In the context of Rio de Janeiro, such an approach is especially relevant for informal settlement areas, where poor quality or the absence of road mapping can compromise sustainable mobility diagnoses, public transport route planning, logistics for responding to extreme events, and environmental justice assessments. The integration of OSM data with emission inventories, land use and land cover information, and socio-environmental data could therefore expand the role of collaborative mapping as support for the formulation of more equitable, evidence-based environmental and transportation public policies.
This article demonstrated that OSM heterogeneity in Rio de Janeiro is a complex reality that reflects not only social inequality, but also temporal dynamics and the quality of the official data sources themselves.
References
ALCÂNTARA, E. et al. Flash floods and landslides of February 2022 in Petrópolis, Rio de Janeiro. Natural Hazards and Earth System Sciences, v. 23, p. 1157–1178, 2023. Available at: https://nhess.copernicus.org/articles/23/1157/2023/. Accessed on: 8 nov. 2025.
BORTOLINI, E.; CAMBOIM, S. P. Contextualizing OpenStreetMap in Mapping Favelas in Brazil. State of the Map, Heidelberg, v. 1. [S.n.]. 2019. DOI: 10.5281/zenodo.3387727. Available at: https://doi.org/10.5281/zenodo.3387727. Accessed on: 8 nov. 2025.
BRASIL. Decreto nº 89.817, de 20 de junho de 1984. Estabelece as Instruções Reguladoras das Normas Técnicas da Cartografia Nacional. Brasília, DF: Presidência da República, 1984. Available at: https://www.planalto.gov.br/ccivil_03/decreto/1980-1989/d89817.htm. Accessed on: 8 nov. 2025.
BRASIL. Ministério da Defesa. Exército Brasileiro. Departamento de Ciência e Tecnologia. Diretoria de Serviço Geográfico. Norma da especificação técnica para controle de qualidade de dados geoespaciais (ET-CQDG). Brasília, DF: MF, 2015. Available at: https://bdgex.eb.mil.br/portal/media/cqdg/ET_CQDG_1a_edicao_2016.pdf. Accessed on: 08 nov. 2025.
BRASIL. Ministério da Defesa. Exército Brasileiro. Diretoria de Serviço Geográfico. Especificação Técnica para a Aquisição de Dados Geoespaciais Vetoriais (ET-ADGV). 3. ed. Brasília, DF: DSG, 2018. Available at: geoportal.eb.mil.br/portal/images/Documentos/2024/ET-ADGV_3.0_211218.pdf. Accessed on: 8 nov. 2025.
BROVELLI, M. A.; ZAMBONI, G. A new method for the assessment of spatial accuracy and completeness of OpenStreetMap building footprints. ISPRS International Journal of Geo-Information, v. 7, n. 8, p. 289, 2018. DOI: 10.3390/ijgi7080289.
C40 CITIES. Benefits of urban climate action: Rio de Janeiro – electrification of the bus fleet. 2022. Available at: https://www.c40.org/wp-content/uploads/2022/02/Rio-de-Janeiro-%E2%80%93-Electrification-of-the-Bus-Fleet-Portuguese.pdf. Accessed on: 8 dec. 2025
CAMBOIM, S. P.; BRAVO, J. V. M.; SLUTER, C. R. An investigation into the completeness of, and the updates to, OpenStreetMap data in a heterogeneous area in Brazil. ISPRS International Journal of Geo-Information, v. 4, n. 3, p. 1366–1388, 2015. DOI: 10.3390/ijgi4031366. Available at: https://www.mdpi.com/2220-9964/4/3/1366. Accessed on: 8 nov. 2025.
CORMODE, G.; KRISHNAMURTHY, B. Key differences between Web 1.0 and Web 2.0. First Monday, v. 13, n. 6, 2008. DOI: https://doi.org/10.5210/fm.v13i6.2125.
ELIAS. QPECv0.2. 2025. Available at: https://github.com/eliasnaim/QPECv0.2. Accessed on: 12 dec. 2025.
ELIAS, E. N. N. et al. QPEC: QGIS Toolkit for Evaluating Geospatial Data Positional Accuracy according to the Brazilian Cartographic Accuracy Standard. Anuário do Instituto de Geociências, v. 46, 2023. DOI: 10.11137/1982-3908_2023_46_54245. Available at: https://doi.org/10.11137/1982-3908_2023_46_54245. Accessed on: 21 nov. 2025.
ELWOOD, S.; GOODCHILD, M.; SUI, D. Researching volunteered geographic information: spatial data, geographic research, and new social practice. Annals of the Association of American Geographers, v. 102, n. 3, p. 571-590, 2012. DOI: 10.1080/00045608.2011.595657.
EWING, R.; CERVERO, R. Travel and the Built Environment: A Meta-Analysis. Journal of the American Planning Association, v. 76, n. 3, p. 265-294, 2010. DOI: 10.1080/01944361003766766.
FERNANDES, V. O.; ALIXANDRINI JUNIOR, M. J.; ELIAS, E. N. N. Determinação de número de amostras para controle de qualidade posicional em mapas urbanos. Bahia Análise & Dados, Salvador, v. 25, n. 4, p. 821-820, 2015.
FERSTER, C. et al. Using OpenStreetMap to inventory bicycle infrastructure: A comparison with open data from cities. International Journal of Sustainable Transportation, v. 14, n. 1, p. 64-73, 2019. DOI: 10.1080/15568318.2018.1519746.
FIGUEIREDO, A.; VERÍSSIMO, E.; FRANCO, S. Mapping the Care of People with URBELatam (Morro do Preventório, Niterói/RJ). Humanitarian OpenStreetMap Team (HOT), 2022. Available at: https://www.hotosm.org/updates/mapping-the-care-of-people-with-urbelatam/. Accessed on: 8 nov. 2025.
FONTE, C. C. et al. Generating Up-to-Date and Detailed Land Use and Land Cover Maps Using OpenStreetMap and GlobeLand30. ISPRS International Journal of Geo-Information, v. 6, n. 4, 125, 2017. DOI: 10.3390/ijgi6040125.
FORGHANI, M.; DELAVAR, M. R. A quality study of the OpenStreetMap dataset for Tehran. ISPRS International Journal of Geo-Information, v. 3, n. 2, p. 750-763, 2014. DOI: 10.3390/ijgi3020750.
GALO, M.; CAMARGO, P. Utilização do GPS no controle de qualidade de cartas. In: 1º Congresso Brasileiro De Cadastro Técnico Multifinalitário, 1994, Florianópolis. Anais [...]. Florianópolis: UFSC, 1994. p. 41-48. Available at: researchgate.net/profile/Mauricio-Galo-2/publication/265208956_Utilizacao_do_GPS_no_controle_de_qualidade_de_cartas/links/5dadf743a6fdccc99d928da4/Utilizacao-do-GPS-no-controle-de-qualidade-de-cartas.pdf. Accessed on: 8 nov. 2025.
GANAPATI, S. Uses of public participation geographic information systems applications in E-Government. Public Administration Review, v. 71, n. 3, p. 425-434, 2011. DOI: https://doi.org/10.1111/j.1540-6210.2011.02226.x.
GIRRES, J-F.; TOUYA, G. Quality assessment of the French OpenStreetMap dataset. Transactions in GIS, v. 14, n. 4, p. 435-459, 2010. DOI: http://dx.doi.org/10.1111/j.1467-9671.2010.01203.x.
GOODCHILD, M. F. Citizens as sensors: the world of Volunteered Geography. GeoJournal, v. 69, p. 211-221, 2007. DOI: 10.1007/s10708-007-9111-y.
GOODCHILD, Michael F.; LI, Linna. Assuring the quality of volunteered geographic information. Spatial Statistics, v. 1, p. 110–120, 2012. DOI: 10.1016/j.spasta.2012.03.002.
GRASER, A.; STRAUB, M.; DRAGASCHNIG, M. Is OSM good enough for vehicle routing? A study comparing street networks in terms of route quality. In: PROCEEDINGS OF LBS 2014, 2014. Preprint. Available at: https://anitagraser.com/wp-content/uploads/2010/10/preprint_lbs2014_graseretal.pdf. Accessed on: 8 nov. 2025.
HAKLAY, M. How good is volunteered geographical information? A comparative study of OpenStreetMap and Ordnance Survey datasets for London and the rest of England. Environment and Planning B: Planning and Design, v. 37, n. 4, p. 682–703, 2010. Available at: https://www.ucl.ac.uk/~ucfamha/OSM%20data%20analysis%20070808_web.pdf. Accessed on: 8 nov. 2025.
HAGEN, Joshua S. Contributing to the geoweb: volunteered geographic information and humanitarian assistance. GeoJournal, v. 81, n. 3, p. 429–444, 2016. DOI: 10.1007/s10708-015-9634-0.
HALLOPEAU, T. et al. Mapping Rio de Janeiro’s favelas: general-purpose vs. satellite-specific neural networks. arXiv, [S.v], 2025. Available at: https://arxiv.org/abs/2510.03725. Accessed on: 8 nov. 2025.
HECHT, R.; KUNZE, C.; HAHMANN, S. Measuring completeness of building footprints in OpenStreetMap over space and time. ISPRS International Journal of Geo-Information, v. 2, n. 4, p. 1066–1091, 2013. DOI: 10.3390/ijgi2041066. Available at: https://www.mdpi.com/2220-9964/2/4/1066. Accessed on: 8 nov. 2025.
HERFORT, B. et al. The evolution of humanitarian mapping within the OpenStreetMap community. Scientific Reports, v. 11, 3037, 2021. DOI: 10.1038/s41598-021-82404-z. Available at: https://www.nature.com/articles/s41598-021-82404-z. Accessed on: 8 nov. 2025.
HOSSEINI, R. et al. A framework for performance analysis of OpenStreetMap road data across different navigation tasks. Journal of Location Based Services, 2025. Available at: https://www.tandfonline.com/doi/full/10.1080/19475683.2025.2468184. Accessed on: 8 nov. 2025.
IBGE - INSTITUTO BRASILEIRO DE GEOGRAFIA E ESTATÍSTICA. Manual Técnico para Avaliação da Qualidade de Dados Geoespaciais. Manuais Técnicos em Geociências, n. 13. Rio de Janeiro: IBGE, 2019. Available at: biblioteca.ibge.gov.br/visualizacao/livros/liv101152.pdf. Accessed on: 8 nov. 2025.
IBGE - INSTITUTO BRASILEIRO DE GEOGRAFIA E ESTATÍSTICA. Censo Demográfico 2022: população residente do município do Rio de Janeiro. Rio de Janeiro: IBGE, 2022a. Available at: https://www.ibge.gov.br/cidades-e-estados/rj/rio-de-janeiro.html. Accessed on: 21 nov. 2025.
IBGE - INSTITUTO BRASILEIRO DE GEOGRAFIA E ESTATÍSTICA. Área territorial oficial do município do Rio de Janeiro. Rio de Janeiro: IBGE, 2022b. Available at: https://www.ibge.gov.br/cidades-e-estados/rj/rio-de-janeiro.html. Accessed on: 21 nov. 2025.
IBRAHIM, M. H.; DARWISH, N. R.; HEFNY, H. A. An approach to control the positional accuracy of point features in volunteered geographic information systems. International Journal of Advanced Computer Science and Applications, v. 10, n. 6, 2019. DOI: 10.14569/IJACSA.2019.0100624.
IEA – INTERNATIONAL ENERGY AGENCY. CO₂ emissions in 2023. Paris, 2024. Available at: https://www.iea.org/reports/co2-emissions-in-2023. Accessed on: 8 dec. 2025.
IPCC. Climate Change 2022: Mitigation of Climate Change. Working Group III Contribution to the Sixth Assessment Report. Chapter 10: Transport. Cambridge: Cambridge University Press, 2022. Available at: https://www.ipcc.ch/report/ar6/wg3/chapter/chapter-10/. Accessed on: 8 dec. 2025.
INSTITUTO PEREIRA PASSOS (IPP) INSTITUTO MUNICIPAL DE URBANISMO PEREIRA PASSOS. Página inicial. 2025. Available at: https://ipp.prefeitura.rio/. Accessed on: 20 nov. 2025.
INSTITUTO PEREIRA PASSOS (IPP). Logradouros. Rio de Janeiro: Data.Rio, 2021. Conjunto de dados. Available at: https://www.data.rio/datasets/PCRJ::logradouros/about. Accessed on: 01 nov. 2025
ISO - INTERNATIONAL ORGANIZATION FOR STANDARDIZATION. ISO 19157:2013: Geographic Information - Data Quality. Vernier: ISO, 2013.
JASIM, M. S.; AL-HAMADANI, O. Positional accuracy assessment for updating authoritative geospatial datasets based on open source data and remotely sensed images. Journal of Engineering, v. 26, n. 2, p. 70-84, 2020. DOI: 10.31026/j.eng.2020.02.06.
JOSM. JOSM - O Editor do OpenStreetMap. 2025. Available at: https://josm.openstreetmap.de/. Accessed on: 20 nov. 2025.
KALKMAN, A. S. Worlding Rio de Janeiro’s favelas: Relations and representations of socio-spatial inequality in visual art. 2019. Thesis (Master’s) — Universiteit van Amsterdam, Amsterdam, 2019. Available at: pure.uva.nl/ws/files/36518171/Thesis_complete_.pdf. Accessed on: 12 nov. 2025.
KENT, A. Topographic Maps: methodological approaches for analyzing cartographic style. Journal of Map & Geography Libraries, v. 5, n. 2, p. 131-156, 2009. DOI: 10.1080/15420350903001187.
LANE, K. J. et al. Positional error and time-activity patterns in near-highway epidemiologic studies of traffic-related air pollution. Environmental Health, v. 12, 2013. Available at: https://pmc.ncbi.nlm.nih.gov/articles/PMC3907019/. Accessed on: 8 dec. 2025.
LI, Linna et al. Using OpenStreetMap data to support environmental and urban analysis: a review. Computers, Environment and Urban Systems, v. 80, p. 101–120, 2020. DOI: 10.1016/j.compenvurbsys.2019.101441.
LI, H.; HERFORT, B.; HUANG, W.; ZIA, M.; ZIPF, A. Exploration of OpenStreetMap missing built-up areas using Twitter hierarchical clustering and deep learning in Mozambique. ISPRS Journal of Photogrammetry and Remote Sensing, v. 166, p. 41-51, 2020a.
LIMA, M. da C.; FREIMAN, F. P. CAMBOIM, S. P. Desenvolvimento de uma aplicação web de mapeamento colaborativo para identificação de áreas de risco aplicada ao município de Nova Friburgo/RJ. Revista de Geociências do Nordeste, v. 8, n. 1, p. 217–226, 2022. DOI: 10.21680/2447-3359.2022v8n1ID26542. Available at: https://periodicos.ufrn.br/revistadoregne/article/download/26542/16388/105089. Accessed on: 8 nov. 2025.
MACHADO, A. A.; CAMBOIM, S. P.. MAPEAMENTO COLABORATIVO COMO FONTE DE DADOS PARA O PLANEJAMENTO URBANO - DESAFIOS E POTENCIALIDADES. Revista Brasileira de Gestão Urbana, [S. l.], v. 11, 2019. Available at: https://periodicos.pucpr.br/Urbe/article/view/24666. Accessed on: 12 nov. 2025.
MAHABIR, Ron et al. The role of OpenStreetMap in supporting sustainable development and disaster risk reduction. ISPRS International Journal of Geo-Information, v. 9, n. 6, p. 1–23, 2020. DOI: 10.3390/ijgi9060383.
MERCHANT, D. C. Spatial Accuracy Standards for Large Scalle Line Maps. In: AMERICAN CONGRESS ON SURVEYING AND MAPPING, 42., 1982, Falls Church. Proceedings [...]. Gaithersburg: ACSM, 1982. v. 1, p. 222-231.
MOBASHERI, Amin et al. Assessing the completeness of OpenStreetMap road data for emergency routing. ISPRS International Journal of Geo-Information, v. 6, n. 11, p. 1–19, 2017.DOI: 10.3390/ijgi6110348.
NEIVAS, G. S. Visualização da qualidade de dados do mapeamento colaborativo no contexto de desastres. Thesis (Master’s in Geodetic Sciences), UFPR, 2023.
NOGUEIRA JR., J. B. Controle de qualidade de produtos cartográficos: uma proposta metodológica. 2003. Thesis (Doctorate in Cartographic Sciences) - Universidade Estadual Paulista, Presidente Prudente, 2003. Available at: repositorio.unesp.br/server/api/core/bitstreams/2a484db4-cd32-48fe-83d1-9017ae4e64b5/content. Accessed on: 12 nov. 2025.
NOVAES, A. R. Favelas and the Divided City: Mapping silences and calculations in Rio de Janeiro’s journalistic cartography. Social & Cultural Geography, v. 15, n. 2, p. 201–225, 2014. DOI: 10.1080/14649365.2013.872285. Available at: https://www.tandfonline.com/doi/abs/10.1080/14649365.2013.872285. Accessed on: 8 nov. 2025.
OPENSTREETMAP. OpenStreetMap stats. 2025. Available at: https://planet.openstreetmap.org/statistics/data_stats.html. Accessed on: 20 nov. 2025.
OPENSTREETMAP WIKI. Página principal. 2025. Available at: https://wiki.openstreetmap.org/. Accessed on: 20 nov. 2025.
O’REILLY, T. What is Web 2.0: Design patterns and business models for the next generation of software. Communications & Strategies, v. 65, n. 1, 2007. Available at: https://ssrn.com/abstract=1008839. Accessed on: 12 nov. 2025.
PERLMAN, J. Favela: Four decades of living on the edge in Rio de Janeiro. New York: Oxford University Press, 2010. Available at: https://archive.org/details/favelafourdecade0000perl. Accessed on: 8 nov. 2025.
POIANI, T. H. et al. Potential of collaborative mapping for disaster relief: a case study of OpenStreetMap in the Nepal earthquake 2015. In: HAWAII INTERNATIONAL CONFERENCE ON SYSTEM SCIENCES (HICSS), 49., 2016. Proceedings [...]. 2016. DOI: 10.1109/HICSS.2016.31. Available at: https://repositorio.usp.br/item/002775517. Accessed on: 8 nov. 2025.
SLUTER, C. R. et al. Proposal for topographic map symbols for large-scale maps of urban areas in Brazil. The Cartographic Journal, v. 55, n. 4, p. 362-377, 2019. DOI: https://doi.org/10.5194/ica-abs-1-342-2019.
ZHANG, H.; MALCZEWSKI, J. Accuracy evaluation of the Canadian OpenStreetMap road networks. International Journal of Geospatial and Environmental Research, v. 5, n. 2, 2017. Available at: https://ijger-ojs-txstate.tdl.org/ijger/article/view/69/45. Accessed on: 12 nov. 2025.
About the Authors
Nathan Damas Antonio is a PhD candidate in Geodetic Sciences at UFPR, focused on Geospatial Data Quality, Volunteered Geographic Information, Collaborative Mapping, urban mobility, spatial data analysis, and semantic interoperability, with a strong commitment to advancing the quality and accessibility of geospatial data.
Elias Nasr Naim Elias is a professor in the Department of Cartographic Engineering at UERJ and holds a PhD in Geodetic Sciences from UFPR. He has experience in Geosciences, with an emphasis on Cartography, Geospatial Data Quality, and Collaborative Mapping.
Irving da Silva Badolato is a professor in the Department of Cartographic Engineering at UERJ, with a focus on applied computing. He holds a master’s degree in Systems and Computer Engineering from COPPE/UFRJ and is currently pursuing a PhD in Computational Sciences and Mathematical Modeling at IME/UERJ.
Silvana Philippi Camboim is a professor in the Department of Geomatics at the Federal University of Paraná (UFPR) and holds a PhD in Geodetic Sciences. Her work focuses on Cartography, GIScience, and Spatial Data Infrastructures. She is a Research Productivity Fellow and a member of the Geosciences Advisory Committee of CNPq. She serves on international commissions and networks and is a member of the International Cartographic Association (ICA), the International Society for Photogrammetry and Remote Sensing (ISPRS), the Open Source Geospatial Foundation (OSGeo), and the OpenStreetMap (OSM) community. She is the editor-in-chief of the Boletim de Ciências Geodésicas.
Marcio Augusto Reolon Schmidt holds a PhD in Geodetic Sciences from the Federal University of Paraná and works at the interface between Geosciences and Intelligent Methods, with a focus on Cartography. He is a faculty member of the Faculty of Civil Engineering at the Federal University of Uberlândia and is currently a member of the Education and Training Commission of the International Cartographic Association (ICA).
Author Contributions
Conceptualization, [N.D.A; E.N.N.E; I.S.B.; S.P.C.; M.A.R.S.]; methodology, [N.D.A.; E.N.N.E.; I.S.B.]; software [E.N.N.E; I.S.B.]; validation, [N.D.A.; E.N.N.E.; I.S.B.]; formal analysis, [N.D.A; E.N.N.E; I.S.B.]; writing—original draft preparation, [N.D.A.; E.N.N.E.; I.S.B.]; writing—review and editing [N.D.A; E.N.N.E; I.S.B.; S.P.C.; M.A.R.S.]; supervision, [S.P.C.; M.A.R.S.]. All authors have read and agreed to the published version of the manuscript.
Funding
This study was carried out with the support of the Coordination for the Improvement of Higher Education Personnel – Brazil (CAPES) – Financing Code 001.
Conflicts of Interest
The authors declare no conflicts of interest.
About Coleção Estudos Cariocas
Coleção Estudos Cariocas (ISSN 1984-7203) is a publication dedicated to studies and research on the Municipality of Rio de Janeiro, affiliated with the Pereira Passos Institute (IPP) of the Rio de Janeiro City Hall.
Its objective is to disseminate technical and scientific production on topics related to the city of Rio de Janeiro, as well as its metropolitan connections and its role in regional, national, and international contexts. The collection is open to all researchers (whether municipal employees or not) and covers a wide range of fields — provided they partially or fully address the spatial scope of the city of Rio de Janeiro.
Articles must also align with the Institute’s objectives, which are:
- to promote and coordinate public intervention in the city’s urban space;
- to provide and integrate the activities of the city’s geographic, cartographic, monographic, and statistical information systems;
- to support the establishment of basic guidelines for the city’s socioeconomic development.
Special emphasis will be given to the articulation of the articles with the city's economic development proposal. Thus, it is expected that the multidisciplinary articles submitted to the journal will address the urban development needs of Rio de Janeiro.
[1] https://planet.openstreetmap.org/statistics/data_stats.html
[2] www.openstreetmap.org