
Volume 14 Issue 1 *Corresponding author beaamgarcia@ufrj.br Submitted 21 Nov 2025 Accepted 06 Apr 2026 Published 30 Apr 2026 Citation OLIVEIRA, B. A. G.; MALUF, V. B. V.; FEVRIER, P. V. R. Protected Areas as Carbon Sinks in the Municipality of Rio de Janeiro: Methodological Proposal and Application of the InVEST 3.14 Carbon Storage and Sequestration Model. Coleção Estudos Cariocas, v. 14, n. 1, 2026.,
DOI: 10.71256/19847203.14.1.198.2026. The article was originally submitted in PORTUGUESE. Translations into other languages were reviewed and validated by the authors and the editorial team. Nevertheless, for the most accurate representation of the subject matter, readers are encouraged to consult the article in its original language.


| Protected Areas as carbon sinks in the Municipality of Rio de Janeiro: methodological proposal and application of the InVEST 3.14 carbon storage and sequestration model Unidades de Conservação como sumidouros de carbono no Município do Rio de Janeiro: proposta metodológica e aplicação do modelo Carbon Storage and Sequestration do software InVEST 3.14 Áreas Protegidas como sumideros de carbono en la ciudad de Río de Janeiro: propuesta metodológica y aplicación del modelo Carbon Storage and Sequestration del software InVEST 3.14 Beatriz Ambrosio Garcia de Oliveira1, Victor Buznello de Vasconcelos Maluf2,
Paulo Vinicius Rufino Fevrier3 1 Universidade Federal do Rio de Janeiro, Av. Athos da Silveira Ramos, 274, Cidade Universitária, Rio de Janeiro/RJ, CEP: 21941-916, ORCID: 0000-0002-6264-4771, beaamgarcia@ufrj.br 2 Instituto Estadual do Ambiente, Av. Marechal Floriano, 45, 11 andar, CEP: 20080-003, ORCID: 0000-0003-1323-2559, victormaluf@inea.rj.gov.br 3 Instituto Estadual do Ambiente, Av. Marechal Floriano, 45, 11 andar, CEP: 20080-003, ORCID: 0000-0002-8854-7232, paulofevrier@inea.rj.gov.br
AbstractThis study estimated carbon stocks in protected areas in the municipality of Rio de Janeiro using the CSS-InVEST model, based on detailed maps of land use and land cover, soils, and phytophysiognomies. The integration of these datasets improved the accuracy of estimates across the four carbon pools. The results indicate that mangroves and wetlands hold the largest carbon stocks, followed by forested massifs. The study highlights the strategic role of urban protected areas in climate change mitigation and environmental planning. Keywords: carbon stock; ecosystem services; climate change mitigation; urban protected areas.
ResumoEste estudo estimou os estoques de carbono em áreas protegidas no município do Rio de Janeiro por meio do modelo CSS-InVEST, utilizando mapas detalhados de uso e cobertura do solo, solos e fitofisionomias. A integração dessas bases aprimorou a precisão das estimativas nos quatro reservatórios de carbono. Os resultados indicam que manguezais e áreas úmidas concentram os maiores estoques, seguidos pelos maciços florestais. O trabalho evidencia o papel estratégico das áreas protegidas urbanas na mitigação das mudanças climáticas e no planejamento ambiental. Palavras-chave: estoque de carbono, serviços ecossistêmicos; mitigação de mudanças climáticas; unidades de conservação urbanas.
ResumenEste estudio estimó las reservas de carbono en áreas protegidas del municipio de Río de Janeiro mediante el modelo CSS-InVEST, utilizando mapas detallados de uso y cobertura del suelo, suelos y fitofisionomías. La integración de estas bases mejoró la precisión de las estimaciones en los cuatro reservorios de carbono. Los resultados indican que los manglares y las áreas húmedas concentran las mayores reservas de carbono, seguidos por los macizos forestales. El trabajo evidencia el papel estratégico de las áreas protegidas urbanas en la mitigación del cambio climático y en la planificación ambiental. Palabras clave: reserva de carbono; servicios ecosistémicos; mitigación climática; áreas protegidas urbanas. |
Introduction
The intensification of global warming and the increase in greenhouse gas concentrations in the atmosphere have driven governments and scientific institutions to seek effective strategies for mitigating and adapting to climate change. In this context, forests and other natural ecosystems play a central role as carbon sinks, by absorbing and storing atmospheric carbon dioxide (CO₂) in their biomass and soils, contributing to the regulation of the global climate (IPCC, 2019).
In the Atlantic Forest biome, the literature on carbon storage has seen significant advances, ranging from assessments of specific compartments to data syntheses at a regional scale. D’Andrea et al. (2015) estimated soil organic carbon stocks in Restinga areas, considering different depths and applying statistical methods to ensure sampling reliability. Villanova et al. (2019) investigated carbon stocks in necromass within secondary forest fragments, while Silva et al. (2021) analyzed carbon content in leaves and wood of tree species as an indicator of environmental quality. On a broader scale, Fonsêca et al. (2024) integrated data published between 2000 and 2021 using mixed models and standardized conversion factors, identifying spatial and climatic patterns that influence carbon stocks in the biome.
Despite these advances, most studies focus on isolated compartments or local scales, and gaps remain regarding the integrated quantification of total carbon stock. In particular, assessments that simultaneously consider the different carbon compartments and their spatial distribution in protected areas are limited, hindering consistent comparisons across regions and understanding the role of these areas in the broader context of climate change mitigation. Furthermore, the absence of spatially explicit approaches restricts the application of results in environmental planning processes and in the formulation of evidence-based public policies.
In this sense, in densely occupied urban environments, where vegetation cover tends to be reduced, fragmented, and subject to constant anthropogenic pressures, forest remnants assume strategic importance. Protected Areas inserted in these contexts contribute significantly to the maintenance of ecosystem services, by preserving native vegetation areas capable of acting as carbon sinks, in addition to playing a fundamental role in local climate regulation and the improvement of urban environmental quality (Amaral et al., 2026).
The municipality of Rio de Janeiro, although marked by intense urbanization, harbors several green area systems (Pedreira; Andrade; Fico, 2017), largely protected by municipal, state, and federal Protected Areas, such as Tijuca National Park, Pedra Branca State Park, and Marapendi Municipal Natural Park. This context makes the municipality an exemplary case for assessing the potential of urban PAs in providing the ecosystem service of carbon storage, with direct implications for territorial planning and public policies for climate change mitigation.
Models based on Geographic Information Systems, such as InVEST (Integrated Valuation of Ecosystem Services and Tradeoffs), have been widely used in the assessment of ecosystem services because they allow for spatially explicit, standardized, and comparable estimates across different areas and scales, supporting environmental decision-making processes. In this sense, the present study aims to quantitatively estimate and analyze the ecosystem service of total carbon stock (TCS) in terrestrial ecosystems protected by Protected Areas in the municipality of Rio de Janeiro, using the InVEST Carbon Storage and Sequestration model (version 3.14), in order to understand the role of these areas as carbon sinks.
Theoretical Background
2.1 Understanding the Carbon Cycle and Its Components
The carbon cycle comprises four main reservoirs: fossil carbon, the atmosphere, the ocean, and the biosphere (IPCC, 2001; Schimel, 1995). The theme of this cycle and its connection to climate change, especially regarding sources and sinks of atmospheric CO2, has been discussed for decades, so that the literature produced in this field of knowledge is vast.
As early as the 1990s, Schimel (1995) pointed out that the carbon cycle had become a focal point in ecology due to the drastic observed increase in atmospheric CO2 concentration, caused by rising global emissions. When evaluating the main results of the 1994 Intergovernmental Panel on Climate Change (IPCC) Report, the author notes that terrestrial ecosystems and their capacity to regulate the carbon cycle received great attention from researchers at the time, highlighting the need for a better understanding of storage mechanisms. These, in turn, involve complex interactions between climate (temperature, moisture, and radiation), vegetation (photosynthesis and respiration), soil, and land use (Schimel, 1995).
In the same context, Houghton (1995) warned that land use changes in terrestrial ecosystems occurring between 1850 and 1980 had become the second largest source of CO2 emissions, second only to fossil fuel combustion. Furthermore, the author noted that this phenomenon had slowed down in the temperate and boreal regions of the Northern Hemisphere in the 20th century, but had rapidly intensified in tropical regions through the conversion of forests into pasture and agricultural areas, indicating a trend of CO2 release from terrestrial ecosystems (Houghton, 1995).
In 2006, the IPCC defined that carbon circulates through three main pools in the terrestrial biosphere: biomass, dead organic matter, and soils (IPCC, 2006; 2019). The first comprises above-ground biomass, consisting of all living tree, herbaceous, and shrub biomass, and below-ground biomass, which includes living roots larger than 2 mm in diameter. Dead organic matter, in turn, includes dead woody biomass, standing or fallen, on the surface with a diameter greater than 10 cm, as well as litter. In soil, carbon takes the form of organic carbon, which is a direct function of the living and non-living organic matter in its matrix.
Furthermore, it is necessary to separate carbon sequestration and carbon stock mechanisms, since they consist of complementary yet distinct processes of atmospheric carbon assimilation. According to the IPCC (2001), carbon sequestration is the process of increasing the amount of carbon in a reservoir other than the atmosphere. In the case of biological mechanisms such as photosynthesis, it is the direct removal of atmospheric CO2 by the biosphere. On the other hand, the body defines stock as the absolute amount of carbon held in a reservoir at a specific time (IPCC, 2001).
For the specific case of the soil sink, Don et al. (2023), when reviewing 100 scientific publications between April and October 2022, identified confusion in the use of both terms and their relationship to climate change mitigation, emphasizing the need for conceptual standardization. The authors proposed that the term carbon stock should refer specifically to the quantity or content of organic carbon in the soil, being synonymous with organic carbon storage, expressed in units of mass per area (e.g., MgC.ha⁻¹ or tonC.ha⁻¹). Carbon sequestration, in turn, should refer to the process of transferring carbon from the atmosphere, via autotrophic metabolic activities and subsequent production of organic matter, to the soil, where it is retained as organic carbon. This flow should be expressed in units of mass per area per time period (e.g., MgC.ha⁻¹.yr⁻¹ or tonC.ha⁻¹.yr⁻¹).
Furthermore, Don et al. (2023) reiterate that sequestration only results in an increase, or accumulation, of soil carbon stock if the gains from CO2 removal from the atmosphere exceed carbon losses from respiration of organisms during organic matter decomposition. Thus, protecting large soil organic carbon stocks is a climate change mitigation measure in the sense of preventing that carbon from being released back into the atmosphere. In this case, organic carbon, as defined by the IPCC (2006), can be stored in four different reservoirs: in the soil; and in biomass, which is divided into above-ground biomass, below-ground biomass, and dead biomass/dead matter/litter.
Regarding carbon retention in soil, Antunes et al. (2025), in an even more recent literature review, point out that organic matter, the raw material for organic carbon, derives from the deposition of plant and animal residues directly on the surface (litter), which are subsequently transformed into organic compounds and transported to deeper soil layers, where they are retained via physicochemical mechanisms.
In this sense, the authors note that the fine fraction of soil mineralogy, especially clay, plays an important role in aggregate formation in the presence of organic matter. These minerals have the capacity to retain water and organic and inorganic components, as well as to adsorb dissolved organic matter due to their specific surface area and cation exchange capacity. Through associations and aggregations with mineral and organic compounds, organic matter is stabilized, preventing its molecules from being mineralized or oxidized, so that it remains retained in the soil (Antunes et al., 2025).
Thus, in this work we consider the definition given by the Food and Agriculture Organization (FAO), where soil carbon stock is the mass of organic carbon contained in a sample of known bulk density, usually expressed in tons or megagrams per hectare for a given depth, which should be reported up to 30 cm, according to IPCC recommendations (IPCC, 2006; FAO, 2019).
Using these recommendations, Bernoux et al. (2002) quantified and mapped carbon stocks in Brazilian soils based on soil profiles collected during the RADAMBRASIL project, the digital soil map produced by the FAO (2019), and native vegetation cover information. The authors observed that the largest carbon stocks occurred in regions with a greater presence of moist soils, such as the Pantanal, and mangrove soils, while the smallest stocks were observed in sandy soils under semi-arid climate, such as in northeastern Brazil.
With respect to biomass, this encompasses all organic material, such as branches, trunk and leaves (above-ground biomass), roots (below-ground biomass), dead matter and litter (necromass). Fonsêca et al. (2024) reviewed 46 publications from 2000 to 2021 that addressed carbon stock in the biomass of the Atlantic Forest ecosystem, considering mature and secondary forests, as well as their phytophysiognomic diversity. According to the authors, biomass has three times less capacity to store carbon compared to soil and, among its different reservoirs, above-ground (tree) biomass represents the most considerable fraction in mature forest ecosystems compared to secondary forests.
Still according to Fonsêca et al. (2024), carbon stored in above-ground biomass can reach up to 202.8 MgC.ha⁻¹, with significant variations between mature and secondary forests, and up to 31 MgC.ha⁻¹ in necromass. Thus, the importance of conservation efforts for mature forest remnants in the Atlantic Forest biome is emphasized, since one hectare of forest in an advanced successional stage can store twice as much as a regenerating forest. Furthermore, the authors point out that climatic factors such as precipitation and temperature affect storage capacity, where forests subject to higher rainfall regimes showed greater carbon stocks.
However, this capacity is not uniform, being susceptible to environmental and anthropogenic variations. Seasonality is an important environmental factor, since the conversion of above-ground biomass into necromass implies the gradual release of carbon not retained by the soil back into the atmosphere due to decomposition (Veiga, 2008).
Finally, it is necessary to emphasize that changes in land use and land cover have, for decades, altered carbon stock in biomass and soil (Houghton, 1995; Houghton, 2009). Deforestation constitutes an anthropogenic factor in which clear-cutting, followed by burning to clear the land, promotes the total release of previously stored carbon into the atmosphere (Gameiro et al., 2025). The loss of carbon from the conversion of Atlantic Forest ecosystems into pasture and agricultural areas is 65% (Fonseca et al., 2024).
2.2 Land Uses and Land Covers and Carbon Storage Capacity
Understanding carbon stock by land use and land cover class requires a detailed analysis of the physical, chemical, morphological, and biological characteristics of the environment. This approach allows understanding the functioning of carbon storage mechanisms under different covers, disregarding the influence of anthropogenic factors. According to the IPCC guidelines (2006), three main categories can be identified:
i. Classes with negligible carbon storage
Urban areas, exposed soils, and mining areas constitute anthropogenic land uses that have negligible organic carbon storage capacity due to the absence or extreme limitation of vegetation cover and soil organic matter. They are therefore associated with zero carbon stock. Similarly, rocky outcrops and water bodies, although natural, present methodological restrictions for quantifying carbon stocks in the context of territorial inventories, due to the scarcity of consolidated empirical data in the literature (BRASIL, 2024).
ii. Classes with carbon storage capacity but high dynamism
Pastures, agricultural crops, and silviculture constitute dynamic anthropogenic areas, subject to seasonality and harvesting and cutting periods, and whose carbon storage potential depends both on soil characteristics and on the type of management employed (Phukubye et al., 2022; Beillouin et al., 2022). Thus, storage capacity in these classes is directly related to factors such as agricultural practices and land use. Due to this dynamism, carbon stock estimation presents greater complexity and uncertainty, varying considerably between different regions and even within the same state.
iii. Classes with carbon storage capacity but low dynamism
Natural vegetation areas, such as forests, mangroves, restingas, and wetlands, are characterized by dynamics that are relatively stable compared to those mentioned above, which makes them less susceptible to significant variations in carbon stock. In these cases, estimates from national studies were considered (BRASIL, 2020).
2.3 Spatial Modeling
Spatial modeling has become a fundamental tool for studying the carbon cycle, especially regarding the estimation of stocks and flows under different land uses and covers. Currently, several software programs have been developed for this purpose, among which the Integrated Valuation of Ecosystem Services and Tradeoffs (InVEST) stands out, widely used by the academic community. The Carbon Storage and Sequestration model (InVEST-CSS) enables the estimation of carbon stock for the four reservoirs, associated with specific land use and land cover classes. Additionally, the model allows for carbon sequestration and emission balances based on the comparison of land use maps from different years, as well as the economic valuation of stored or sequestered carbon.
Nogueira Júnior (2023) applied InVEST-CSS for mapping and economic valuation of carbon in the Amazon, using secondary soil and biomass (above and below ground) data integrated with land use and land cover maps. The results highlighted the high carbon storage potential in agroforestry systems and secondary forests, in addition to evidencing the model's capacity to estimate the monetary value of sequestered carbon, considering both the social cost of carbon and market credit scenarios.
He et al. (2023) coupled the Future Land Use Simulation (FLUS) model with InVEST in order to project carbon stocks in the municipality of Guilin, China, up to the year 2035, under four scenarios aligned with the Sustainable Development Goals (SDGs). The authors observed that, although the urbanization process resulted in significant carbon losses between 2005 and 2020, the "ecological priority" scenario projected for 2035 presented the highest carbon storage potential, surpassing scenarios oriented predominantly by economic growth.
Similarly, Zafar et al. (2024) integrated the CA-Markov model for simulating future scenarios (2025 and 2030) with InVEST-CSS, evaluating carbon stock dynamics in Pakistan over three decades. The results indicated a modest increase (0.5%) in total carbon stock by 2030, driven mainly by the expansion of forest areas and croplands, with soil organic carbon accounting for approximately 94% of the estimated total stock.
Despite its wide applicability and ease of use, Wang et al. (2024) pointed out that, in complex and highly fragmented urban environments, the spatial performance of InVEST may be inferior to other models, such as the Carnegie–Ames–Stanford Approach (CASA), since the approach based on fixed carbon densities does not adequately represent the seasonal dynamics of vegetation. In contrast, Nwaogu et al. (2025) highlighted InVEST's potential to integrate carbon stocks from different soil compartments and support public policy formulation. Complementarily, Sharma et al. (2024) emphasized the model's robustness in offering a simple and consistent method for establishing baselines at the urban scale, contributing to sustainable territorial planning.
Study Area
The municipality of Rio de Janeiro is located in the Southeast region of Brazil, between the parallels 22°46'1.84''S and 23°4'56.56''S and the meridians 43°6'37.85''W and 43°47'42.59''W, with an approximate area of 1,200 km² (IBGE, 2022). It has a humid tropical climate and diverse relief, marked by the presence of coastal massifs, coastal plains, and lagoon systems, elements that condition the distribution of natural ecosystems and soils in the municipal territory (Ab’Sáber, 2003).
The municipality hosts a significant set of public protected areas (PAs) at the municipal, state, and federal levels, which protect important remnants of Atlantic Forest, mangroves, restingas, and wetlands. These protected areas represent approximately 30% of the total area of the municipality, constituting structuring elements of the urban and peri-urban landscape and playing a fundamental role in the provision of ecosystem services, especially in climate regulation and carbon storage, even in a context of high urbanization and environmental fragmentation (Mendonça-Santos et al., 2003).
Information regarding the territorial boundary, category, and administrative sphere of these units was obtained from official databases, including institutional records and cartographic bases made available by environmental agencies and public geospatial data platforms, such as the National Register of Protected Areas (MMA, 2026), and Geoinea (INEA, 2018). The list of protected areas considered in the study and their spatial distribution are presented in Figure 1 and Table 1.
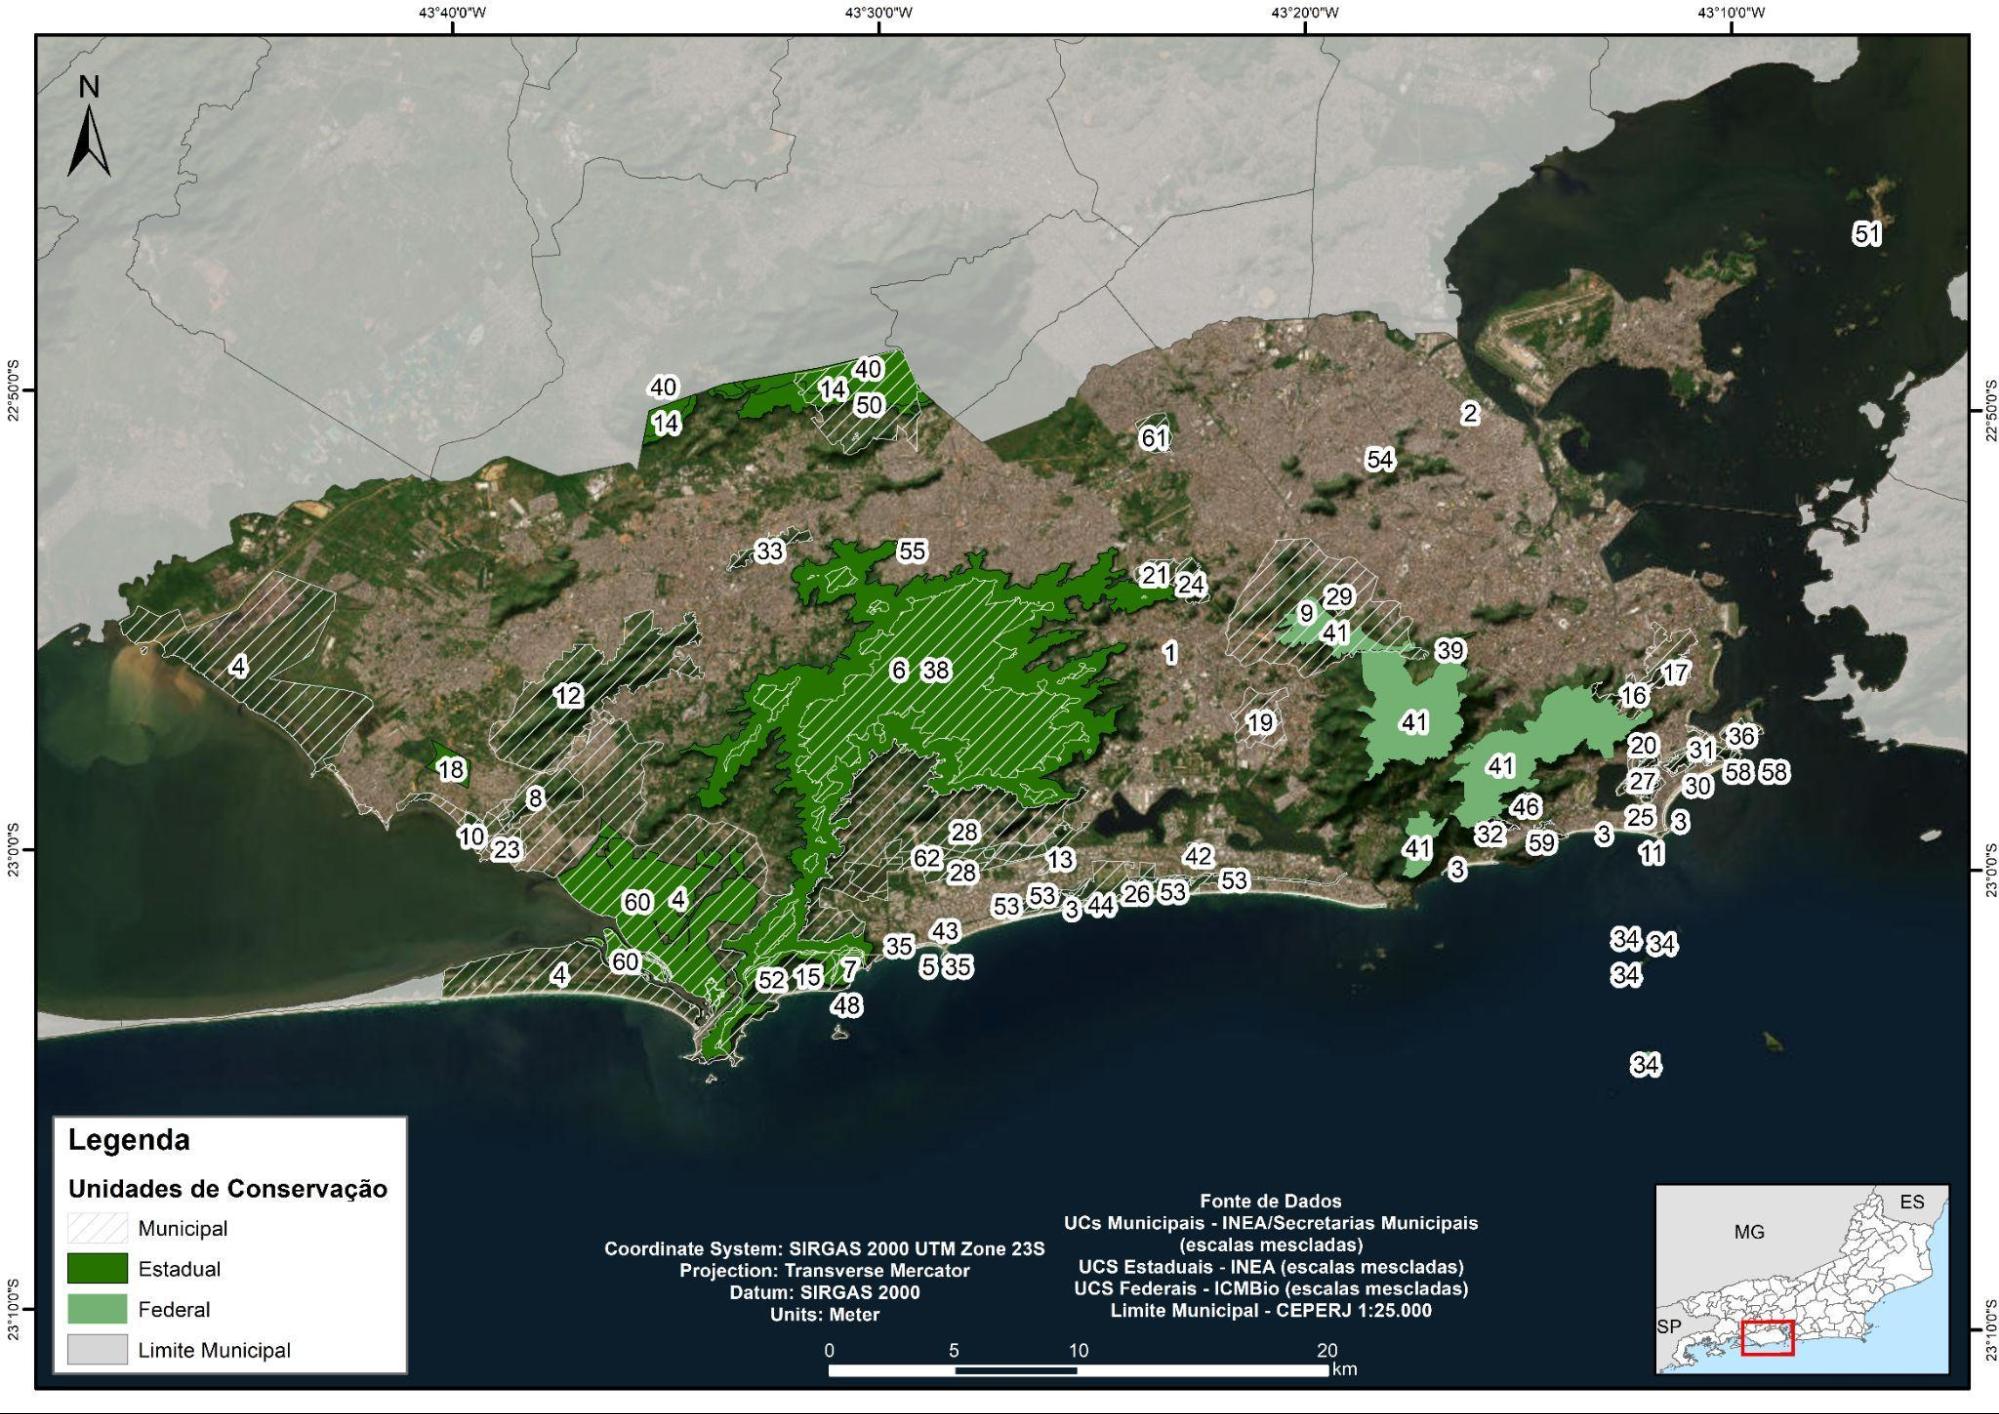
Figure 1: Public municipal, state, and federal Protected Areas within the municipality of Rio de Janeiro.
Source: Authors
Table 1: List of public Protected Areas in the municipality of Rio de Janeiro.
ID | PA Name[1] | Sphere | CNUC Code | Area (ha) |
1 | APA da Fazenda da Taquara | Municipal | 0455.33.1783 | 8,69 |
2 | APA da Fazendinha da Penha | Municipal | Not listed | 13,24 |
3 | APA da Orla Marítima | Municipal | 0455.33.1793 | 127,98 |
4 | APA da Orla Marítima da Baía de Sepetiba | Municipal | 0455.33.1777 | 11.297,83 |
5 | APA da Paisagem e do Areal da Praia do Pontal | Municipal | 0455.33.1791 | 16,06 |
6 | APA da Pedra Branca | Municipal | 0455.33.1795 | 5.386,73 |
7 | APA da Prainha | Municipal | 0455.33.1796 | 150,27 |
8 | APA da Serra da Capoeira Grande | Municipal | 0455.33.1764 | 478,88 |
9 | APA da Serra dos Pretos Forros | Municipal | 0455.33.1797 | 2.715,13 |
10 | APA das Brisas | Municipal | 0455.33.1767 | 100,43 |
11 | APA das Pontas de Copacabana e Arpoador e Seus Entorno | Municipal | 0455.33.1824 | 16,16 |
12 | APA das Serras de Inhoaíba, Cantagalo E Santa Eugênia | Municipal | 0455.33.4378 | 2.227,73 |
13 | APA das Tabebuias | Municipal | 0455.33.1787 | 61,75 |
14 | APA de Gericino-Mendanha | State | 0000.33.0735 | 1.490,04 |
ID | PA Name | Sphere | CNUC Code | Area (ha) |
15 | APA de Grumari | Municipal | 0455.33.1823 | 928,61 |
16 | APA de Santa Teresa | Municipal | Not listed | 515,72 |
17 | APA de São José | Municipal | 0455.33.1825 | 108,89 |
18 | APA de Sepetiba Ii | State | 0000.33.1837 | 171,61 |
19 | APA do Bairro da Freguesia | Municipal | 0455.33.1784 | 379,49 |
20 | APA do Morro da Saudade | Municipal | 0455.33.1817 | 59,47 |
21 | APA do Morro do Cachambi | Municipal | Not listed | 142,41 |
22 | APA do Morro do Leme | Municipal | 0455.33.1799 | 48,74 |
23 | APA do Morro do Silvério | Municipal | 0455.33.1766 | 150,12 |
24 | APA do Morro do Valqueire | Municipal | 0455.33.1782 | 166,08 |
25 | APA do Morro dos Cabritos | Municipal | 0455.33.1816 | 135,46 |
26 | APA do Parque Municipal Ecológico de Marapendi | Municipal | 0455.33.1788 | 938,42 |
27 | APA do Sacopã | Municipal | 0455.33.1820 | 248,55 |
28 | APA do Sertão Carioca | Municipal | 0455.33.4295 | 3.247,43 |
29 | APA do Várzea Country Club | Municipal | 0455.33.1822 | 10,30 |
30 | APA dos Morros da Babilônia E de São João | Municipal | 0455.33.1798 | 112,67 |
31 | APA Paisagem Carioca | Municipal | 0455.33.2903 | 160,89 |
32 | ARIE de São Conrado | Municipal | 0455.33.1826 | 82,27 |
33 | ARIE Floresta da Posse | Municipal | 0455.33.4379 | 171.56 |
34 | MONA do Arquipélago das Ilhas Cagarras | Federal | 0000.00.0034 | 76,47 |
35 | MONA do Recreio dos Bandeirantes | Municipal | 4557.33.4879 | 62,75 |
36 | MONA dos Morros do Pão de Açúcar e Urca | Municipal | 0455.33.1811 | 86,42 |
37 | PE da Chacrinha | State | Not listed | 3,71 |
38 | PE da Pedra Branca | State | 0000.33.1478 | 12.491,72 |
39 | PE do Grajaú | State | Not listed | 54,73 |
40 | PE do Mendanha | State | 0000.33.2904 | 967,11 |
41 | PN da Tijuca | Federal | 0000.00.0154 | 3.958,39 |
42 | PN Bosque da Barra | Municipal | 0455.33.1786 | 54,40 |
43 | PNM Chico Mendes | Municipal | 0455.33.1790 | 40,65 |
44 | PNM da Barra da Tijuca Nelson Mandela | Municipal | Not listed | 162,65 |
45 | PNM da Catacumba | Municipal | 0455.33.1763 | 97,66 |
46 | PNM da Cidade | Municipal | 0455.33.1802 | 46,65 |
47 | PNM da Freguesia | Municipal | 0455.33.1785 | 29,22 |
ID | PA Name | Sphere | CNUC Code | Area (ha) |
48 | PNM da Prainha | Municipal | 0455.33.1803 | 141,27 |
49 | PNM da Serra da Capoeira Grande | Municipal | 0455.33.1765 | 20,99 |
50 | PNM da Serra do Mendanha | Municipal | 0455.33.1769 | 1.390,31 |
51 | PNM Darke de Mattos | Municipal | 0455.33.1801 | 5,10 |
52 | PNM de Grumari | Municipal | 0455.33.1827 | 775,82 |
53 | PNM de Marapendi | Municipal | 0455.33.1789 | 155,61 |
54 | PNM do Jardim do Carmo | Municipal | 0455.33.1814 | 2,55 |
55 | PNM Fazenda do Viegas | Municipal | 0455.33.1778 | 8,49 |
56 | PNM Fonte da Saudade | Municipal | 0455.33.1807 | 2,22 |
57 | PNM José Guilherme Merquior | Municipal | 0455.33.1805 | 8,29 |
58 | PNM Paisagem Carioca | Municipal | 0455.33.2868 | 138,10 |
59 | PNM Penhasco Dois Irmãos - Arquiteto Sérgio Bernardes | Municipal | 0455.33.1800 | 36,91 |
60 | REBIO Estadual de Guaratiba | State | 0000.33.1482 | 2.815,68 |
61 | REVIS da Floresta do Camboatá | Municipal | 0455.33.4351 | 171,58 |
62 | REVIS dos Campos de Sernambetiba | Municipal | 0455.33.4350 | 556,97 |
Source: Authors.
Materials and Methods
The present study used the Carbon Storage and Sequestration model, publicly available on the InVEST (Integrated Valuation of Ecosystem Services and Tradeoffs) platform, developed by the Natural Capital Alliance (NCA, 2016). This model aims to estimate the amount of carbon stored in four reservoirs: above-ground biomass; below-ground biomass; dead biomass; and soil itself.
The model requires two main input data: a raster-format land use and land cover map of the study area; and a biophysical table in csv format containing carbon stock information for each class of the input map across the four reservoirs. However, the simplified nature of the model demands that the input data be highly detailed, robust, and consistent, in order to adequately represent the landscape's complexity.
To this end, a landscape unit map was created by cross-referencing land use and land cover maps, soil types, and potential vegetation of the study area. The result of this step was named Land Use-Soil-Vegetation (USV), in which carbon stock potentials from the original input data were associated with each individual unit.
Thus, to achieve this objective, the following methodological processes were conducted:
- Refinement of traditional land use and land cover mapping using remote sensing and Deep Learning techniques;
- Creation of a database containing ECT values for each land use and land cover in the municipality of Rio de Janeiro, including phytophysiognomic variations of vegetation determined by the potential vegetation map;
- Calculation of carbon stock at 30 cm depth for soil types in the municipality of Rio de Janeiro based on soil profiles from public databases;
- Creation of Soil-Land Use-Vegetation landscape units by cross-referencing land use and land cover layers, soil classes, and potential vegetation;
- Creation of the final biophysical table using literature data on above-ground and below-ground biomass and dead matter; estimated values for soil carbon obtained through direct calculations from available soil profiles.
The final products consisted of a raster-format map expressing the spatial distribution of total carbon stored in the landscape, considering the sum of the four reservoirs, and a map showing carbon stock per hectare (tonC/ha) in each public protected area within the municipality.
4.1 Refinement of the Land Use and Land Cover Map
The geospatial raster-format land use and land cover data used in this study were obtained from collection 9.1 of the MapBiomas platform[2], corresponding to the year 2023. In this mapping, 14 land use and cover classes present in the municipality of Rio de Janeiro were identified, as presented in Table 2.
Table 2: Land Use and Land Cover Classes
Class | Area (ha) |
Forest | 24.724,77 |
Mangrove | 3.062,45 |
Wetlands | 3.166,73 |
Pasture | 5.830,30 |
Mosaic of Uses | 18.537,76 |
Sandy Bodies | 378,22 |
Urban Areas | 57.002,36 |
Other Non-vegetated Areas | 610,92 |
Rocky Outcrop | 135,68 |
Mining | 27,40 |
Aquaculture | 14,68 |
Apicum | 752,64 |
Water Bodies | 1.815,1 |
Arboreal Restinga | 3.940,35 |
Source: MapBiomas
For the refinement of the land use and land cover database, some geoprocessing procedures were carried out. First, the "Forest" class was enhanced using the more detailed-scale vegetation mapping performed by INEA (in press), in which Deep Learning algorithms were applied to the Planet NCFI image mosaic for August 2024. This procedure resulted in a map of existing vegetation in the State of Rio de Janeiro for the year 2024, at an approximate scale of 1:25,000. This detailed base was clipped to the municipality of Rio de Janeiro and incorporated into the MapBiomas mapping, which allowed the identification of fragments of intra-urban green areas, increasing the precision of the spatial representation of vegetation.
Subsequently, the "Arboreal Restinga" class underwent a validation process based on photointerpretation and prior knowledge of its spatial distribution in the municipality. This step was necessary because commission errors regarding this vegetation cover were identified in the original MapBiomas mapping. During this checking step, the Mangrove, Wetlands, Mosaic of Uses, and Pasture classes were also reviewed and corrected, also through photointerpretation. Furthermore, agricultural areas that had not been originally mapped by MapBiomas for the municipality were identified.
Due to the two steps described above, some classes had their areas reduced. For example, the "Mosaic of Uses" class, originally classified by MapBiomas for areas where precise coverage determination was not possible, had a reduction of 17,000 hectares. Thus, after the refinement process, the final Land Use and Land Cover mapping came to include 15 classes, whose respective areas are presented in Table 3.
Table 3: Refined Land Use and Land Cover
Class | Area (ha) | Difference from original MapBiomas area (ha) |
Forest | 42.096,96 | + 17.372,19 |
Mangrove | 4.941,70 | + 1.879,25 |
Wetlands | 6.228,20 | + 3.063,36 |
Pasture | 3.379,54 | - 2.447,14 |
Agriculture | 885,77 | + 885,77 |
Mosaic of Uses | 1.194,32 | - 17.343,45 |
Sandy Bodies | 379,96 | + 1,74 |
Urban Areas | 55.812,94 | - 1.189,41 |
Other Non-vegetated Areas | 592,39 | - 18,53 |
Rocky Outcrop | 129,13 | - 6,55 |
Mining | 27,45 | + 0,05 |
Aquaculture | 14,61 | - 0,07 |
Apicum | 759,84 | + 7,47 |
Water Bodies | 1.624,6 | - 189,52 |
Arboreal Restinga | 781,69 | - 3.159,14 |
Source: Authors, adapted from MapBiomas
4.1.1 Soil-Use-Vegetation Landscape Units
Understanding that carbon stock is directly related to the physical, chemical, and biological characteristics of the environment, the refinement of land use and land cover classes proceeded with the incorporation of information on soil types and potential vegetation phytophysiognomies for the municipality. To this end, geospatial data layers from official agencies were used at the best available scales.
The soil types layer was derived from the Pedological-Geotechnical Mapping of the Municipality of Rio de Janeiro (Lumbreras; Gomes, 2004), at a scale of 1:75,000. Soil classes were grouped according to the methodology proposed by Bernoux et al. (2002), which considers parameters such as clay activity, granulometry, and moisture content to organize them according to carbon storage potential.
Table 4 presents the identified soil types and their respective classification groups. The option to work with soil groups, rather than individual pedological units, aimed to minimize gaps in field surveys related to certain soil types, their physicochemical attributes, and the associated land uses.
Table 4: Grouped soil classes
Soil Group | Characteristic of soils in this group | Soils belonging to the group |
HAC Soils | Non-Oxisols with high clay activity (Ta) | Cambisol, Chernosol, Luvisol |
LAC non-Oxisols | Non-Oxisols with low clay activity (Tb) | Argisol, Cambisol, Litholic Neosol, Nitosol |
LAC Oxisols | Oxisols (naturally low clay activity) | Oxisol |
Sandy Soils | Sandy soils | Spodosol, Quartzarenic Neosol |
Wet Soils | Moist, flooded soils | Gleisol, fluvic Cambisol, fluvic Neosol, Plinthosol |
Other Soils | Others not fitting previous categories | Saline Gleisol, Planosol |
Organosols | Organic matter-rich soils | Organosol |
Undifferentiated Mangrove Soils | Soils of estuarine environments; mangroves | Undifferentiated Mangrove Soils |
Source: Adapted from Bernoux et al. (2002)
Finally, the phytophysiognomy cartographic base was obtained from the Potential Vegetation Mapping, at a scale of 1:100,000, for the entire state of Rio de Janeiro in the context of the publication "The State of the Environment" (INEA, 2010). Although there is a mapping of vegetation cover and land use for the municipality of Rio de Janeiro for the year 2018, at a scale of 1:10,000 (PCRJ, 2018), we opted to use INEA's (2010) production since the vegetation classes are standardized according to the National Inventory (BRASIL, 2016), which in turn uses the methodology of the IBGE Technical Manual on Brazilian Vegetation (2012).
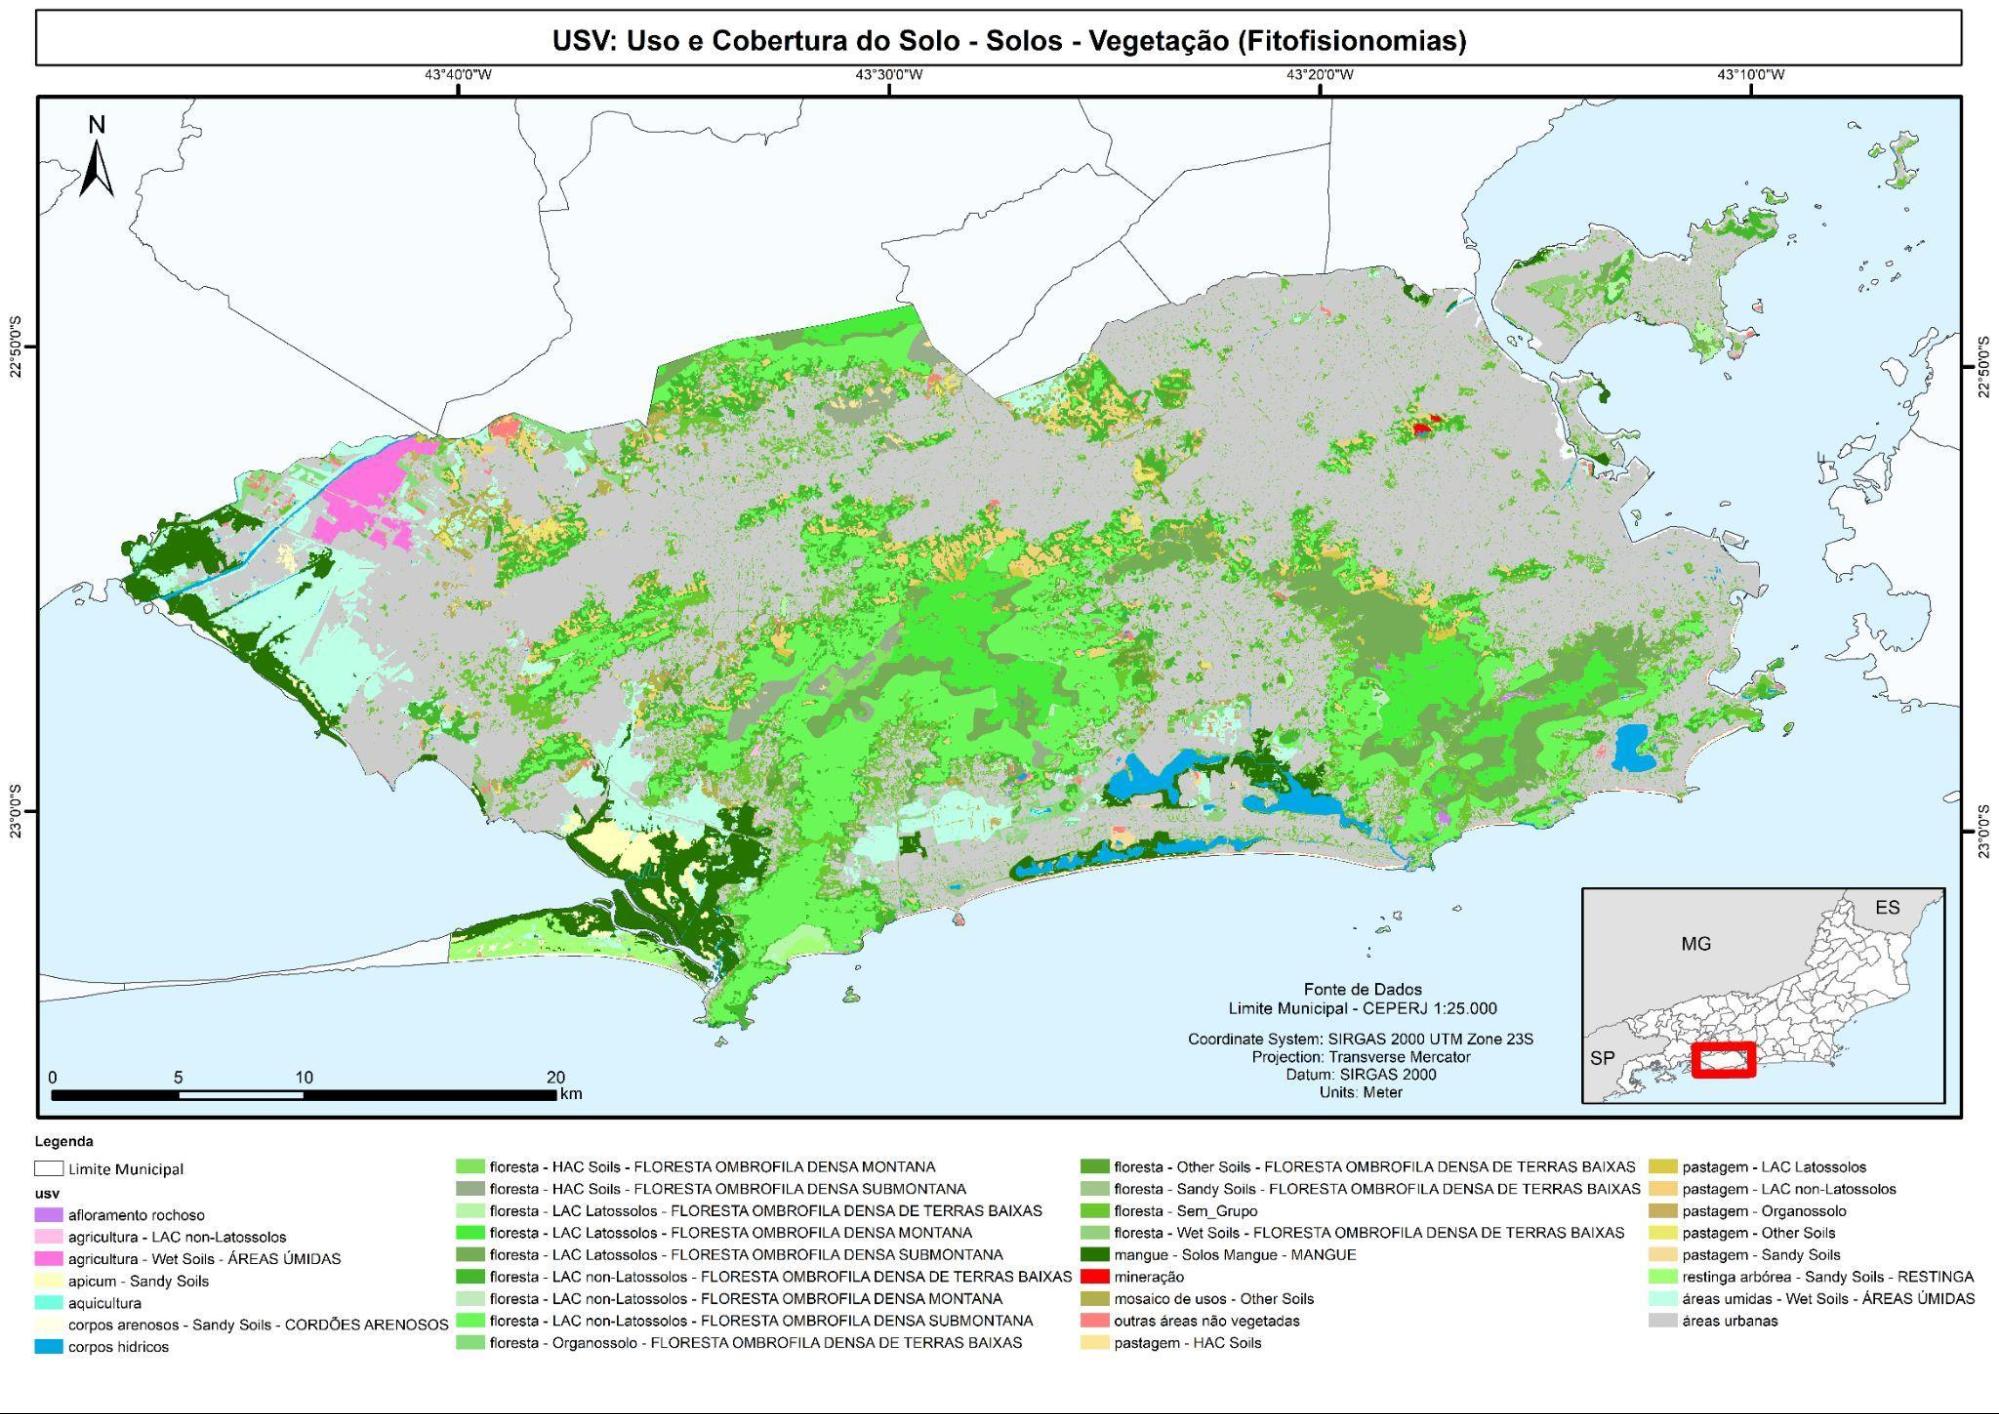
Figure 2 - Soil-Use-Vegetation landscape units in the municipality of Rio de Janeiro
Source: Authors
Due to the scale differences between the bases used, the cross-referencing of the three datasets required cartographic adjustments to ensure topological consistency. In cases where inconsistent polygons occurred after the intersection process, the Eliminate tool, available in the ArcGIS Pro software, was employed, which removes selected polygons according to the nearest neighbor with the largest area rule. The final product resulted in 33 USV landscape units, represented in Figure 2 and Table 5.
Table 5: Soil-Use-Vegetation Landscape Units
Code | Landscape Unit | Area (ha) |
1 | Rocky outcrop | 129,12 |
2 | Agriculture - LAC non-Oxisols | 12,69 |
3 | Agriculture - Wet Soils | 872,75 |
4 | Apicum - Sandy Soils | 759,88 |
5 | Aquaculture | 14,6 |
6 | Wetlands - Wet Soils | 6.228,20 |
7 | Urban areas | 55.806,41 |
8 | Sandy bodies - Sandy Soils | 379,9 |
9 | Water bodies | 1.624,69 |
10 | Forest - HAC Soils - Montane Dense Ombrophilous Forest | 151,1 |
11 | Forest - HAC Soils - Submontane Dense Ombrophilous Forest | 939,8 |
12 | Forest - LAC Oxisols - Lowland Dense Ombrophilous Forest | 483,12 |
13 | Forest - LAC Oxisols - Montane Dense Ombrophilous Forest | 3.937,57 |
14 | Forest - LAC Oxisols - Submontane Dense Ombrophilous Forest | 5.688,43 |
15 | Forest - LAC non-Oxisols - Lowland Dense Ombrophilous Forest | 7.215,84 |
16 | Forest - LAC non-Oxisols - Montane Dense Ombrophilous Forest | 79,47 |
17 | Forest - LAC non-Oxisols - Submontane Dense Ombrophilous Forest | 12.317,5 |
18 | Forest - Organosol - Lowland Dense Ombrophilous Forest | 859,05 |
19 | Forest - Other Soils - Lowland Dense Ombrophilous Forest | 526,83 |
20 | Forest - Sandy Soils - Lowland Dense Ombrophilous Forest | 231,75 |
21 | Forest - No soil group (urban areas) | 9.230,17 |
22 | Forest - Wet Soils - Lowland Dense Ombrophilous Forest | 427,82 |
23 | Mangrove - Undifferentiated Mangrove Soils - Mangrove | 4.940,29 |
24 | Mining | 27,45 |
25 | Mosaic of uses - Other Soils | 1.194,01 |
26 | Other non-vegetated areas | 575,76 |
27 | Pasture - HAC Soils | 78,52 |
28 | Pasture - LAC Oxisols | 335,73 |
29 | Pasture - LAC non-Oxisols | 2.370,52 |
30 | Pasture - Organosol | 118,07 |
31 | Pasture - Other Soils | 391,90 |
32 | Pasture - Sandy Soils | 84,1 |
33 | Arboreal restinga - Sandy Soils - Restinga | 781,45 |
Source: Authors
4.2 Carbon stock in the four carbon reservoirs
To estimate the carbon stock in the above-ground biomass, below-ground biomass, and dead matter/litter reservoirs, reference values obtained from scientific articles, inventories, and national reports were used (BRASIL, 2016; BRASIL, 2020; Zanatta et al., 2020; Mendonça-Santos et al., 2003; Santos, 2015; Mello et al., 2006), with emphasis on the state of Rio de Janeiro and the Atlantic Forest biome.
In the case of determining reference values for soil carbon stock, it should be noted that the data acquisition method through bibliographic review presented limitations, since obtaining these values requires sample collection and the calculation of multiple laboratory parameters, which restricts the availability of consistent data. Given this limitation, an alternative approach was adopted to estimate the carbon stored in the soil classes considered in this study.
For each soil typology found in the Pedological-Geotechnical Mapping of the Municipality of Rio de Janeiro (Lumbreras; Gomes, 2004), it was necessary to associate carbon stock values as part of the methodology for detailing the model's input data. This was done by calculating the carbon stock for soil profiles surveyed in the municipality of Rio de Janeiro, compiled by Lumbreras and Gomes (2004) and publicly available in the Soil Database (BD Solos) of EMBRAPA SOLOS (2014).
The profiles were selected following the criteria of data consistency and sufficient depth for calculation, so that a total of 57 soil profiles were used, in addition to three reference values obtained from Santos (2015), Stam (2021), and Gomes (2023) for soils associated with mangroves and apicuns. However, the original table presented a lack of standardization in information related to Land Use, as well as several gaps in information regarding Land Use, Clay Activity, and Density. Thus, it was necessary to standardize and complement to allow the subsequent calculation of TCS.
Regarding gaps related to land use at the point and date of sample collection, the photointerpretation method was used on Landsat images from 1985, accessed via Google Earth Pro, complemented by detailed descriptions of the collection sites. The choice of this year was due to the temporal proximity to the original collection of the profiles (year 1974).
For gaps in information regarding bulk density, the pedotransfer function suggested by Benites et al. (2007) was used, in their Model 4, illustrated in equation (1):
 (1)
(1)

Where:
Db = Soil bulk density
N = Nitrogen
Clay = Clay
SB = Sum of basic cations ( ,
,  , e
, e  )
)
 = iron oxide
 = Carbon/Nitrogen ratio
 = Water dispersible clay
 = aluminum oxide
 = Calcium added to Magnesium
Finally, for gaps regarding clay activity, the formula presented in Ronquim (2010) was used, in which CEC is calculated from the sum of bases at pH 7.0 (2):
 +
+ + +
+ + +
+ +
+  (2)
(2)
Where:
CTC = Cation Exchange Capacity
= Calcium ions
= Magnesium ions
= Potassium ions
 = Sodium ions
 = Hydrogen ions
= Aluminum ions
For results greater than or equal to 24 
 , Ta was assigned, referring to high clay activity, and values below 24 as Tb. The parameter of 24 was used to agree with the methodology used by Bernoux et al. 2002.
Next, the soils were distributed into the groups suggested by Bernoux et al. (2002), presented earlier in Table 4, which take into account, mainly, the clay activity in each profile, expressed as Ta (high) and Tb (low), which directly influences carbon storage capacity.
With all gaps filled, the TCS calculation was performed for each horizon of each soil profile using the parameters of organic carbon content, bulk density, and horizon thickness (Fidalgo et al., 2007), considering the standard maximum thickness of 30 cm depth. The adoption of this depth followed the methodological guidelines of the IPCC (2006) and mainly reflects limitations in the availability and standardization of pedological data at the municipal scale. However, it is recognized that this choice implies a systematic underestimation of the actual soil carbon stock, especially in environments such as dense ombrophilous forests, mangroves, and wetlands, where a significant portion of carbon is stored at greater depths. TCS was calculated according to the equation:
 (3)
(3)
Where:
 = total carbon in the horizon in kg m-2 ,
C = organic carbon content in g kg-1 ,
DS = soil density estimated according to equation (1) in g cm-3, and
E = horizon thickness in cm.
4.3 Integration with Protected Areas
Finally, the analyses with the Protected Areas took place in the last stage, after running the model and obtaining the final map of the total carbon stock estimate at a depth of 30 cm. The PAs from the three spheres were grouped into a single vector geospatial layer, which served as a mask for performing zonal statistics to obtain the accumulated carbon stored in the PAs as a whole.
Thus, the analyses were carried out using tons per hectare (tC/ha) as the unit of measurement, in order to normalize the relationship of carbon density in each protected area and eliminate the total area factor, which could bias the results. First, the TCS value of each PA (total tonC) was calculated by summing all carbon stock pixels within its respective territory. Subsequently, the obtained value was divided by the area of each PA, in order to obtain the average carbon stock per hectare per PA (tonC/ha).
Finally, statistical metrics of minimum, maximum, median, and standard deviation were extracted to evaluate the distribution of carbon storage in the PAs within the municipality of Rio de Janeiro. Furthermore, the carbon stock values per hectare per PA were grouped by natural breaks to enable the elaboration of a frequency histogram and its accumulations.
- Results and Discussions
Figure 3 presents the final map of the TCS estimate, considering the four reservoirs in tons per pixel for the city of Rio de Janeiro. It should be noted that each pixel of the final raster is approximately 30m x 30m, i.e., about 900 m², which allows for better visualization for the territory of Rio de Janeiro.
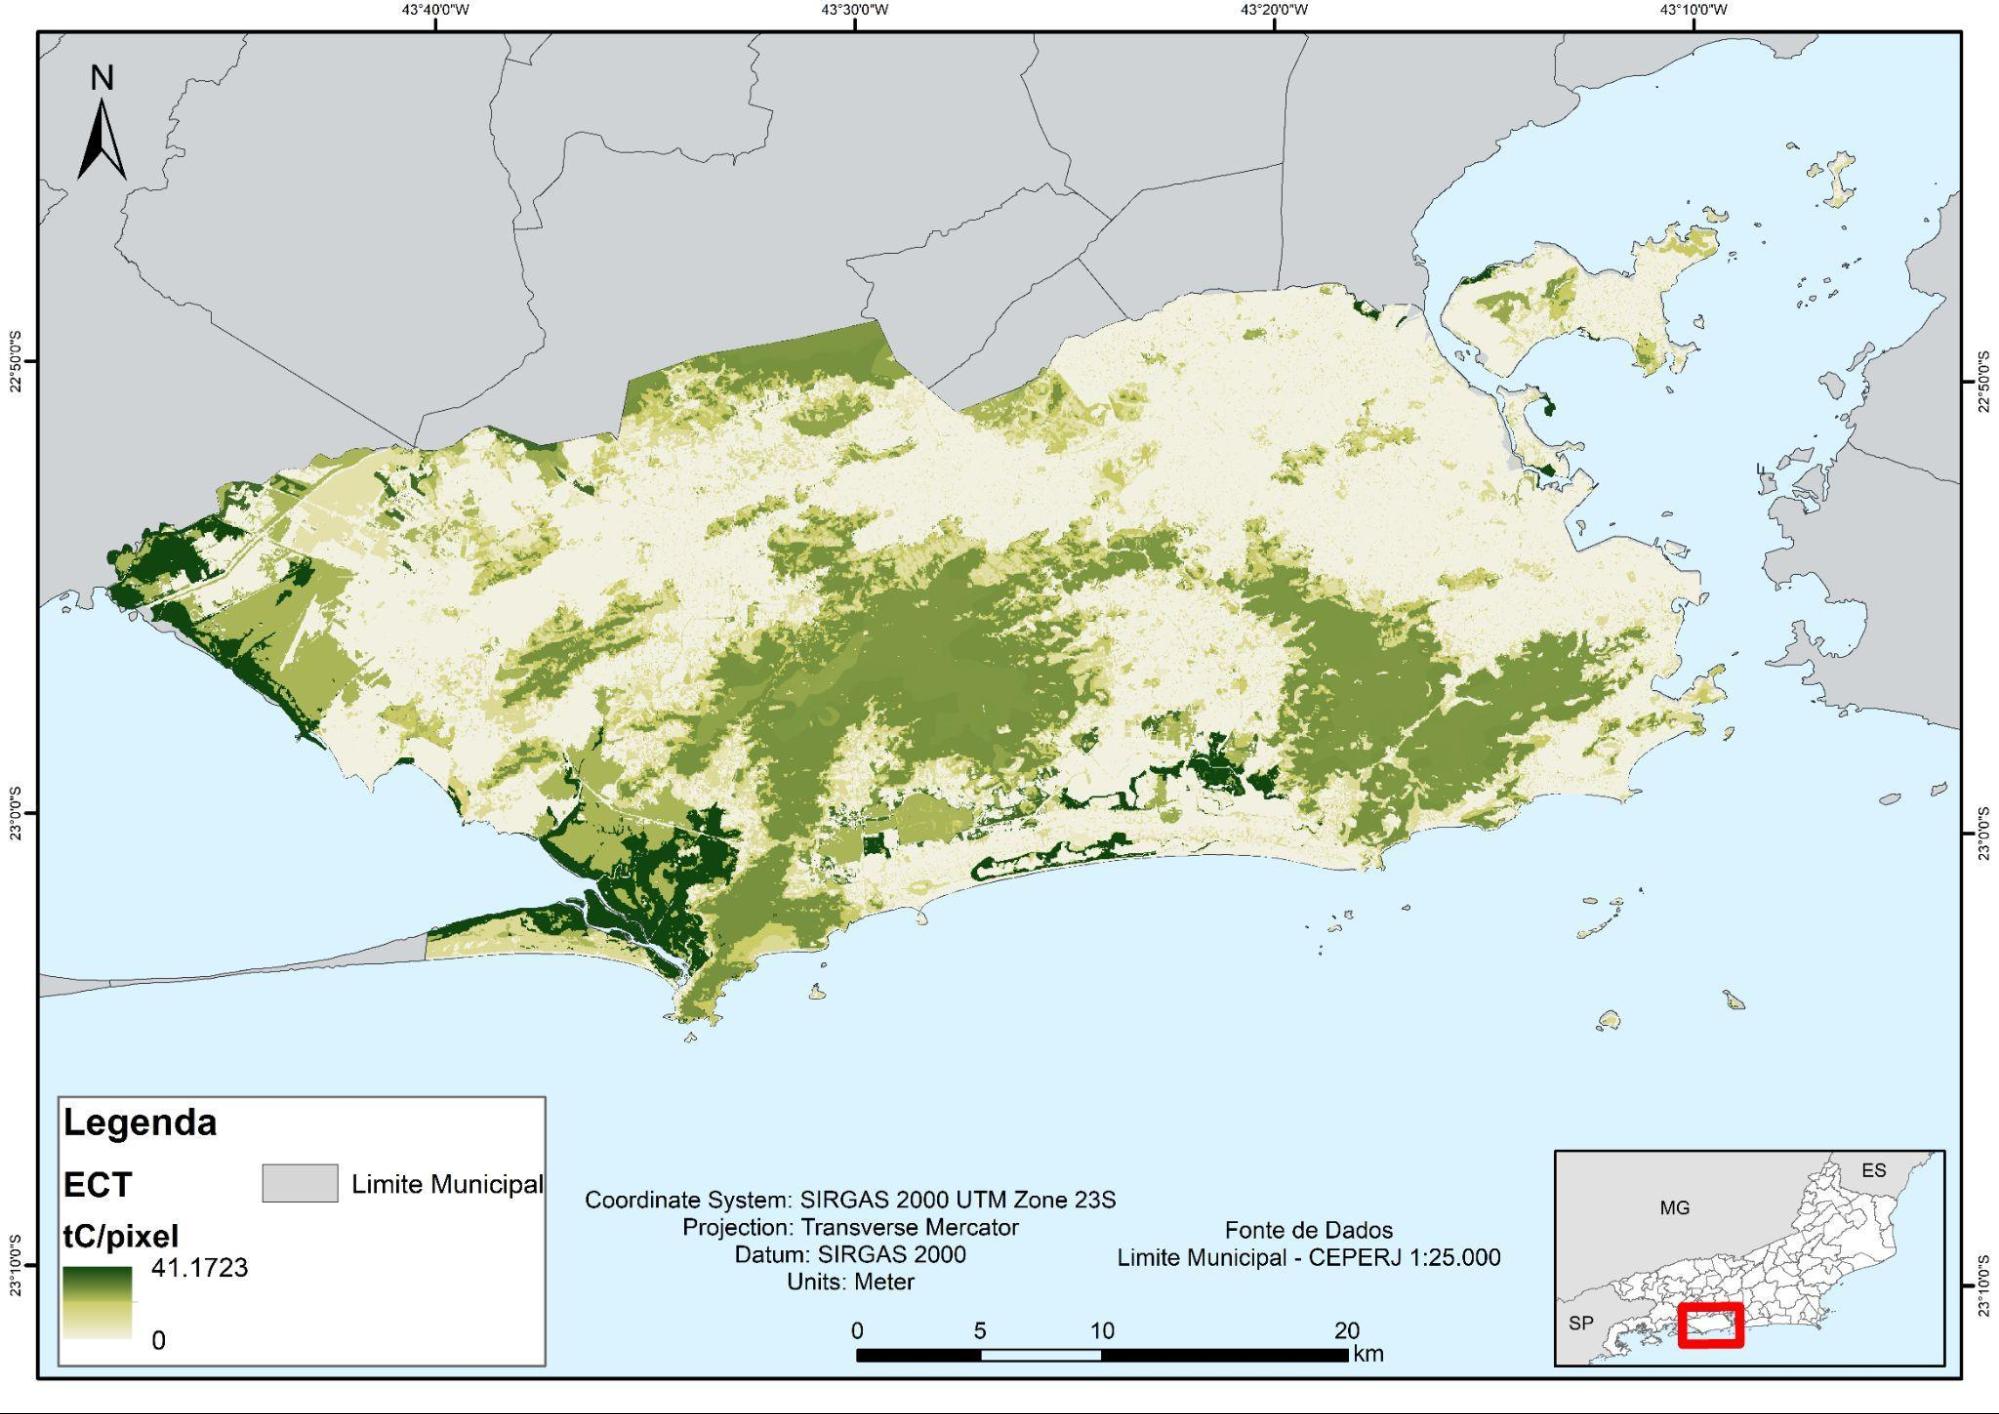
Figure 3: Estimate of Total Carbon Stock in the municipality of Rio de Janeiro.
Source: Authors
In general, it was observed that the highest values occur in lowland areas where there are mangrove and wetland covers, followed by forested areas in the Tijuca, Pedra Branca, and Mendanha massifs. The result obtained shows significant emphasis on some landscape units where natural vegetation covers and soils with greater carbon storage potential predominate.
Thus, a maximum TCS value of 41.17 tC/pixel was found in areas of natural mangrove cover and other humid environments associated with hydromorphic soils (wet soils). The landscape units formed by different forest phytophysiognomies presented a minimum TCS value of 10.5 t/pixel in intra-urban green areas, and a maximum of 27.17 tC/pixel in lowland dense ombrophilous forests associated with Organosols.
Also noteworthy were the Apicum areas, whose average carbon stock value corresponded to 18.40 tC/pixel, and Pastures associated with Organosols, which presented an average value of 15.77 tC/pixel. The other landscape units presented values ranging between 3 and 13 tC/pixel, corresponding to landscape units with degraded vegetation cover and/or soils with low storage potential.
Regarding the storage capacity in the protected areas present in the municipality, Figure 4 spatially represents a zonal statistic of the PAs in relation to TCS, in the unit of tons per hectare. Table 6 presents the list of values found ordered from highest to lowest, associated with the respective PAs.
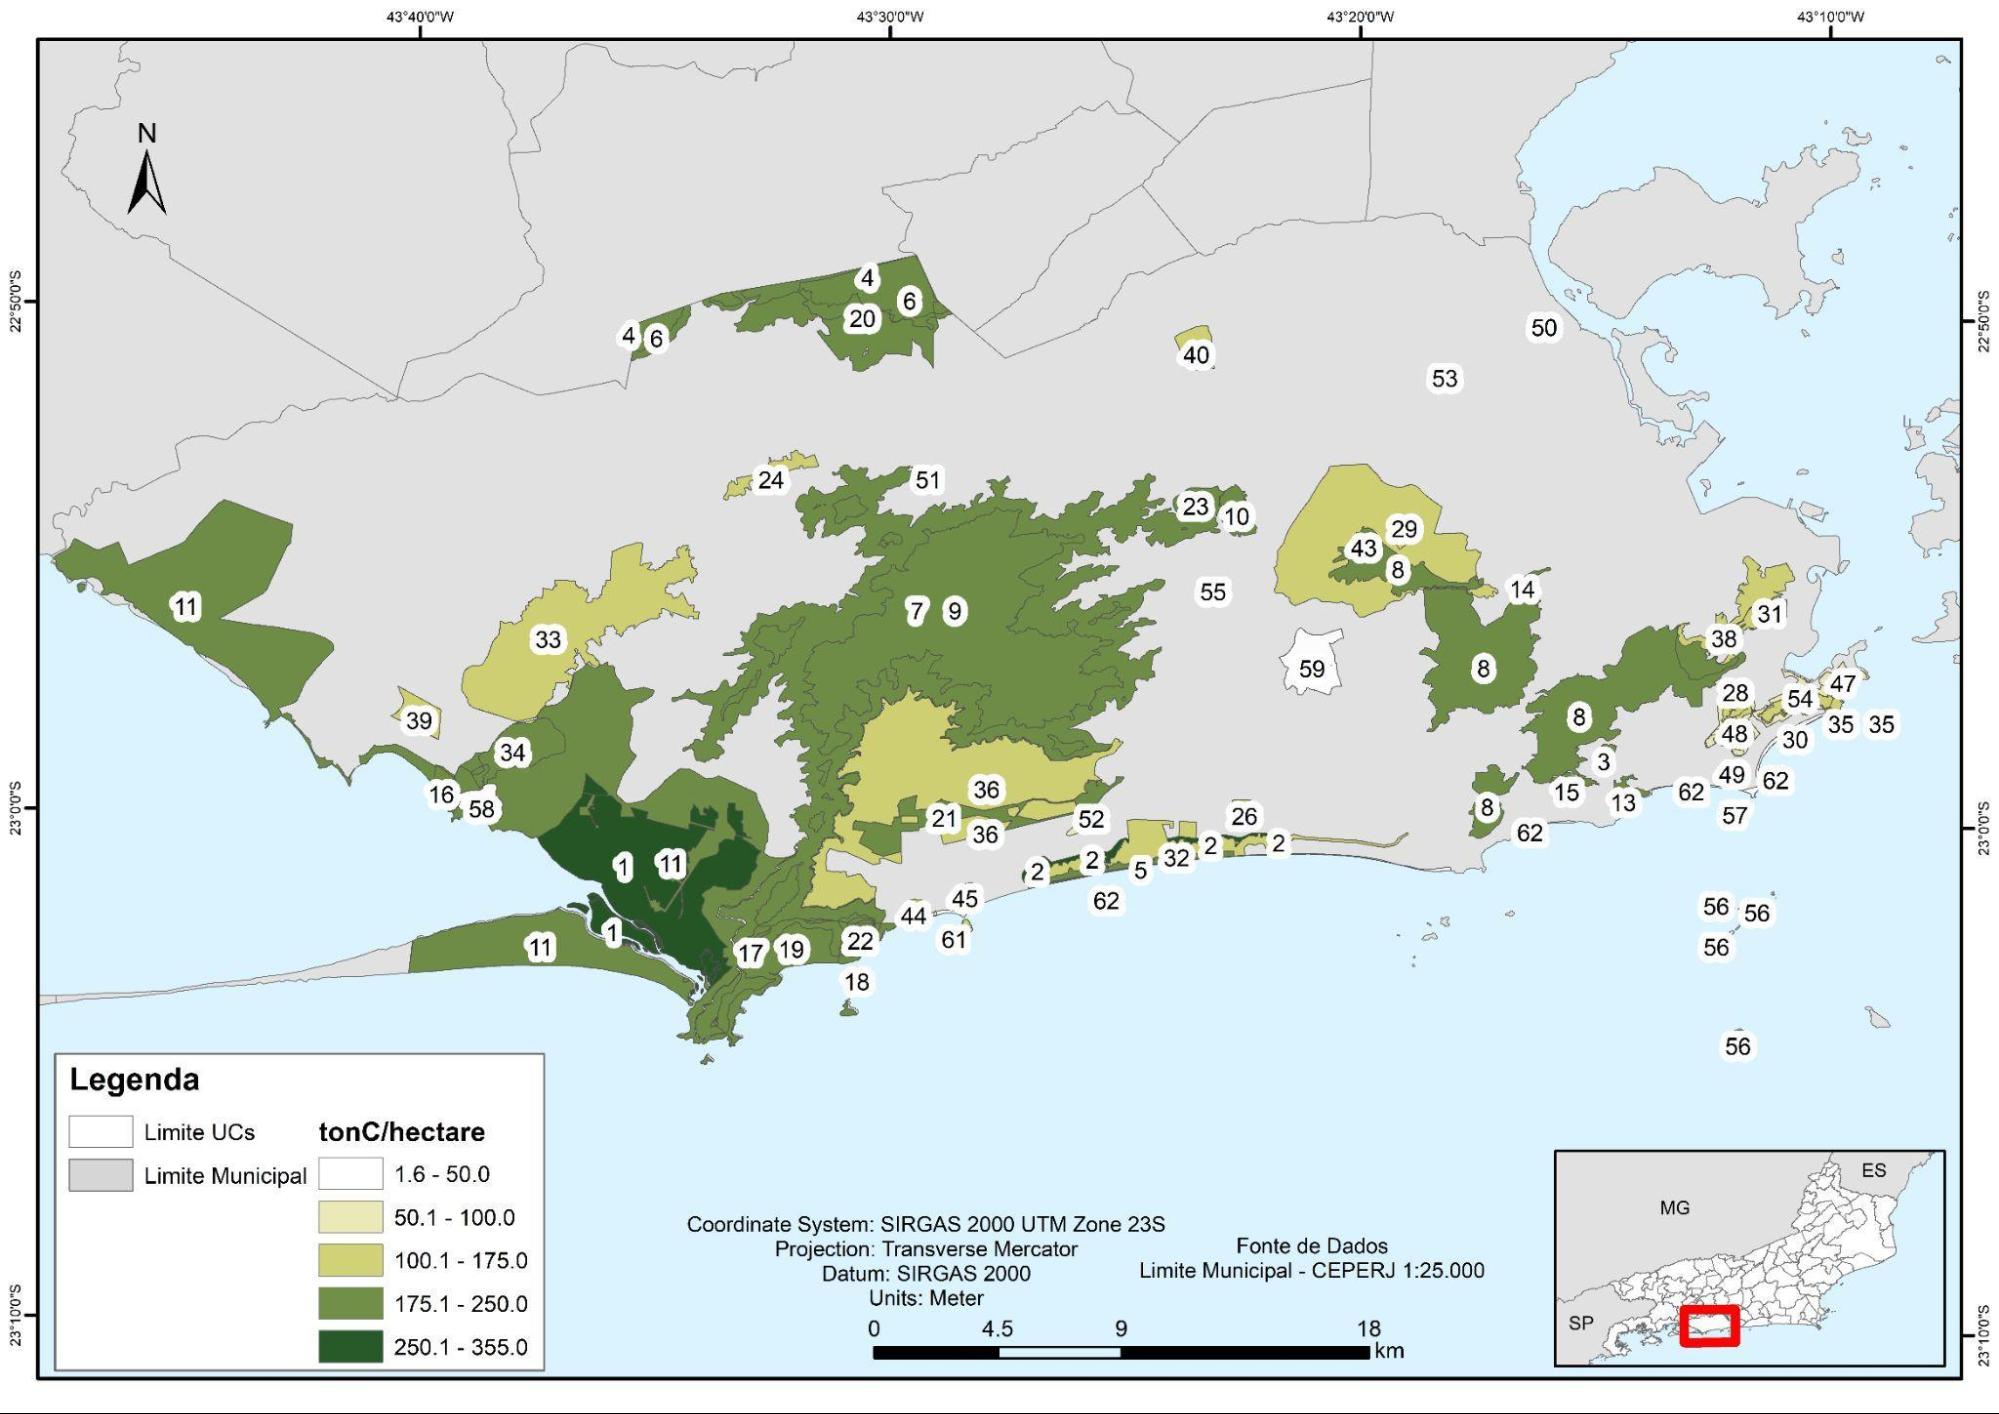
Figure 4: Zonal Statistics of Carbon Stock per Hectare in PAs and ranking of protected areas.
Source: Authors
Table 6: Values of Zonal Statistics of Total Carbon Stock in PAs.
Ranking | PA Name | Sphere | Área (ha) | TonC (total) | TonC/ha |
1 | REBIO Estadual de Guaratiba | State | 2,815.7 | 999,676.0 | 355.0 |
2 | PNM de Marapendi | Municipal | 155.6 | 53,058.9 | 341.0 |
3 | PNM da Cidade | Municipal | 46.6 | 11,387.8 | 244.1 |
4 | PE do Mendanha | State | 967.1 | 230,813.3 | 238.7 |
5 | PNM da Barra da Tijuca Nelson Mandela | Municipal | 162.7 | 38,517.0 | 236.8 |
6 | APA de Gericinó-Mendanha | State | 1,490.0 | 349,971.8 | 234.9 |
7 | APA da Pedra Branca | Municipal | 5,386.7 | 1,232,838.7 | 228.9 |
8 | PN da Tijuca | Federal | 3,958.4 | 903,921.5 | 228.4 |
9 | PE da Pedra Branca | State | 12,491.7 | 2,772,495.5 | 221.9 |
10 | APA do Morro do Valqueire | Municipal | 166.1 | 36,545.4 | 220.0 |
11 | APA da Orla Marítima da Baía de Sepetiba | Municipal | 11,297.8 | 2,384,395.8 | 211.0 |
12 | PE da Chacrinha | State | 3.7 | 776.6 | 209.2 |
13 | PNM Penhasco Dois Irmãos | Municipal | 36.9 | 7,698.1 | 208.6 |
14 | PE do Grajaú | State | 54.7 | 11,234.9 | 205.3 |
15 | ARIE de São Conrado | Municipal | 82.3 | 16,752.9 | 203.6 |
16 | APA da Brisas | Municipal | 100.4 | 20,380.5 | 202.9 |
17 | PNM de Grumari | Municipal | 775,8 | 154.673,6 | 199,4 |
18 | PNM da Prainha | Municipal | 141,3 | 28.157,5 | 199,3 |
19 | APA de Grumari | Municipal | 928,6 | 182.604,4 | 196,6 |
20 | PNM da Serra do Mendanha | Municipal | 1.390,3 | 270.859,6 | 194,8 |
21 | REVIS dos Campos de Sernambetiba | Municipal | 557,0 | 108.374,4 | 194,6 |
22 | APA da Prainha | Municipal | 150,3 | 28.839,4 | 191,9 |
23 | APA do Morro do Cachambi | Municipal | 142,4 | 25.557,6 | 179,5 |
24 | ARIE Floresta da Posse | Municipal | 171,6 | 29.940,3 | 174,5 |
25 | PNM Fonte da Saudade | Municipal | 2,2 | 359,8 | 161,9 |
26 | PNM Bosque da Barra | Municipal | 54,4 | 8.521,0 | 156,6 |
27 | PNM da Serra da Capoeira Grande | Municipal | 21,0 | 3.224,8 | 153,6 |
28 | APA do Morro da Saudade | Municipal | 59,5 | 8.890,7 | 149,5 |
29 | APA do Várzea Country Club | Municipal | 10,3 | 1.523,9 | 148,0 |
30 | APA dos Morros da Babilônia e de São João | Municipal | 112,7 | 16.639,4 | 147,7 |
31 | APA de São José | Municipal | 108,9 | 15.835,3 | 145,4 |
32 | APA do Parque Municipal Ecológico de Marapendi | Municipal | 938,4 | 135.738,9 | 144,6 |
33 | APA da Serras de Inhoaíba Cantagalo e Santa Eugênia | Municipal | 2.227,7 | 321.789,5 | 144,4 |
34 | APA da Serra da Capoeira Grande | Municipal | 478,9 | 69.032,1 | 144,2 |
35 | PNM Paisagem Carioca | Municipal | 138,1 | 19.193,3 | 139,0 |
36 | APA do Sertão Carioca | Municipal | 3.247,4 | 426.981,1 | 131,5 |
37 | PNM da Freguesia | Municipal | 29,2 | 3.800,7 | 130,1 |
38 | APA de Santa Teresa | Municipal | 515,7 | 66.968,0 | 129,9 |
39 | APA de Sepetiba Ii | State | 171,6 | 21.430,7 | 124,9 |
40 | REVIS da Floresta do Camboatá | Municipal | 171,6 | 21.260,2 | 123,9 |
41 | APA do Morro do Leme | Municipal | 48,7 | 5.815,4 | 119,3 |
42 | PNM José Guilherme Merquior | Municipal | 8,3 | 977,1 | 117,9 |
43 | APA da Serra dos Pretos Forros | Municipal | 2.715,1 | 295.589,2 | 108,9 |
44 | MONA do Recreio dos Bandeirantes | Municipal | 62,7 | 6.645,2 | 105,9 |
45 | PNM Chico Mendes | Municipal | 40,6 | 4.271,6 | 105,1 |
46 | PNM da Catacumba | Municipal | 97,7 | 10.084,9 | 103,3 |
47 | MONA dos Morros do Pão de Açúcar e Urca | Municipal | 86,4 | 8.139,1 | 94,2 |
48 | APA do Sacopã | Municipal | 248,5 | 22.925,4 | 92,2 |
49 | APA do Morro dos Cabritos | Municipal | 135,5 | 12.369,8 | 91,3 |
50 | APA da Fazendinha da Penha | Municipal | 13,2 | 1.195,3 | 90,3 |
51 | PNM Fazenda do Viegas | Municipal | 8,5 | 705,4 | 83,1 |
52 | APA da Tabebuias | Municipal | 61,7 | 4.672,8 | 75,7 |
53 | PNM do Jardim do Carmo | Municipal | 2,5 | 176,4 | 69,2 |
54 | APA Paisagem Carioca | Municipal | 160,9 | 10.423,9 | 64,8 |
55 | APA da Fazenda da Taquara | Municipal | 8,7 | 548,7 | 63,1 |
56 | MONA do Arquipélago da Ilhas Cagarras | Federal | 76,5 | 3.607,9 | 47,2 |
57 | APA da Pontas de Copacabana e Arpoador e seus entornos | Municipal | 16,2 | 597,6 | 37,0 |
58 | APA do Morro do Silvério | Municipal | 150,1 | 5.386,8 | 35,9 |
59 | APA do Bairro da Freguesia | Municipal | 379,5 | 11.543,0 | 30,4 |
60 | PNM Darke de Mattos | Municipal | 5,1 | 86,9 | 17,0 |
61 | APA da Paisagem e do Areal da Praia do Pontal | Municipal | 16,1 | 88,2 | 5,5 |
62 | APA da Orla Marítima | Municipal | 128,0 | 212,0 | 1,65 |
Source: Authors
From the zonal statistics it was found that the average TCS value was 147.7 tonC/ha, while the median corresponded to 145 tonC/ha, which would indicate an approximately symmetric distribution. However, the standard deviation found was 74.1 tonC/ha, evidencing considerable heterogeneity in the carbon stock values of public PAs in the municipality of Rio de Janeiro.
The maximum value found was 355 tonC/ha, relating to the Guaratiba State Biological Reserve, even though it has a smaller territorial dimension compared to others. This result is supported by the scientific literature, which demonstrates that Brazilian mangroves can store between 2.2 and 4.3 times more carbon in the first meter of soil compared to other vegetated biomes in the country (Rovai et al., 2021). Complementary results indicate that mangrove soils have the highest carbon stocks among Brazilian biomes, standing out as environments of high relevance for the carbon cycle (Camargo, 2022).
Similarly, the Marapendi Municipal Natural Park, composed mostly of mangrove cover, has an estimated value of 341 tonC/ha. The slight drop in TCS is due to the fact that this PA is also formed by other types of natural cover, such as restingas, forests, and even part of the Marapendi lagoon, which reduces the average tons of carbon accumulated per hectare.
Tijuca National Park and Pedra Branca State Park, which are the largest urban green areas in the municipality, presented estimated values of 228 and 222 tC/ha, respectively. As illustrated earlier, forests tend to store less carbon than wetland and mangrove areas. However, in this case, the soil type is also considered in carbon storage capacity. Both PAs are composed mostly of Oxisols, which occupy a large part of the PAs and have lower carbon storage capacity (Fidalgo et al., 2007).
Regarding the analysis grouped by natural breaks of the distribution of carbon stock values per hectare, Figure 5 shows the frequency histogram and the accumulated percentage by interval considering the data generated by the zonal statistics.
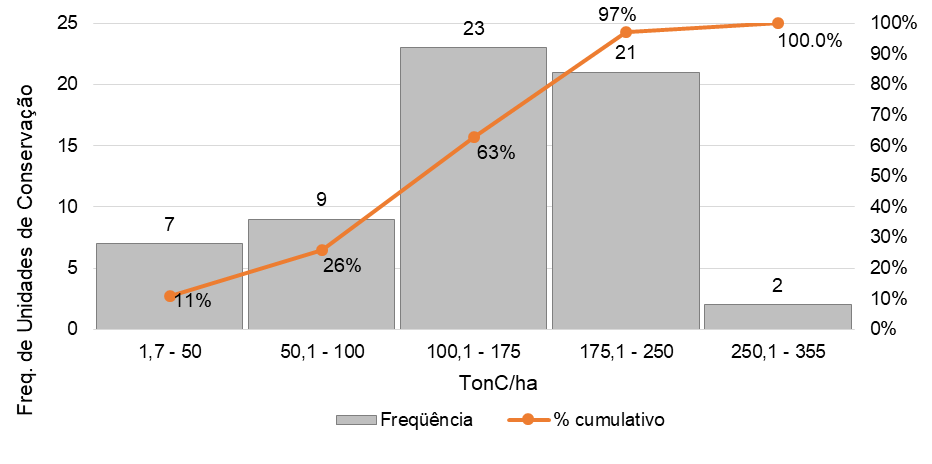
Figure 5: Frequency histogram and accumulated frequency of carbon stock values per hectare grouped by natural breaks.
Source: Authors
It was possible to observe that most of the data are at intermediate values, especially between 100.1 and 250 tonC/ha, with very few very low or very high observations. This concentration illustrates the larger number of PAs covering dense ombrophilous forest phytophysiognomies, especially submontane and montane, associated with low clay activity soils. However, this interval also includes PAs that contain, in some proportion, intra-urban forests, pasture areas on organic soils, restingas, and wetlands.
It was also possible to observe a positive asymmetry generated by the two PAs in the highest value interval that may be influencing the mean. These PAs cover mangrove areas and hydromorphic soils (wet soils), whose carbon storage capacity was above 350 tonC/ha. This fact highlights the need for further public actions to conserve remnants and restore areas of this ecosystem to expand the strategy for adapting to climate change.
- Conclusion
The methodological proposal, as well as its application, met the objectives of this work. The application of the InVEST 3.14 Carbon Storage and Sequestration model combined with the detailed refinement of land use and land cover mapping to create the Soil-Use-Vegetation landscape units allowed representing, in detail and with greater precision, the heterogeneity of the landscape. In addition, the refinement of the biophysical table based on the calculation of soil profiles associated with national reference values allowed obtaining a satisfactory result within the existing limitations.
The results show that the combination of vegetation types and pedological characteristics is crucial for specifying carbon storage potential, and that the detailing of databases substantially improves the accuracy of the applied models. Even so, limitations related to the scale of soil mapping and the absence of specific data in densely urbanized areas indicate the need for advances in higher-resolution soil surveys.
It was found that humid environments and mangroves are primarily responsible for carbon accumulation, especially the Guaratiba State Biological Reserve and the Marapendi Municipal Natural Park, whose high values highlight the strategic role of conserving these ecosystems in mitigating climate change. The Ombrophilous Forests, although presenting lower values when compared to mangrove areas, also proved to be extremely relevant, especially in the municipality's massifs, reinforcing their ecological and climatic role.
However, the interpretation of the results must consider certain methodological limitations. Firstly, the absence of direct field validation (in situ) for this study implies that the results are modeled estimates based on robust secondary data, but not measured locally for this specific purpose. This means that there may be overestimation or underestimation of the results.
Secondly, setting soil depth at 30 cm underestimates the total carbon stock, especially in undifferentiated mangrove soils. According to Donato et al. (2011), mangroves contain on average 1,023 tC/ha, in which the soil compartment was responsible for storing 49-98% of the carbon, at depths ranging from 0.5 to 3 meters. Therefore, the values presented here should be seen as a baseline (conservative) scenario for the municipality.
Furthermore, the study reaffirms the importance of protected areas as essential components of climate mitigation in large urban centers, in addition to proposing a robust and replicable methodological basis. The expansion of detailed mapping and continued monitoring are fundamental to improve estimates, guide public policies, and strengthen integrated environmental and climate planning strategies in the municipality of Rio de Janeiro.
After identifying the main difficulties and methodological challenges, the subsequent stages of the study will be directed towards its improvement and refinement. Initially, it is intended to reproduce the analysis based on PCRJ (2018) data, aiming to refine the working scale. In parallel, a strategic plan will be developed for conducting field campaigns aimed at collecting sample points distributed throughout the state territory, as well as performing in situ measurements, in accordance with the methodology proposed by Arévalo, Alegre and Vilcahuamán (2002).
Finally, we seek to incorporate seasonal variability into land use and land cover mapping, considering that certain classes, especially wetlands, present significant variations in their extent throughout the year. In this sense, the development of distinct mappings for different seasonal periods constitutes a relevant strategy to identify possible fluctuations in carbon storage capacity.
References
AB’SÁBER, Aziz. Os domínios de natureza no Brasil: potencialidades paisagísticas. São Paulo: Ateliê Editorial, 2003.
AMARAL, Felipe Gonçalves et al. Sistemas verdes urbanos no Rio de Janeiro: novas perspectivas a partir de multissensores e análise em micro escala. Coleção Estudos Cariocas, v. 13, n. 4, 2026. DOI:10.71256/19847203.13.4.200.2025.
ANTUNES, Melissa Casacchi; CAMPOS, Tácio Mauro Pereira de; ARARUNA JÚNIOR, José Tavares. Soil carbon storage and retention: a critical synthesis on concepts, research opportunities and sustainable application in environmental engineering. Revista Brasileira de Ciências Ambientais, [S. l.], 2025. DOI: 10.5327/Z2176-94782704.
AREVALO, Luis Alberto; ALEGRE, Julio Cesar; VILCAHUAMAN, Luciano Javier Montoya. Metodologia para estimar o estoque de carbono em diferentes sistemas de uso da terra. Colombo: Embrapa Florestas, 2002. 41 p. (Documentos, 73).
BEILLOUIN, Damien et al. A global database of land management, land-use change and climate change effects on soil organic carbon. Scientific Data, v. 9, n. 228, 2022. DOI: 10.1038/s41597-022-01318-1.
BENITES, Vinícius de Melo et al. Pedotransfer functions for estimating soil bulk density from existing soil survey reports in Brazil. Geoderma, v. 139, p. 90–97, 2007. DOI: 10.1016/j.geoderma.2007.01.005.
BERNOUX, Martial et al. Brazil’s soil carbon stocks. Soil Science Society of America Journal, v. 66, p. 888–896, 2002.
BRASIL. Ministério da Ciência, Tecnologia e Inovação. Quarto Inventário Nacional de Emissões e Remoções Antrópicas de Gases de Efeito Estufa – Relatório de Referência. Brasília, 2020. 314 p.
BRASIL. Ministério da Ciência, Tecnologia e Inovação. Relatório do Inventário Nacional das Emissões Antrópicas por Fontes e das Remoções por Sumidouros de Gases de Efeito Estufa do Brasil: Primeiro Relatório Bienal de Transparência à Convenção-Quadro das Nações Unidas sobre Mudança do Clima (Relatório do Inventário Nacional | 1990-2022). Brasília, 2024. 642 p.
BRASIL. Ministério da Ciência, Tecnologia e Inovação. Terceira Comunicação Nacional do Brasil à Convenção-Quadro das Nações Unidas sobre Mudança do Clima: volume III. Brasília, 2016. 336 p.
CAMARGO, Suzana. Solo dos manguezais tem o maior estoque de carbono do Brasil. O Eco, 2022. Available at: https://oeco.org.br/reportagens/solo-dos-manguezais-tem-o-maior-estoque-de-carbono-do-brasil/. Accessed on: 19 nov. 2025.
D’ANDREA, Alexandre Fonseca et al. Estoque de carbono orgânico do solo em remanescente de Floresta Alta de Restinga na Mata Atlântica setentrional. In: Congresso Brasileiro de Ciência do Solo, 35., 2015, Natal. Anais… Natal: SBCS, 2015.
DON, A. et al. Carbon sequestration in soils and climate change mitigation—definitions and pitfalls. Global Change Biology, [S. l.], e16983, 2023. doi: 10.1111/gcb.16983.
DONATO, Daniel C. et al. Mangroves among the most carbon-rich forests in the tropics. Nature Geosci, [S. l.], v. 4, p. 293–297, 2011. DOI: https://doi.org/10.1038/ngeo1123.
EMPRESA BRASILEIRA DE PESQUISA AGROPECUÁRIA (EMBRAPA). Sistema de Informação de Solos. Brasília, 2014. Available at: https://www.bdsolos.cnptia.embrapa.br/consulta_publica.html. Accessed on: 12 nov. 2025.
FIDALGO, Elaine Cristina Cardoso et al. Estoque de carbono nos solos do Brasil. Rio de Janeiro: Embrapa Solos, 2007.
FOOD AND AGRICULTURE ORGANIZATION OF THE UNITED NATIONS (FAO). The state of food and agriculture 2019: moving forward on food loss and waste reduction. Rome: FAO, 2019.
FONSÊCA, Nathan C. et al. Carbon stock in aboveground biomass and necromass in the Atlantic Forest. Anais da Academia Brasileira de Ciências, [S. l.], v. 96, n. 1, e20220761, 2024.
GAMEIRO, Samuel et al. Quantifying terrestrial carbon in the context of climate change. Carbon Balance and Management, [S. l.], v. 20, n. 25, 2025. DOI: 10.1186/s13021-025-00316-1.
GOMES, Arthur Alves Prates. Acúmulo e estoque de carbono na Manguezal de Atapuz, sistema estuarino de Itapessoca, Goiana (PE). 2023. Dissertação (Mestrado em Oceanografia) – Universidade Federal de Pernambuco, Recife, 2023.
HE, Y. et al. Spatio-temporal evolution and prediction of carbon storage in Guilin based on FLUS and InVEST models. Remote Sensing, v. 15, n. 5, art. 1445, 2023.
HOUGHTON, R. A.; HALL, F.; GOETZ, S. J. Importance of biomass in the global carbon cycle. Journal of Geophysical Research, v. 114, G00E03, 2009.
HOUGHTON, R. A. Land-use change and the carbon cycle. Global Change Biology, v. 1, p 275 - 287, 1995.
INSTITUTO BRASILEIRO DE GEOGRAFIA E ESTATÍSTICA (IBGE). Manual técnico da vegetação brasileira. 2. ed. Rio de Janeiro, 2012.
INSTITUTO BRASILEIRO DE GEOGRAFIA E ESTATÍSTICA (IBGE). Área territorial brasileira. Rio de Janeiro, 2022. Available at: https://www.ibge.gov.br.
INSTITUTO ESTADUAL DO AMBIENTE (INEA). O Estado do Ambiente - Indicadores Ambientais do Rio de Janeiro. Rio de Janeiro, 2010.
INSTITUTO ESTADUAL DO AMBIENTE (INEA). Mapeamento da Vegetação no Estado do Rio de Janeiro. Rio de Janeiro: INEA, no prelo.
INSTITUTO ESTADUAL DO AMBIENTE (INEA). Portal GeoINEA – Informações geoespaciais do Estado do Rio de Janeiro. Rio de Janeiro, 2018. Available at: https://geoportal.inea.rj.gov.br. Accessed on: 04 feb. 2026.
INTERGOVERNMENTAL PANEL ON CLIMATE CHANGE (IPCC). Climate Change 2001: Synthesis Report. A Contribution of Working Groups I, II, and III to the Third Assessment Report of the Intergovernmental Panel on Climate Change. Editores: Watson, R. T. e Core Writing Team. Cambridge: Cambridge University Press, 2001. 398 p.
INTERGOVERNMENTAL PANEL ON CLIMATE CHANGE (IPCC). Climate change and land. Geneva, 2019.
INTERGOVERNMENTAL PANEL ON CLIMATE CHANGE (IPCC). Guidelines for national greenhouse gas inventories. Geneva, 2006.
LUMBRERAS, J. F.; GOMES, J. B. V. Mapeamento pedológico e interpretações úteis ao planejamento ambiental do município do Rio de Janeiro. Rio de Janeiro: Embrapa Solos, 2004.
MELLO, F. F. C. et al. Potential of soil carbon sequestration for the Brazilian Atlantic Region. In: LAL, R. et al. (ed.). Carbon sequestration in soils of Latin America. New York: The Haworth Press, 2006. p. 353–373.
MENDONÇA-SANTOS, Maria de Lourdes et al. Quantificação e distribuição espacial do carbono orgânico na paisagem e em perfis de solos do Município do Rio de Janeiro. Rio de Janeiro: Embrapa Solos, 2003. 20 p. (Embrapa Solos. Boletim de Pesquisa e Desenvolvimento, 39).
MINISTÉRIO DO MEIO AMBIENTE E MUDANÇA DO CLIMA (MMA). Cadastro Nacional de Unidades de Conservação da Natureza (CNUC). Brasília: MMA, 2026. Available at: https://cnuc.mma.gov.br/. Accessed on: mar. 2026.
NATURAL CAPITAL ALLIANCE (NCA). InVEST 3.14.0. Stanford University, University of Minnesota, Chinese Academy of Sciences, The Nature Conservancy, World Wildlife Fund, Stockholm Resilience Centre and the Royal Swedish Academy of Sciences, 2016. Available at: https://naturalcapitalalliance.stanford.edu/software/invest
NOGUEIRA JÚNIOR, Laura Rodrigues. Estoque e sequestro de carbono em florestas e sistemas de produção agrícola - Software InVEST. In: Serviços ecossistêmicos e serviços ambientais de solo, água e carbono em sistemas de produção agrícola e florestal no bioma Amazônia. Brasília, DF: Embrapa, 2023. cap. 6, p. 149-157.
NWAOGU, Chukwudi. et al. Three-decades assessment of land use changes and soil carbon stocks. Environmental Research Communications, v. 7, art. 055021, 2025.
PEDREIRA, Luiz Octavio Lima; ANDRADE, Felipe Noronha; FICO, Brasiliano Vito. Índices de áreas verdes do município do Rio de Janeiro: nota técnica n. 37. Rio de Janeiro: Prefeitura da Cidade do Rio de Janeiro, 2017. Available at: https://www.researchgate.net/profile/Brasiliano-Fico/publication/344000002_Nota_Tecnica_Indices_de_Areas_Verdes_do_Municipio_do_Rio_de_Janeiro_Nota_Tecnica_-N_37_Indices_de_Areas_Verdes_do_Municipio_do_Rio_de_Janeiro/links/5f4d8a11458515a88ba0e512/Nota-Tecnica-Indices-de-Areas-Verdes-do-Municipio-do-Rio-de-Janeiro-Nota-Tecnica-N-37-Indices-de-Areas-Verdes-do-Municipio-do-Rio-de-Janeiro.pdf. Accessed on: apr. 2026.
PREFEITURA DA CIDADE DO RIO DE JANEIRO (PCRJ). Uso do solo 2018. Rio de Janeiro: Prefeitura da Cidade do Rio de Janeiro, [2018]. Available at: https://www.data.rio/datasets/PCRJ::uso-do-solo-2018/about.
PHUKUBYE, K. et al. On the impact of grassland management on soil carbon stocks. Geoderma Regional, v. 28, 2022.
RONQUIM, Carlos Cesar. Conceitos de fertilidade do solo e manejo adequado para as regiões tropicais. Campinas: Embrapa Monitoramento por Satélite, 2010. 26 p. (Embrapa Monitoramento por Satélite. Boletim de Pesquisa e Desenvolvimento, 8)
ROVAI, Andre S. et al. Brazilian mangroves: blue carbon hotspots of national and Global Relevance to Natural Climate Solutions. Frontiers in Forests and Global Change, v. 4, 2021.
SANTOS, Daniel Medina Corrêa. Estoque de carbono na biomassa subterrânea de florestas de mangue. 2015. Tese (Doutorado em Meio Ambiente) – Universidade do Estado do Rio de Janeiro, Rio de Janeiro, 2015.
SCHIMEL, David S. Terrestrial ecosystems and the carbon cycle. Global Change Biology, [S. l.], v. 1, n. 1, p. 77-91, 1995.
SHARMA, Richa et al. Spatio-Temporal Assessment of Urban Carbon Storage and Its Dynamics Using InVEST Model. Land, v. 13, n. 9, art. 1387, 2024. DOI: https://doi.org/10.3390/land13091387.
SILVA, Ane Cristine Fortes da et al. Carbon in forest species of the Atlantic Forest as an indicator of stocks and quality. Floresta, Curitiba, v. 51, n. 3, p. 630-638, jul./set. 2021
STAM, Gilberto. Planícies associadas às florestas de mangue retiram carbono da atmosfera. Revista Pesquisa FAPESP, São Paulo, 9 jun. 2021. Available at: https://revistapesquisa.fapesp.br/planicies-associadas-as-florestas-de-mangue-retiram-carbono-da-atmosfera/
VEIGA, Larissa Giorgeti. Variação do estoque de madeira morta em diferentes altitudes de Floresta Ombrófila Densa Atlântica. 2008. Monografia (Graduação em Ciências Biológicas) – UNESP, Botucatu, 2008.
VILLANOVA, Paulo Henrique et al. Necromass Carbon Stock in a Secondary Atlantic Forest Fragment in Brazil. Forests, [s. l.], v. 10, n. 10, 833, 2019.
WANG, Ruei-Yuan. et al. Comparison of the CASA and InVEST models effects for estimating spatiotemporal differences in carbon storage of green spaces in megacities. Scientific Reports, [S. l.], v. 14, 2024. DOI: https://doi.org/10.1038/s41598-024-55399-x
ZAFAR, Zeeshan et al. Predictive modeling of regional carbon storage dynamics in response to land use/land cover changes: An InVEST-based analysis. Ecological Informatics, [S. l.], v. 82, art. 102701, 2024. DOI: https://doi.org/10.1016/j.ecoinf.2024.102701.
ZANATTA, Josiléia Acordi et al. Índice de alteração do carbono no solo. Colombo: Embrapa Florestas, 2020
About the Authors
Beatriz Ambrosio Garcia de Oliveira holds a Bachelor's degree in Mathematical and Earth Sciences from the Federal University of Rio de Janeiro (UFRJ), and was an environmental analyst at the State Institute for the Environment, where she developed this research. Currently, she is a Master's student in Geology and an undergraduate student in Geography, both at the same institution.
Victor Buznello de Vasconcellos Maluf holds a Master's degree, a teaching license, and a Bachelor's degree in Geography from the Fluminense Federal University (UFF), and is a Specialist in Environmental Management from the Polytechnic School of UFRJ. He currently serves as a technical staff member at the State Institute for the Environment of Rio de Janeiro, acting as Head of the Ecosystem Management Service.
Paulo Vinicius Rufino Fevrier is a geographer from the State University of Rio de Janeiro (UERJ), holds a Master's degree in Geography and is a specialist in Quaternary Geology, both from UFRJ. He currently holds the position of Manager at the Territory Management and Geospatial Information Division of INEA.
Authors’ Contributions
Conceptualization, [B.A.G.O, V.B.V.M]; methodology, [B.A.G.O, V.B.V.M, P.V.R.F]; software, [B.A.G.O]; validation, [B.A.G.O, V.B.V.M]; formal analysis, [B.A.G.O, V.B.V.M]; investigation, [B.A.G.O, V.B.V.M]; data curation, [B.A.G.O, V.B.V.M, P.V.R.F]; writing – original draft preparation, [B.A.G.O]; writing – review and editing, [B.A.G.O, V.B.V.M]; supervision, [V.B.V.M, P.V.R.F]. All authors have read and agreed to the published version of the manuscript.
Acknowledgments
The author acknowledges the contributions of Professor Marilena Gomes Ribeiro (in memoriam) for the legacy of her Varig memorabilia collection, which sparked and initiated studies on the cultural landscape of Rio de Janeiro through tourism promotion posters.
Conflicts of Interest
The author declares no conflicts of interest.
About Coleção Estudos Cariocas
Coleção Estudos Cariocas (ISSN 1984-7203) is a publication dedicated to studies and research on the Municipality of Rio de Janeiro, affiliated with the Pereira Passos Institute (IPP) of the Rio de Janeiro City Hall.
Its objective is to disseminate technical and scientific production on topics related to the city of Rio de Janeiro, as well as its metropolitan connections and its role in regional, national, and international contexts. The collection is open to all researchers (whether municipal employees or not) and covers a wide range of fields — provided they partially or fully address the spatial scope of the city of Rio de Janeiro.
Articles must also align with the Institute’s objectives, which are:
- to promote and coordinate public intervention in the city’s urban space;
- to provide and integrate the activities of the city’s geographic, cartographic, monographic, and statistical information systems;
- to support the establishment of basic guidelines for the city’s socioeconomic development.
Special emphasis will be given to the articulation of the articles with the city's economic development proposal. Thus, it is expected that the multidisciplinary articles submitted to the journal will address the urban development needs of Rio de Janeiro.
[1] SNUC categories - APA: Environmental Protection Area; ARIE: Area of Relevant Ecological Interest; MONA: Natural Monument; PE: State Park; PN: National Park; PNM: Municipal Natural Park; REVIS: Wildlife Refuge; REBIO: Biological Reserve.
[2] MapBiomas Project – Collection 9.1 of the Annual Series of Land Cover and Land Use Maps of Brazil, accessed in 2025, available at: https://brasil.mapbiomas.org/colecoes-mapbiomas/