
Volume 13 Issue 4 *Corresponding author irvingbadolato@eng.uerj.br Submitted 23 nov 2025 Accepted 05 jan 2026 Published 30 jan 2026 Citation BADOLATO, I. S.; MOTA, G. L. A.; COSTA, G. A. O. P. Latent potential for updating three-dimensional roof models of buildings in the municipality of Rio de Janeiro. Coleção Estudos Cariocas, v. 13, n. 4, 2026.
DOI: 10.71256/19847203.13.4.201.2025 The article was originally submitted in PORTUGUESE. Translations into other languages were reviewed and validated by the authors and the editorial team. Nevertheless, for the most accurate representation of the subject matter, readers are encouraged to consult the article in its original language.


| Latent potential for updating three-dimensional roof models of buildings in the municipality of Rio de Janeiro Potencial latente para atualização dos modelos tridimensionais de cobertura das edificações do município do Rio de Janeiro Potencial latente para la actualización de modelos tridimensionales de cubiertas de edificaciones del municipio de Río de Janeiro Irving da Silva Badolato1, Guilherme Lucio Abelha Mota2 and Gilson Alexandre Ostwald Pedro da Costa3 1Universidade do Estado do Rio de Janeiro, R. São Francisco Xavier, 524, Rio de Janeiro, RJ, ORCID 0000-0002-4058-4392, irvingbadolato@eng.uerj.br 2Universidade do Estado do Rio de Janeiro, R. São Francisco Xavier, 524, Rio de Janeiro, RJ, ORCID 0000-0003-2336-6024, guimota@ime.uerj.br 3Universidade do Estado do Rio de Janeiro, R. São Francisco Xavier, 524, Rio de Janeiro, RJ, ORCID 0000-0001-7341-9118, gilson.costa@ime.uerj.br
AbstractTo demonstrate applicable improvements to the urban cadastre of the city of Rio de Janeiro, state-of-the-art techniques for 3D building modeling were investigated, focusing on the geometric detailing of roofs. The experiments subjected data from a previous cadastre to automated processing, using open-source software, to increase the level of detail of pre-existing features, optimizing resources, in a pioneering initiative for large cities in the Global South. The results are useful for various environmental studies, by incorporating new characteristics into urban records, and highlight human intervention as an essential element for ensuring quality. Keywords: 3D building model, level of detail, CityGML
Resumo Para demonstrar melhorias aplicáveis ao cadastro urbano da cidade do Rio de Janeiro, foram investigadas técnicas do estado da arte para modelagem 3D de edificações, com foco no detalhamento geométrico das coberturas. Os experimentos submeteram dados de um cadastro anterior a processamento automatizado, com software livre, para aumento do nível de detalhamento de feições pré-existentes, otimizando recursos, em uma iniciativa pioneira para grandes cidades do Sul Global. Os resultados são úteis a diversos estudos ambientais, ao incorporar novas características aos registros urbanos, e valorizam a atuação humana como elemento essencial para a garantia da qualidade. Palavras-chave: modelo de edificações 3D, nível de detalhamento, CityGML
ResumenPara demostrar mejoras aplicables al catastro urbano de la ciudad de Río de Janeiro, se investigaron técnicas de vanguardia para el modelado 3D de edificios, centrándose en el detalle geométrico de las cubiertas. Los experimentos sometieron datos de un catastro previo a procesamiento automatizado mediante software de código abierto para aumentar el nivel de detalle de los elementos preexistentes y optimizar recursos, en una iniciativa pionera para las grandes ciudades del Sur Global. Los resultados son útiles para diversos estudios ambientales, al incorporar nuevas características a los registros urbanos y destacar la intervención humana como un elemento esencial para garantizar la calidad. Palabras clave: modelo de edificio 3D, nivel de detalle, CityGML |
Introduction
The form of buildings can vary significantly among urban settings, which may be associated with factors such as the level of local development, topography, climate, culture, and the age of buildings. Urban asset management requires feature-rich, up-to-date, and accurate models, within margins compatible with the problem under study. In addition to the planimetric built area, these models must consider the altimetric variations of urban objects. Although the development and maintenance of three-dimensional city models represent challenges that have been partially addressed, recent efforts in computer-vision-based photogrammetry provide evidence of scientific interest in improving the results offered (Lussange et al., 2025).
Remote sensing techniques provide relevant sources for the generation of 3D models, although cadastral surveys also contribute to their enrichment. Images and point clouds obtained by sensors onboard aerial or orbital platforms preserve records (raw or minimally processed) of real built forms. However, their analysis requires intensive computational processing. Developing applications based on these datasets requires the individualization of objects of interest, such as buildings, and the abstraction of features. The greater the level of preserved features, the greater the human and computational efforts tend to be.
By representing the built environment and other urban elements with reasonable accuracy, three-dimensional city models attract the interest of public managers, private companies, and civil society. According to Biljecki et al. (2015), the growing interest in these models stems from their wide range of applications, such as cadastre, virtual visits, change detection, urban planning, mobility analysis, emergency response, environmental studies, and quality-of-life assessment. In environmental studies, buildings or parts of them, such as roofs and façades, form physical barriers in various phenomena. Their surfaces are far less permeable than tree vegetation and more complex than terrain and other elements of urban infrastructure. This motivates the discussion on the levels of detail required and feasible for their representation in the dynamics of phenomena applied to different environmental studies.
With regard to solar exposure and the formation of shaded areas, for example, buildings interact by reducing the incidence of direct solar radiation and contributing to diffuse and/or specular propagation (depending on the surface), requiring computation through algorithms such as ray tracing (Robinson; Stone, 2004). This use of building models can enable the production of radiation maps for estimating shading over time, with direct applications in energy efficiency, the identification of urban heat islands, and thermal comfort estimation. This allows the analysis of microclimatic impacts due to the addition of new buildings or the simulation of vertical growth within the pre-existing urban volume (Falcão et al., 2025). In addition, building roof models can also be enriched through the mapping of superstructures such as chimneys, tree canopies, skylights, or machinery, improving estimates of solar potential (Krapf et al., 2022b).
Similarly, these algorithms can be used in studies on noise propagation and noise pollution, which requires the estimation of reflection and absorption indices of mechanical waves for different classes of objects on the terrain (Stoter et al., 2020). In telecommunications projects, this can be adapted to verify the coverage or occlusion of electromagnetic waves, when planning device configurations and assessing interference related to signal shadows and the impacts of new constructions, supporting the optimization and operation of urban networks (Seilov et al., 2021).
In the contexts of urban ventilation and pollutant dispersion, buildings directly influence velocity fields, turbulence, and atmospheric flow dispersion. These effects are usually investigated through computational fluid dynamics and, in more detailed applications, through large eddy simulation (Buccolieri; Hang, 2019), which allow a more faithful representation of the interaction between urban morphology and transport processes.
In turn, flood dynamics are traditionally based on terrain elevation models and estimates of land use, permeability, and retention capacities. The explicit incorporation of building geometry makes it possible to define patterns of capture, storage, and routing of surface runoff more accurately. Recognizing these patterns contributes to flood risk analysis and the development of strategies for sustainable urban drainage (Wang, C. et al., 2019). This also allows refinements in the assessment of the contribution of green roofs, detention reservoirs, and rainwater harvesting systems to urban resilience (Angrill et al., 2017).
Defining levels of detail for city models helps formalize needs and capacities for abstracting the urban environment when surveying the requirements of each application. Global map services, for example, benefit from the availability of building projections offered in models with lower levels of detail, due to the more compact volumetry of these representations. In addition, these services benefit from the wide availability of algorithms capable of automating feature capture at this level of detail, even in regions mapped using different Earth Observation techniques. In turn, block models, which comprise an intermediate level of detail, may be more suitable for strategic planning analyses and rapid visualization. Finally, building models at higher levels, with detailed geometries and semantic distinction of observed surfaces (roofs and façades), serve engineering applications, environmental simulations, and other spatial data queries that require high fidelity to the real world.
The relevance of efforts to provide official models at different levels of detail is evident in the limitations of traditional urban cadastres in adequately representing building geometry and semantics (Biljecki et al., 2015). This deficiency hinders the adoption of three-dimensional urban models at more advanced levels of detail. To the best of our knowledge, when available, high-level-of-detail vector models are mostly concentrated in cities of the Global North (Wysocki et al., 2024). In metropolitan cities such as Rio de Janeiro, it is of interest to assess the applicability of techniques successfully employed with large volumes of data in other regions.
Taking as a reference the dataset accumulated over years to update urban cadastral bases and the systems published by the municipal administration, it can be concluded that the building model is compatible with an intermediate level of detail. Thus, the vector building records of the current municipal cadastre can be delivered at a block level of detail, more specifically at Level of Detail 1 (LoD 1) of the CityGML standard (Gröger; Plümer, 2012). This standard, maintained by the Open Geospatial Consortium (OGC), defines levels of detail and a conceptual model for the representation, storage, and exchange of urban data.
An example of the application of the LoD 1 model, demonstrated in the Reviver Centro[1] project of the Municipal Secretariat for Urban Development and Licensing, makes it possible to visualize properties under monitoring in the city. The main resource used by the viewer is the municipal vector building database of the City of Rio de Janeiro, which contains planimetric and altimetric information on building footprints. Although useful for rapid visualizations, the block model is not recommended for applications sensitive to roof shapes. Asymmetric constructions, as illustrated in Figure 1, or complex ones may be difficult to represent under this type of modeling.
In this study, the main objective was to propose an approach for cadastral updating aimed at incorporating new attributes into urban records, enabling compatibility of the building model at Level of Detail 2 (LoD 2). This level assumes the explicit representation of roof geometries and their semantic separation from façades and other construction elements. To assess the feasibility of the proposal, municipal data were processed using open-source software originally developed to enable such models in the Netherlands[2] (Peters et al., 2022).
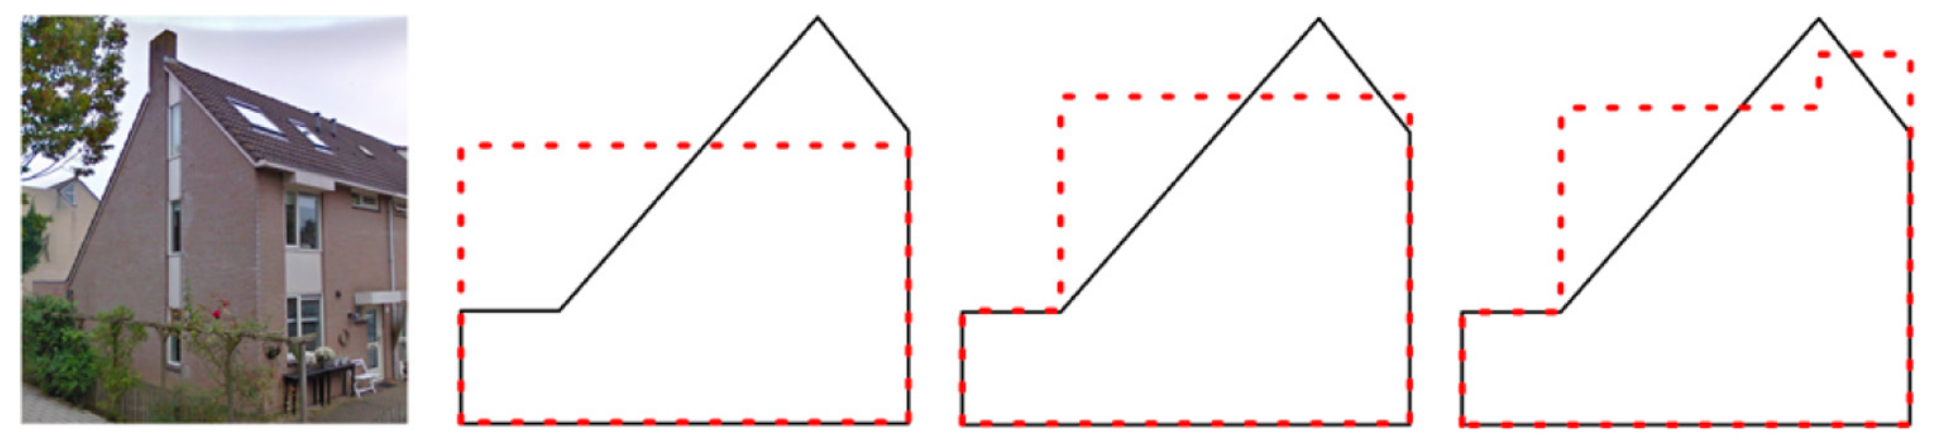
Figure 1: Three different possibilities for block modeling of a building (saltbox)
Source: (Stoter et al., 2020)
The remaining sections of this article are organized as follows: Section 2 addresses related work on the same topic, emphasizing the theoretical context; Section 3 characterizes the municipal datasets and justifies the choices of spatial subsets; Section 4 presents the methodology employed to apply the algorithms to the new dataset; Section 5 presents and discusses the results obtained; and Section 6 provides the final considerations of this study.
- Related work
The literature on the production of 3D building models presents different approaches that may result in different levels of detail. Starting with the data sources addressed, these may be derived either from aerial or orbital surveys or from terrestrial surveys. Optionally, pre-existing data from formal building cadastres may be incorporated, such as architectural plans, multipurpose cadastres, real estate records, and official cartographic databases that describe the geometry, use, and occupation of buildings. These approaches may also differ according to their methodological bases, which may focus either on data or on models, and it is also possible to find hybrid approaches or ones that are difficult to categorize according to this data–model dichotomy.
2.1 Characterization of data sources and processing approaches
According to Wang, R. (2013), high-resolution image datasets can be rich in semantic information but depend on specific methods to retrieve three-dimensional geometry. On the other hand, point clouds obtained from LiDAR (Light Detection and Ranging) sensors directly represent geometry, but typically achieve lower resolutions and limited semantics. Thus, to perform 3D modeling from images, machine learning techniques may be used to estimate elevations monocularly, or techniques for measuring three-dimensional coordinates in stereoscopic pairs may be employed, using photogrammetric principles that generally allow a better understanding of the accuracy associated with the derived elevations.
Nevertheless, it is possible to integrate images and point clouds through registration processes that establish correspondences between coordinates projected onto the image plane and coordinates in the geometric space of the real world, as preserved in point clouds. This integration characterizes a multimodal data fusion approach, in which complementary information from different sensors is consistently combined. In general, such processes can be used both to virtually increase the spatial resolution of point clouds and to perform image-driven segmentation, simultaneously exploiting geometric and semantic features stored in the datasets.
In approaches that operate directly on point clouds, central steps include data classification and filtering in order to separate buildings from other objects present in the urban environment. As highlighted by Wang, R., Peethambaran, and Chen (2018), this type of approach depends on the quality and resolution of the input data. In general, the process involves the segmentation of coherent surfaces or their edges — for example, using planar or linear primitives — followed by the establishment of topological relationships among the identified objects.
In contrast, model-driven approaches focus on the selection and fitting of parameterizable geometric structures to represent buildings as topologically consistent objects. In the case of roof models, these structures may include pyramids, sets of one or more planes, and, to account for specific construction styles, geometries such as cones, cylinders, or spheroids. However, this strategy tends to be limited by the number of predefined shapes and the possible combinations among them.
Despite the dichotomy between the approaches presented in the literature, data and models are intrinsically related in the observed processes. The diagram in Figure 2 provides an overview of inputs and outputs and their relationships in the studied processes. It can be said that data are structured to formalize models. Therefore, some processes are difficult to categorize or should be treated as hybrid approaches. They may lead to balanced strategies between accuracy and the ability to model a wide variety of buildings, considering adaptations that help overcome the discussed limitations.
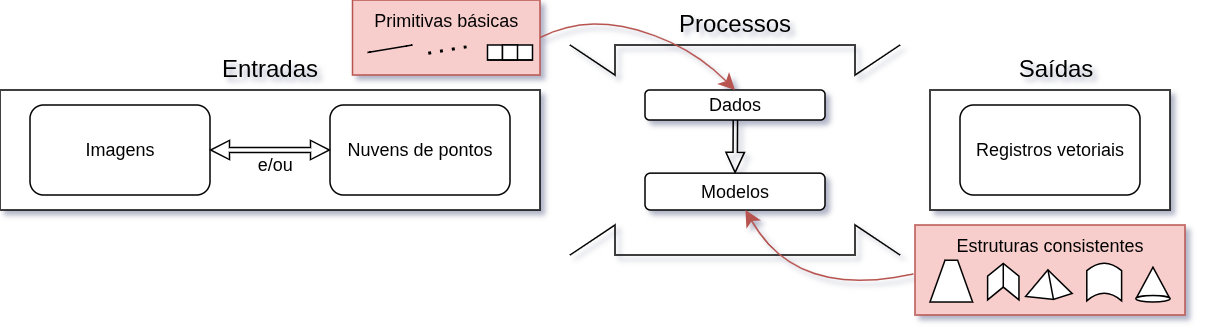
Figure 2: General overview of inputs and outputs of 3D building modeling processes using Earth Observation data and the objects addressed in different approaches.
Source: Authors (2025)
Assuming a data-driven approach, the segmentation of geometric primitives can be performed both on point clouds and on images. Hao, Zhang, and Cao (2016), for example, propose a technique for stereoscopic pairs of aerial images that uses a feature-matching method (points and lines) between multi-angle aerial images of the same scene. Using classical photogrammetric models and matching rules, lines are grouped and their heights are extracted by spatial intersection. Another proposal by Mohammadi, Samadzadegan, and Reinartz (2019) targets high-resolution satellite images and derives a disparity map using Hirschmüller’s (2011) semi-global matching. In this case, segmentation is performed using a graph-cut kernel in feature space, which includes radiometric bands, the disparity map, and a visible vegetation index.
Recently, the adoption of deep neural networks has stood out in segmentation approaches that precede the reconstruction of urban building roofs. This may involve, for example, isolating buildings in point clouds using clustering techniques and segmenting individual buildings with a RANSAC-based algorithm (RANdom SAmple Consensus) (Sun et al., 2024). In satellite imagery, a similar two-step approach has been proposed: first, buildings are segmented, and then predefined geometric structures are fitted onto digital surface models derived from the image set (Ismael; Sadeq, 2025).
2.2 Characteristics of Possible Products
In real-world buildings, many of the roofing materials used in roof compositions exhibit characteristic patterns, often corrugated, which facilitate rainwater runoff and result in elevation differences associated with the overlap of their components. There are also buildings whose roofs consist of waterproofed flat slabs, as well as roofs that add horizontal technical areas to support the installation of various equipment, such as antennas, water tanks, exhaust machinery, and cooling systems. In addition, the presence of other observable structures on roofs, such as vegetation, chimneys, parapets, or other vertical elements, is common, which may generate occlusions for remote sensors and hinder the accurate recording of roof geometry.
For these reasons, interpolating digital surface models (DSM) or structuring triangular irregular networks (TIN) directly from point clouds, without textures, may lead to models that are not very convincing to the human eye. Meshes capture roughness but cannot necessarily be maintained at high resolutions with sufficient accuracy to interpret finer details in large-scale mapping. Conversely, the interpolation of regular models smooths surfaces and may interfere with the localization of discontinuities (Guo et al., 2024).
Assuming the simplification of geometries into planes is a strategy to reduce computational resource consumption for data storage, transmission, and visualization. This also avoids overfitting the produced models, preserving only the most stable and relevant structures for volumetric description of buildings. Planar faces create an abstraction of the real surface, which is usually not planar, but can be approximated by one or more planar segments. Thus, there is a trade-off in finding a compact representation of surfaces within a tolerable error margin. Unlike TINs, only the vertices selected to form the boundary polygon of each fitted planar segment are stored. Similarly to DSMs, interpolation may occur to record vertex elevations without imposing any requirement for regularization in the sampling of stored planimetric coordinates. This also implies that only the extreme vertices of each line segment at the plane boundaries are needed. According to Verma, Kumar, and Hsu (2006), for planes to form consistent structures in final models, it is necessary to know whether spatial relationships between planes are respected, whether the semantics and number of mapped planes are correct, whether planes are well positioned, and whether their shape and orientation meet expectations.
The very characterization of which planes should be recorded depends on the expected level of detail for the model. The concept of levels of detail, following the nomenclature defined in the CityGML 2.0 standard (Gröger; Plümer, 2012), foresees an increasing scale of fidelity for 3D building models. From the lowest to the highest, they can be described as follows: LoD 0 is satisfied by the planimetric restitution of building outlines (also called footprints); LoD 1 requires the addition of altimetric information and allows the creation of block models; LoD 2 introduces geometric detailing of building roofs and semantically differentiated surfaces; and LoD 3 adds architectural information on façades, making terrestrial surveying desirable to complement aerial surveys. Beyond these levels, illustrated in Figure 3, the highest level (LoD 4) has been proposed, with interior detailing, which may require the adoption of more invasive techniques than those conventionally used for Earth Observation services. However, this level is considered feasible for the formal city, if municipal building cadastre documents are taken into account, and for modern developments where the national strategy for disseminating Building Information Modelling (BIM) is implemented (Brasil, 2024).
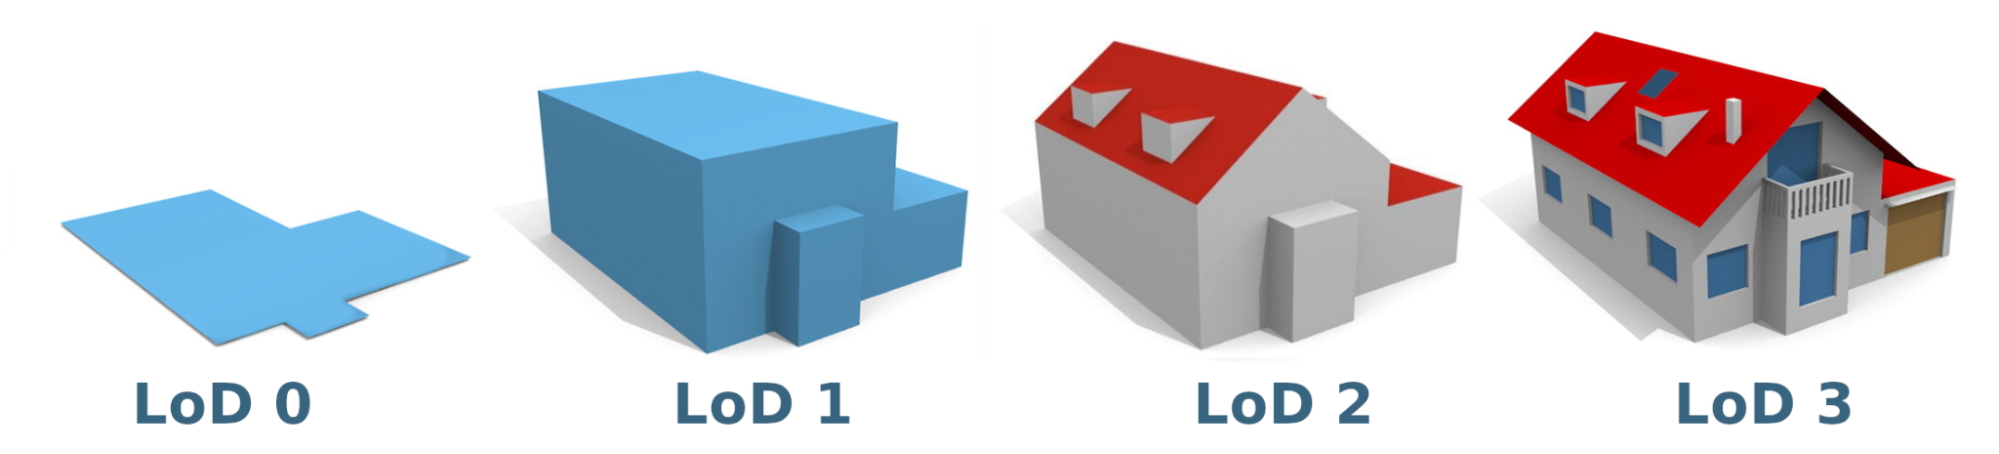
Figure 3: The first four levels of the CityGML 2.0 standard for building detail.
Source: Adapted from (Biljecki; Ledoux; Stoter, 2016)
Therefore, processing a 3D vector cadastre to model buildings represents a refinement of high-volume data with low structural complexity. It focuses on preserving, structuring, and highlighting the boundary vertices of sets of planes that allow the abstraction of building shapes. The development of a LoD 2 model, for example, may be accompanied by the extraction of roof features useful for applications such as solar incidence studies, including roof type, slope, and orientation. Likewise, intermediate-level detail cadastres can be updated by leveraging the latent potential of the pre-existing datasets that enabled them. For this purpose, it is necessary to segment instances of different roof facets or slopes when these are not flat roofs (already satisfied by the previous model), as well as to indicate the presence of superstructures, enhancing the usability of the models for studies on photovoltaic panel deployment (Krapf et al., 2022a).
- Municipal spatial datasets
The municipality of Rio de Janeiro periodically updates its cartographic base through aerial photogrammetric coverage. From 2019 onward, mosaics[3] of this nature have been published as true orthophotos, with parallax correction for the terrain and surface objects such as buildings and vegetation. The generation of these products usually relies on aerial photographs co-registered with data from LiDAR sensors onboard the same flight. Optionally, for isolated flights, post-processing can be performed to register images and point clouds. The resulting mosaics, stored in TIF format, present a spatial resolution (GSD – Ground Sample Distance) of approximately 15 cm/pixel and a radiometric resolution of 8 bits per band, and are intended for cadastral applications (Paiva; Badolato; Coelho, 2024). For the year 2019, this data volume reaches nearly 1 TB, of which 65% corresponds to point clouds stored in LAS format. The point cloud density was designed for 8 points/m² (Topocart Aerolevantamentos, 2019).
Access to municipal data is provided through the open data portal of the City of Rio de Janeiro, available at www.data.rio. Ordinance No. 53[4], of December 3, 2010, regulates the free provision of geospatial data to universities, linked to projects of public interest, with or without counterparts. According to the ordinance, the granting of use for products that are available on the official portals of the Municipal Institute of Urbanism Pereira Passos (IPP) is already authorized. For other products, such as the vector building database and the point clouds used in this study, a data-sharing agreement must be executed between the institutions.
The municipal building cadastre updated based on the dataset surveyed in 2019 comprises just over 1.5 million buildings. Non-geometric attributes (such as single-family or multifamily residential use, commercial or mixed use) fall outside the scope of this study and, to ensure compliance with the General Data Protection Law (LGPD) (Brasil, 2018), anonymized records cannot be linked to other tables. These records include geometries of multiple planar projections to describe different heights of the same observed building. Base and top elevations are assigned to these geometries, which are useful for block extrusion in a model compatible with LoD 1. There is also a field describing typology, in order to organize projections and distinguish functional buildings from constructions under development or ruins. Finally, a building identifier allows the dissolution of projections into a single footprint polygon. Figure 4 illustrates building density (represented by their footprints) on a grid with rectangular cells of up to 550 meters, corresponding to approximately 0.3 km².
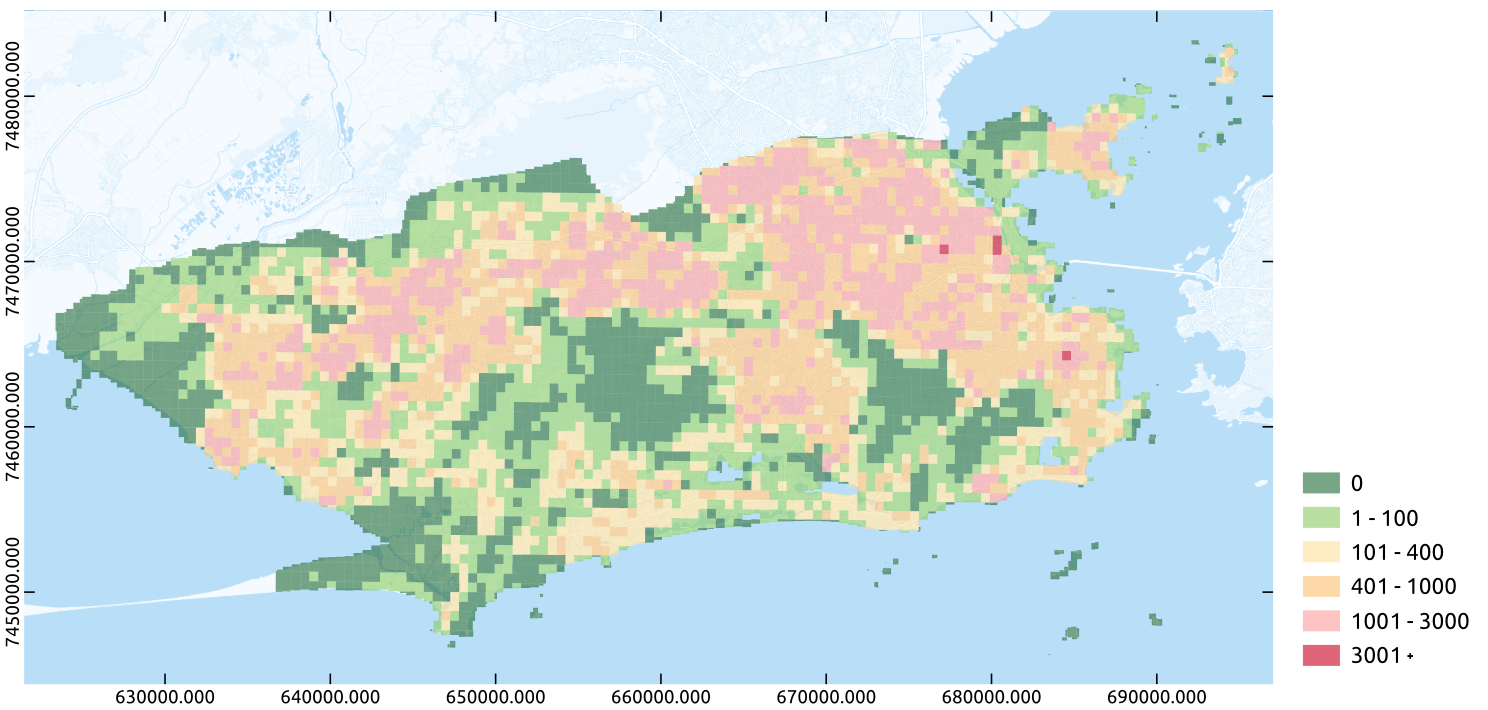
Figure 4: Density of buildings in the 2019 municipal cadastre.
Source: Authors (2025)
It should be noted that, due to informality, buildings in favelas pose constant challenges for maintaining the cadastre. High construction density, irregular occupied terrain, and spontaneous growth of built units, often vertically overlapping or interconnected, raise issues regarding how to individualize constructions. Furthermore, the absence of official documentation makes it complex for human operators unfamiliar with the community being mapped to assign any identifiers for individualization in administrative records. Thus, in cases where dissolving through building identifiers becomes unfeasible, a spatial separation heuristic is required to isolate any projections that do not share a common area greater than 1 m². Tolerating small overlapping areas is necessary to prevent minor feature restitution errors in the cadastre from producing footprints of large agglomerations of buildings.
- Methodology Employed
The updated three-dimensional models of the built environment of the Netherlands were developed within the scope of the 3D Geoinformation research group, which is part of the Urban Data Science Section at Delft University of Technology (TU Delft). These models combine data from the official cadastral database (BAG – Basisregistraties Adressen en Gebouwen) with nationally available point clouds (AHN – Actueel Hoogtebestand Nederland) to generate building vectors in LoD 1 and LoD 2. Within the ecosystem of applications developed for this purpose, the main program used for model construction is called roofer[5]. It was employed to integrate elevation data from different AHN versions (2, 3, and 4), resulting in distinct models. These models, integrated with pre-existing building records derived from the BAG, serve as the basis for cadastral updates at the national scale.
The automated roofer process is based on the detection of planar primitives over the point cloud using a region-growing algorithm, and on the derivation of linear primitives along external boundaries (boundary lines) and intersections (intersection lines) using the alpha-shape algorithm. Linear primitives are grouped by orientation and distance and regularized to form unique contour representations. These contours are used to partition the 2D footprint polygon, and the partitions are optimized using a graph-cut algorithm. The goal of this step is to minimize an energy function in order to achieve a balance between smoothness and deviation of the resulting planar faces relative to the point cloud reference. Finally, an extrusion is proposed (Figure 5) for the resulting planar faces, and the buildings are stored in CityJSON format, which is significantly more compact and based on the CityGML standard.
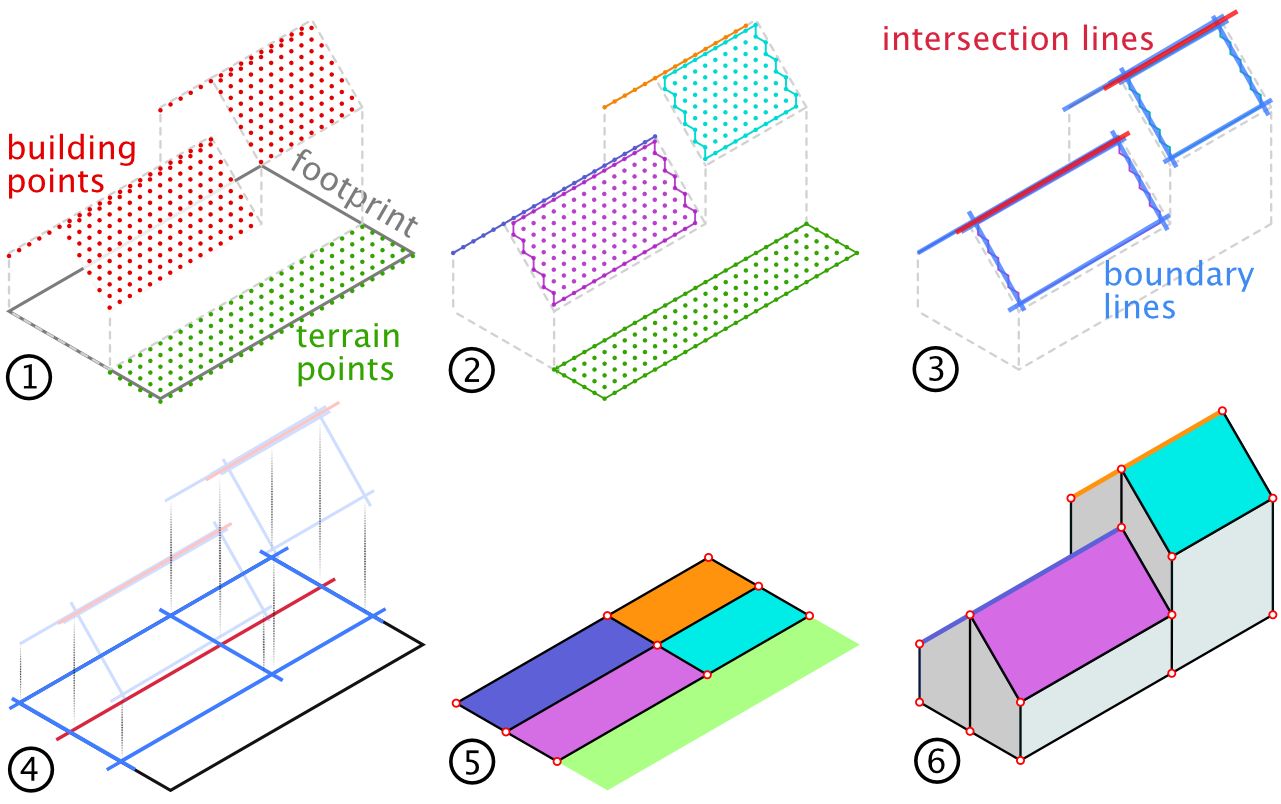
Figure 5: Main processing stages of the reconstruction implemented in roofer: 1) data input; 2) planar primitive detection; 3) linear primitive detection; 4) 2D projected partitioning; 5) optimized partitioning; and 6) vector output after extrusion.
Source: (Peters et al., 2022)
Initializing the automated process requires that the point clouds contain, at a minimum, a classification of observed points indicating built areas (building points) and ground (terrain points). In this case, the pre-existing classification of the municipal dataset provided in LAS file format was adopted (Graham, 2012). Points from both classes within a buffer zone surrounding each building footprint are considered to estimate the base elevation for extrusion. Planar faces with fewer than 16 points are discarded, which imposes a minimum area of approximately 2 m² for individually identifiable building segments when considering the spatial resolution of the data available for the city of Rio de Janeiro. This approach is strongly data-driven; therefore, the quality of the results depends directly on the quality of the input data.
The computational effort of this process grows almost linearly as the number of processed buildings increases. The developers recommend dividing datasets into blocks of spatially proximate buildings, subdividing blocks containing more than 3,500 footprint polygons.
For the city of Rio de Janeiro, block definition for processing took into account the centroid of each pre-processed footprint polygon (after dissolving projections from the cadastral database) and the map sheet indexing used in the municipality’s systematic mapping at a 1:1,000 scale. Seeking to process the entire available building dataset, excluding areas without constructions, approximately 3,400 blocks were identified, with an average of 468 buildings per block. The average processing time observed per block was under 30 seconds (≈ buildings per second). However, variations in building density, as shown in Figure 4, resulted in different processing windows. Thus, although the typical processing time per block did not exceed one minute, in 13% of the blocks, where building density was very high, processing extended beyond one minute.
The total processing time under this configuration was close to 30 hours on high-performance hardware with high main memory availability. The equipment dedicated to this study featured 128 GB of RAM and an Intel i9-12900 processor with 8 E-cores and 8 P-cores, capable of operating at frequencies ranging from 1.8 to 3.8 GHz and 2.4 to 5.1 GHz, respectively. This configuration supports up to 24 parallel threads. Each thread is responsible for reconstructing one building at a time.
The execution call for processing each block was automated through a custom routine developed for the municipal dataset. This routine was responsible for locating the pre-processed footprint files for different blocks and invoking roofer via the operating system command line, supplying as arguments the directory where the point clouds were stored and a destination path for result persistence. The same routine also recorded execution times per processed building block.
In its version 1.0 (beta 5), dated 27/08/2025, roofer executes in parallel on modern processors but does not include GPU acceleration capabilities. Once running, a main controller orchestrates the activities of each subprocess for reading and clipping point cloud data for individual buildings, which then proceed to the main processing stages described in Figure 5. The controller also aggregates subprocess outputs to ensure data persistence as a sequence of entries composing the final CityJSON file[6]. Occasional processing failures for individual buildings may lead to different outcomes, ranging from the absence of the LoD 2 object in the final result, when no identifiable planes are detected, to the interruption of processing for an entire block if basic assumptions regarding the provided data are not met.
In order to prevent the loss of processed blocks, a routine was developed to verify the individual quality of the provided footprint polygons. This routine preemptively extracts from the blocks any records that do not comply with a set of formation rules and feeds a backlog registry, identifying cadastral entities requiring manual review. In total, 1,250 buildings distributed throughout the municipality, 0.08% of the total, are included in this registry.
Visualization of the resulting models can be performed using different tools, such as QGIS with an appropriate plugin[7], or viewers optimized for web browser presentation[8]. The model outputs preserve identifiers that can be used to update pre-existing databases. However, the workflow for delivering updated research results still requires interfacing with stakeholders from the City of Rio de Janeiro. While LoD 2 data consumption is considered well established, further improvements are expected in the automated quality assessment of the generated models. Likewise, it is recommended that a formal update process be established to address municipal-specific requirements.
- Discussion of Results
In total, after summing the features submitted to the software in the pre-processed blocks and excluding backlog features, 1,593,006 footprint polygons were processed. The number of successfully reconstructed buildings totals 1,428,248 features (89.6% of the input dataset). The resulting features are multipart; that is, each feature in the final output may contain one or more parts corresponding to different planar faces of the roofs. Façades were disregarded in the LoD 2 results analysis.
Table 1: Distribution of buildings according to the number of roof facets
Number of roof facets | Total buildings | Percentage (%) |
Undefined | 164758 | 10.34 |
1 | 411829 | 25.85 |
2 | 364061 | 22.85 |
3-5 | 478453 | 30.03 |
6+ | 173905 | 10.92 |
Source: Authors (2025)
Table 1 summarizes the total and percentage results according to the number of roof facets (roof faces) observed in the processed buildings. Buildings classified as “Undefined” correspond to those that could not be reconstructed in LoD 2. For such cases, the pre-existing LoD 1 features from the municipal cadastral database can still be retained to support applications. Common reasons for undefined cases include footprints with individual faces of very small areas, occluded regions, or classification errors in the point cloud.
Table 2: Predominant roof form classification
Roof classification | Total buildings | Percentage (%) | RMS |
|
|
| Mean | Standard deviation |
Simple horizontal | 286317 | 17.97 | 0.207 | 0.351 |
Multilevel horizontal | 255887 | 16.06 | 0.276 | 0.401 |
Sloped | 885461 | 55.58 | 0.235 | 0.351 |
Unknown | 165341 | 10.38 | – | – |
Source: Authors (2025)
The resulting features are categorized according to the predominant slope class of the segmented roof surfaces, as shown in Table 2. This taxonomy distinguishes buildings with simple horizontal roofs, those with multiple horizontal levels, and those predominantly composed of sloped faces. The “Unknown” class groups buildings that could not be represented in LoD 2 or could not be adequately classified. LoD 2 features focus on roof detailing and, as typically occurs with the routines implemented in roofer, façades result from extrusion. From a top-down perspective, it is difficult to determine façade setbacks or internal voids caused by cantilevered structures. Therefore, the conventional approach is to close prisms by adding vertical planes from roof edges down to an average ground level, omitting information about the presence of eaves.
Roof shapes can also be described based on the adjacency relationships among their faces or facets. The simplest roof types, illustrated in Figure 6 both in perspective and plan view, include single-facet roofs (flat or shed), two-facet roofs (gable or decoupled), and roofs with three or more facets (half-hip, hip, pyramid, mansard, or complex).
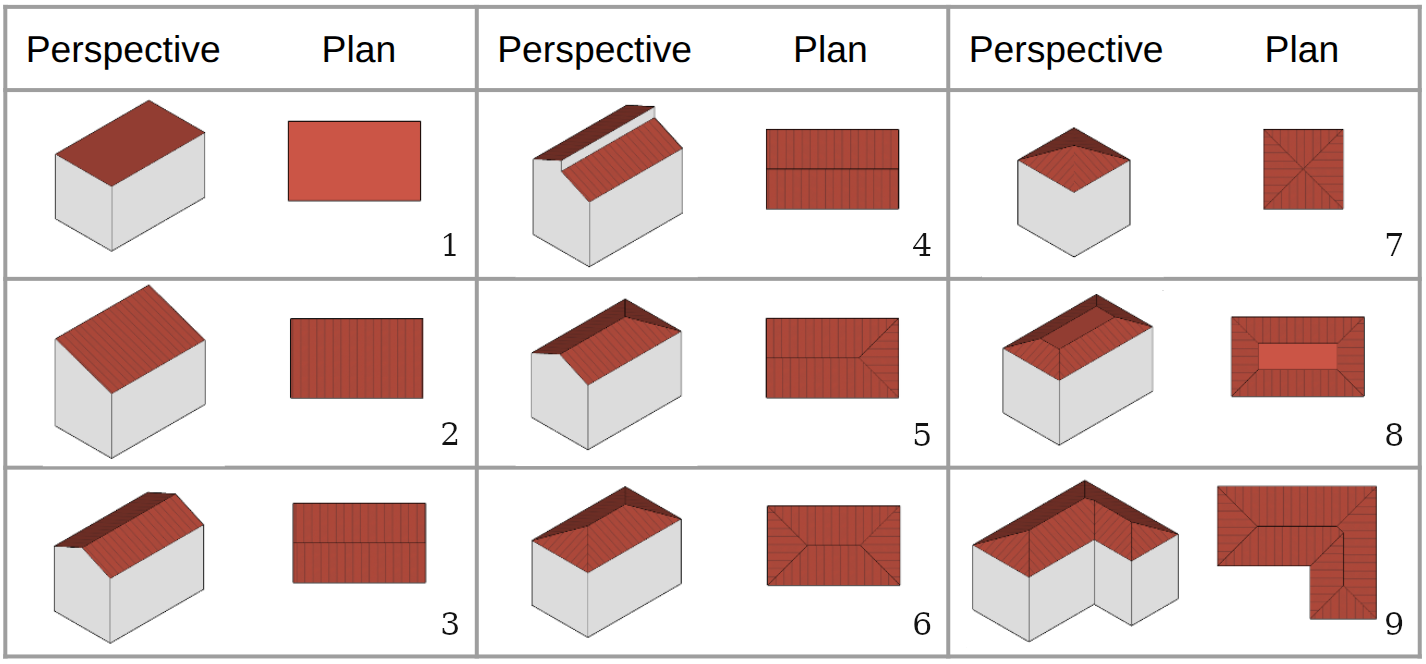
Figure 6: Roof types in perspective and plan projection: 1) flat; 2) shed; 3) gable; 4) decoupled; 5) half-hip; 6) hip; 7) pyramid; 8) mansard; and 9) complex.
Source: Adapted from (Mohajeri et al., 2018)
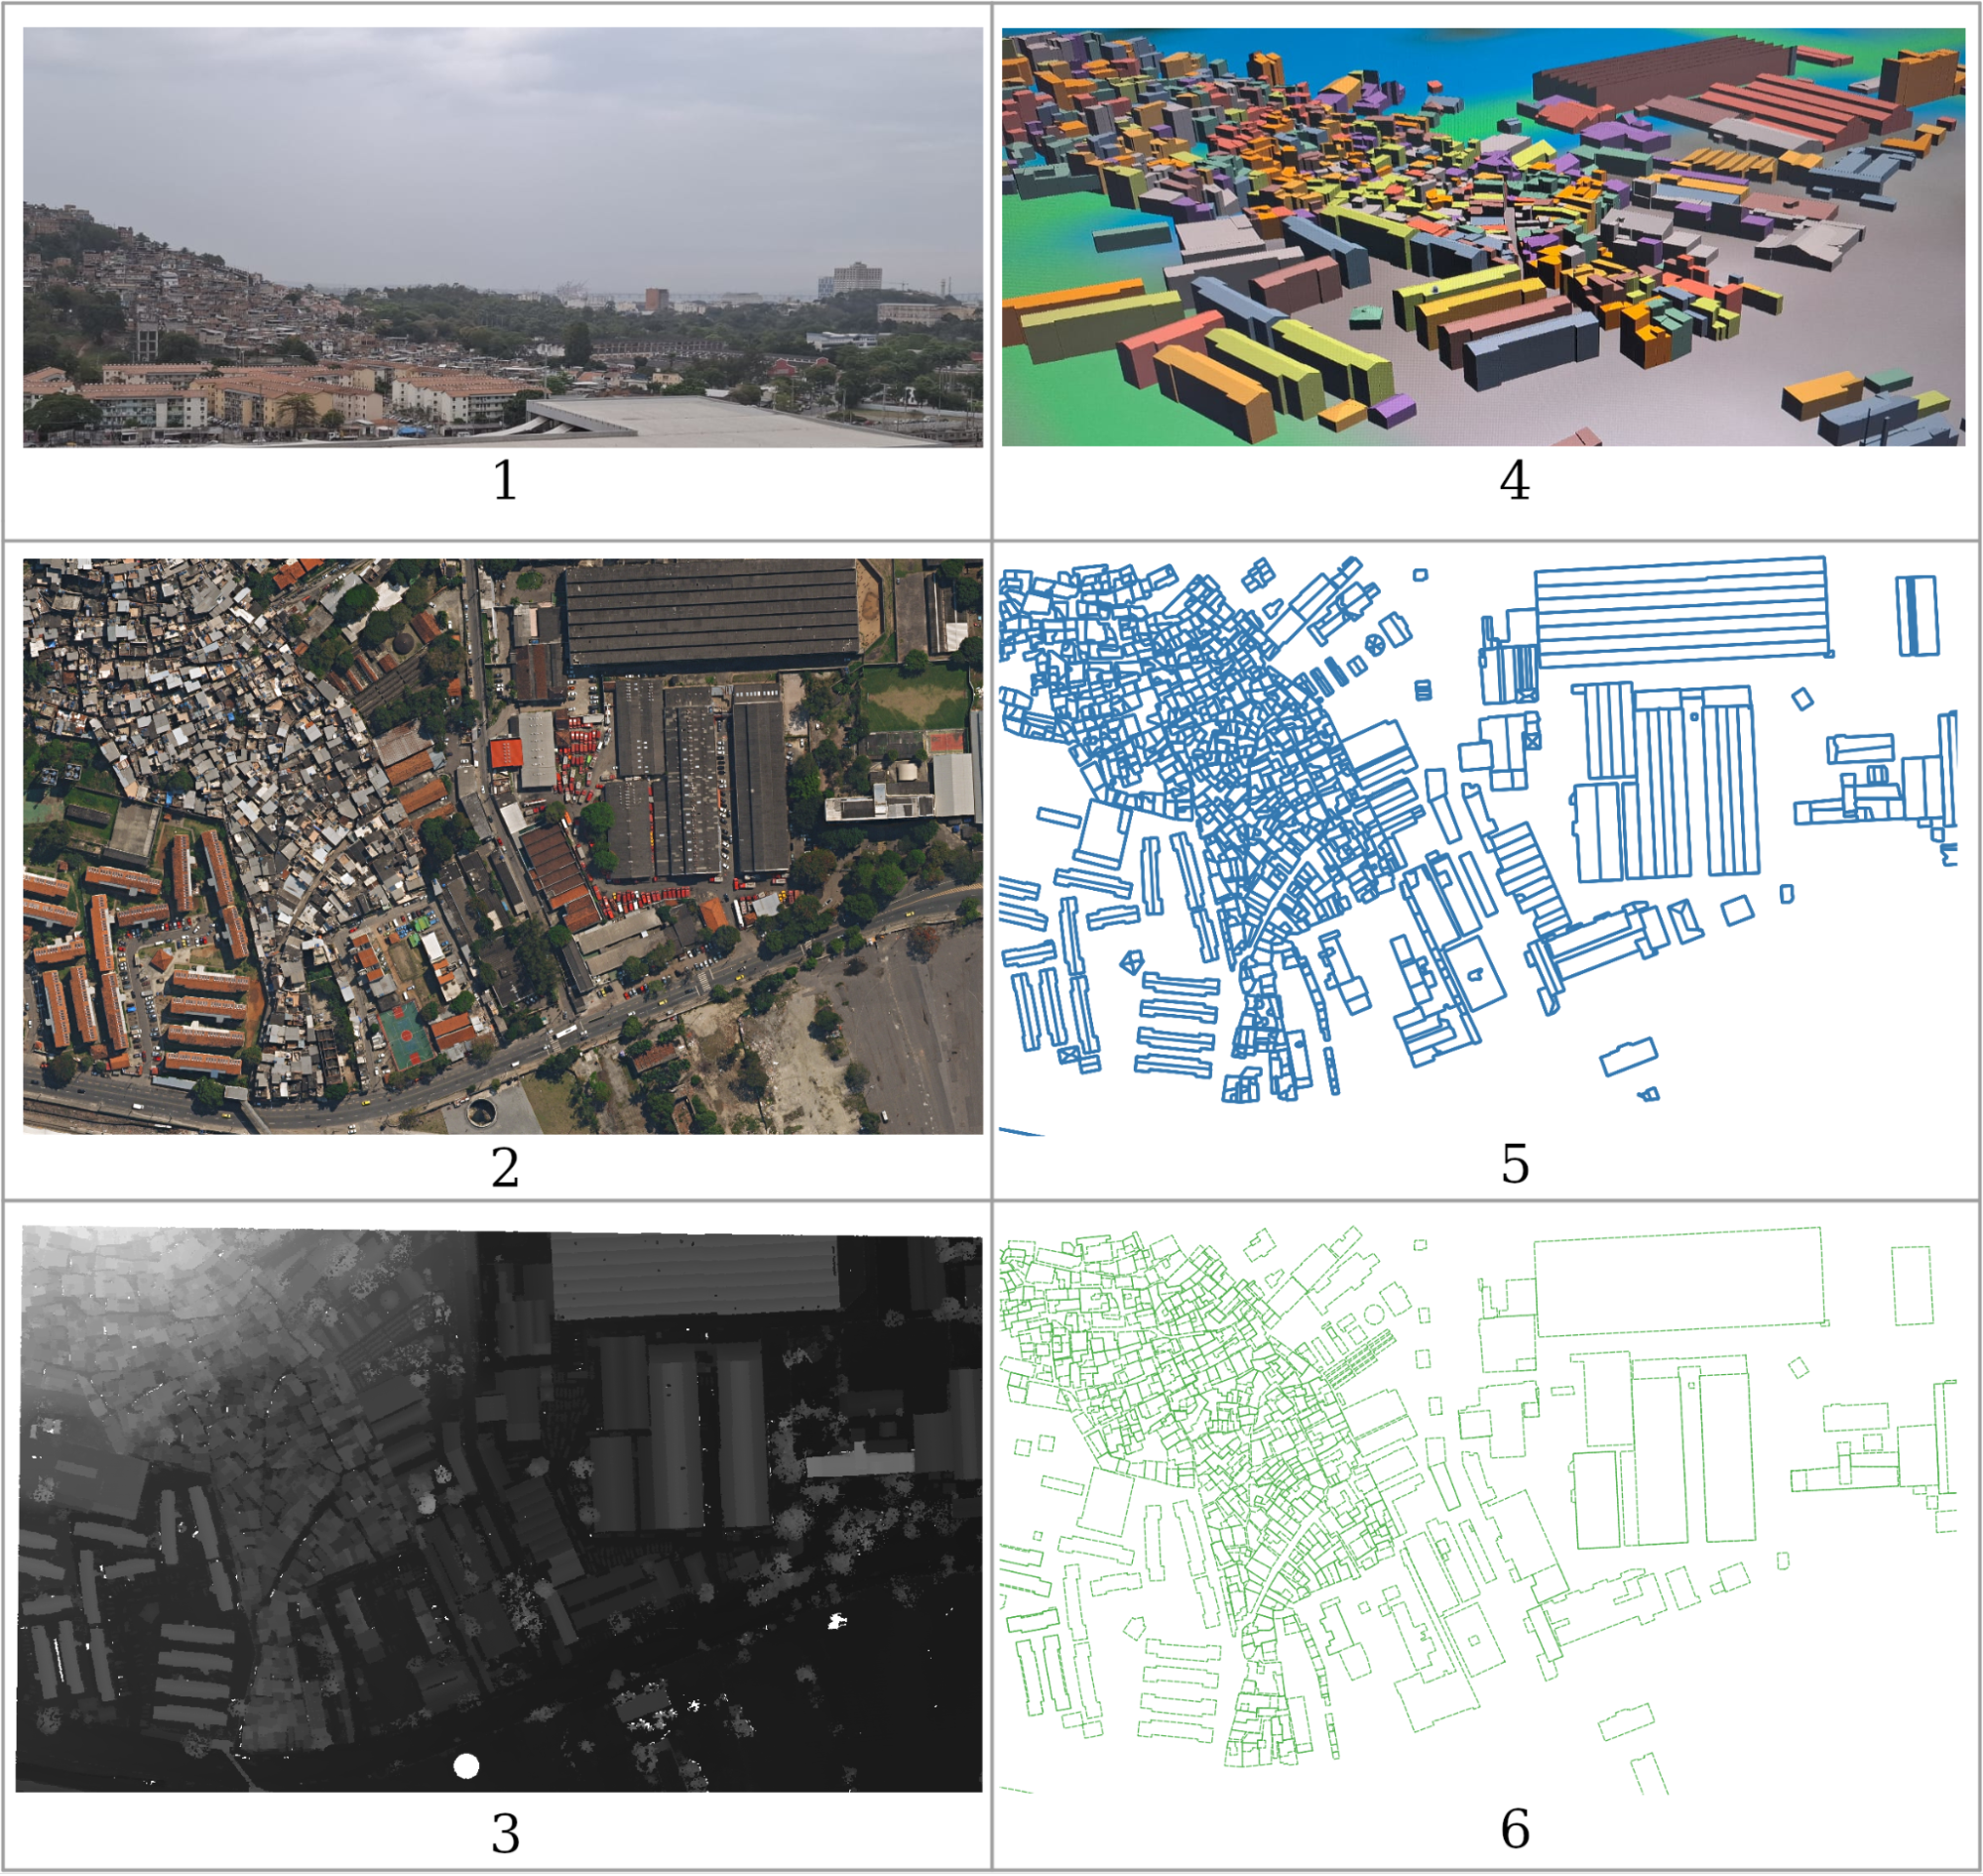
Figure 7: Model visualization for a block near the Mangueira neighborhood: 1) Regional photograph from 2025; 2) Orthorectified mosaic from 2019; 3) LiDAR point cloud; 4) 3D building model visualization in QGIS; 5) LoD 2 vectorization; and 6) Footprints used as input for building individualization.
Source: Authors (2025)
From the exploratory analysis, as illustrated in Figure 7, it is possible to observe that the model correctly identifies roof types, particularly for buildings with regular geometries. The adopted approach favors the handling of complex roofs, even when curved surfaces are approximated by multiple planar segments. However, the number of points required to define individual planes means that the total area of identifiable faces across the various roof levels is directly proportional to the quality of representation achievable in the resulting LoD 2 model. This is justified by the observation that small curved surfaces tend to be represented with low fidelity, whereas large free-form surfaces favor successful modeling.
For quality assessment, a human expert was asked to label 2D features on the 2019 mosaics. Information regarding the point clouds, their classification, and the processing results was omitted at this stage to avoid bias in the resulting ground truth. However, since the geometric correction of the mosaics is associated with the LiDAR point cloud used in the LoD 2 processing, the planimetric coordinates of features labeled on the mosaics are co-registered to the same reference system. Thus, using mosaics as vectorization bases, roof segment validation can be performed directly in 2D. Figure 8 shows the overlap between manually labeled region boundaries (pink dashed lines) and regions segmented by the automated process (blue) over the 2019 mosaic.
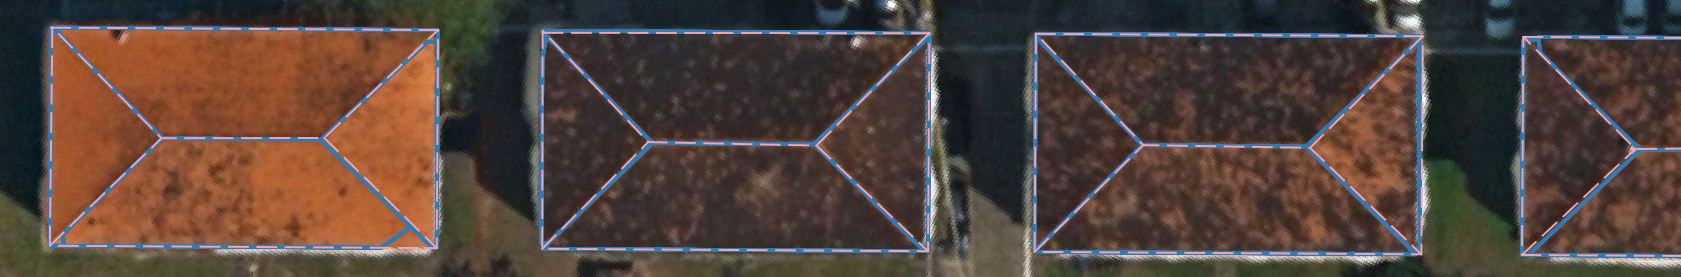
Figure 8: Verification of roof segment overlap within the same reference frame.
Source: Authors (2025)
In total, 225 buildings were surveyed: 116 with roofs of up to five facets and 109 with complex roofs, distributed across five distinct regions of the municipality. Planar faces were counted as “Hits” when cross-correlation was observed, that is, whenever a segment from the resulting set could be associated with a single segment from the reference set. The green areas in Figure 9 exemplify segments with cross-correlation. “Errors” were counted for incorrectly segmented faces in cases of under-segmentation or over-segmentation. The red areas in items 1 and 2 of Figure 9 illustrate such cases. “Omissions” correspond to the sum of faces without correspondence, occurring when portions of buildings were not represented in the automatically segmented regions or during manual labeling (illustrated by the yellow areas in Figure 9).
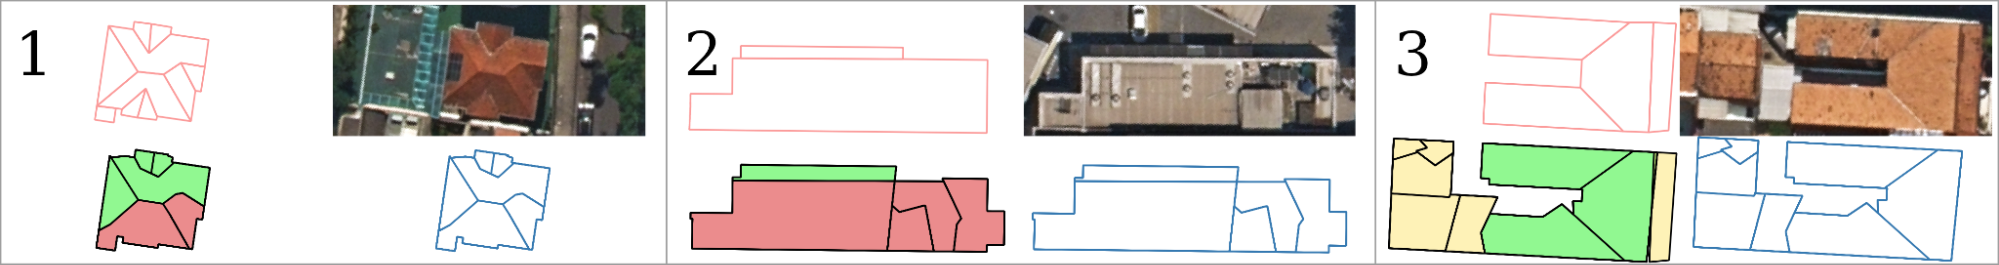
Figure 9: Examples of errors and omissions observed during segment correlation: 1) Errors due to under-segmentation; 2) Error due to over-segmentation; and 3) Omissions.
Source: Authors (2025)
Table 3 summarizes the qualitative evaluation of the process in individualizing roof segments. Deviations in the planar boundaries of projected segments were not quantified in this study; however, the resulting dataset includes residual metrics (root mean square error, RMS, presented in Table 2) between the modeled roof faces and the input point clouds.
Table 3: Verification of the quality of individualizing isolated roof segments
| Roofs with up to 5 segments | Complex roofs |
Successes | 266 | 847 |
Errors | 39 | 285 |
Omissions | 74 | 75 |
All facets | 379 | 1207 |
Source: Authors (2025)
Figure 10 presents a comparison between manual and automated roof segmentation. Mosaic excerpts and point cloud classification support the interpretation of observable differences between vector sets. Brown was used for ground, red for buildings, and green for tree vegetation. Points from the latter category are not used during processing but can assist in result interpretation. For buildings not manually labeled, the corresponding automatically generated features were omitted. Conversely, manually labeled features that could not be produced by the automated method are highlighted in the comparison.
The most frequent modeling errors arise from points in the point clouds that were incorrectly classified, either as tree canopy or as structures present on rooftops. Low point density or occlusions generate gaps and may cause deviations along reconstructed planar edges. This supports the understanding that efforts to create new multimodal processes could better leverage the available information for the city of Rio de Janeiro. Additionally, auxiliary inputs, such as estimated base elevation derived from pre-existing cadastral records, could be incorporated to prevent gross errors when the buffer area for collecting ground points is insufficient in densely built-up areas.
Thus, although the potential of pre-existing survey datasets has been demonstrated, gaps remain to be addressed in future studies. Further work may consider revising prior point cloud classification using semantic image information as a reference. Additional research directions include simultaneously updating the planimetric base, either during preprocessing or in parallel, so that more recent point clouds can be processed at lower cost. Finally, gaps observed in the results could be addressed by jointly modeling uncertainties, enabling the prioritization of features most relevant for human review.
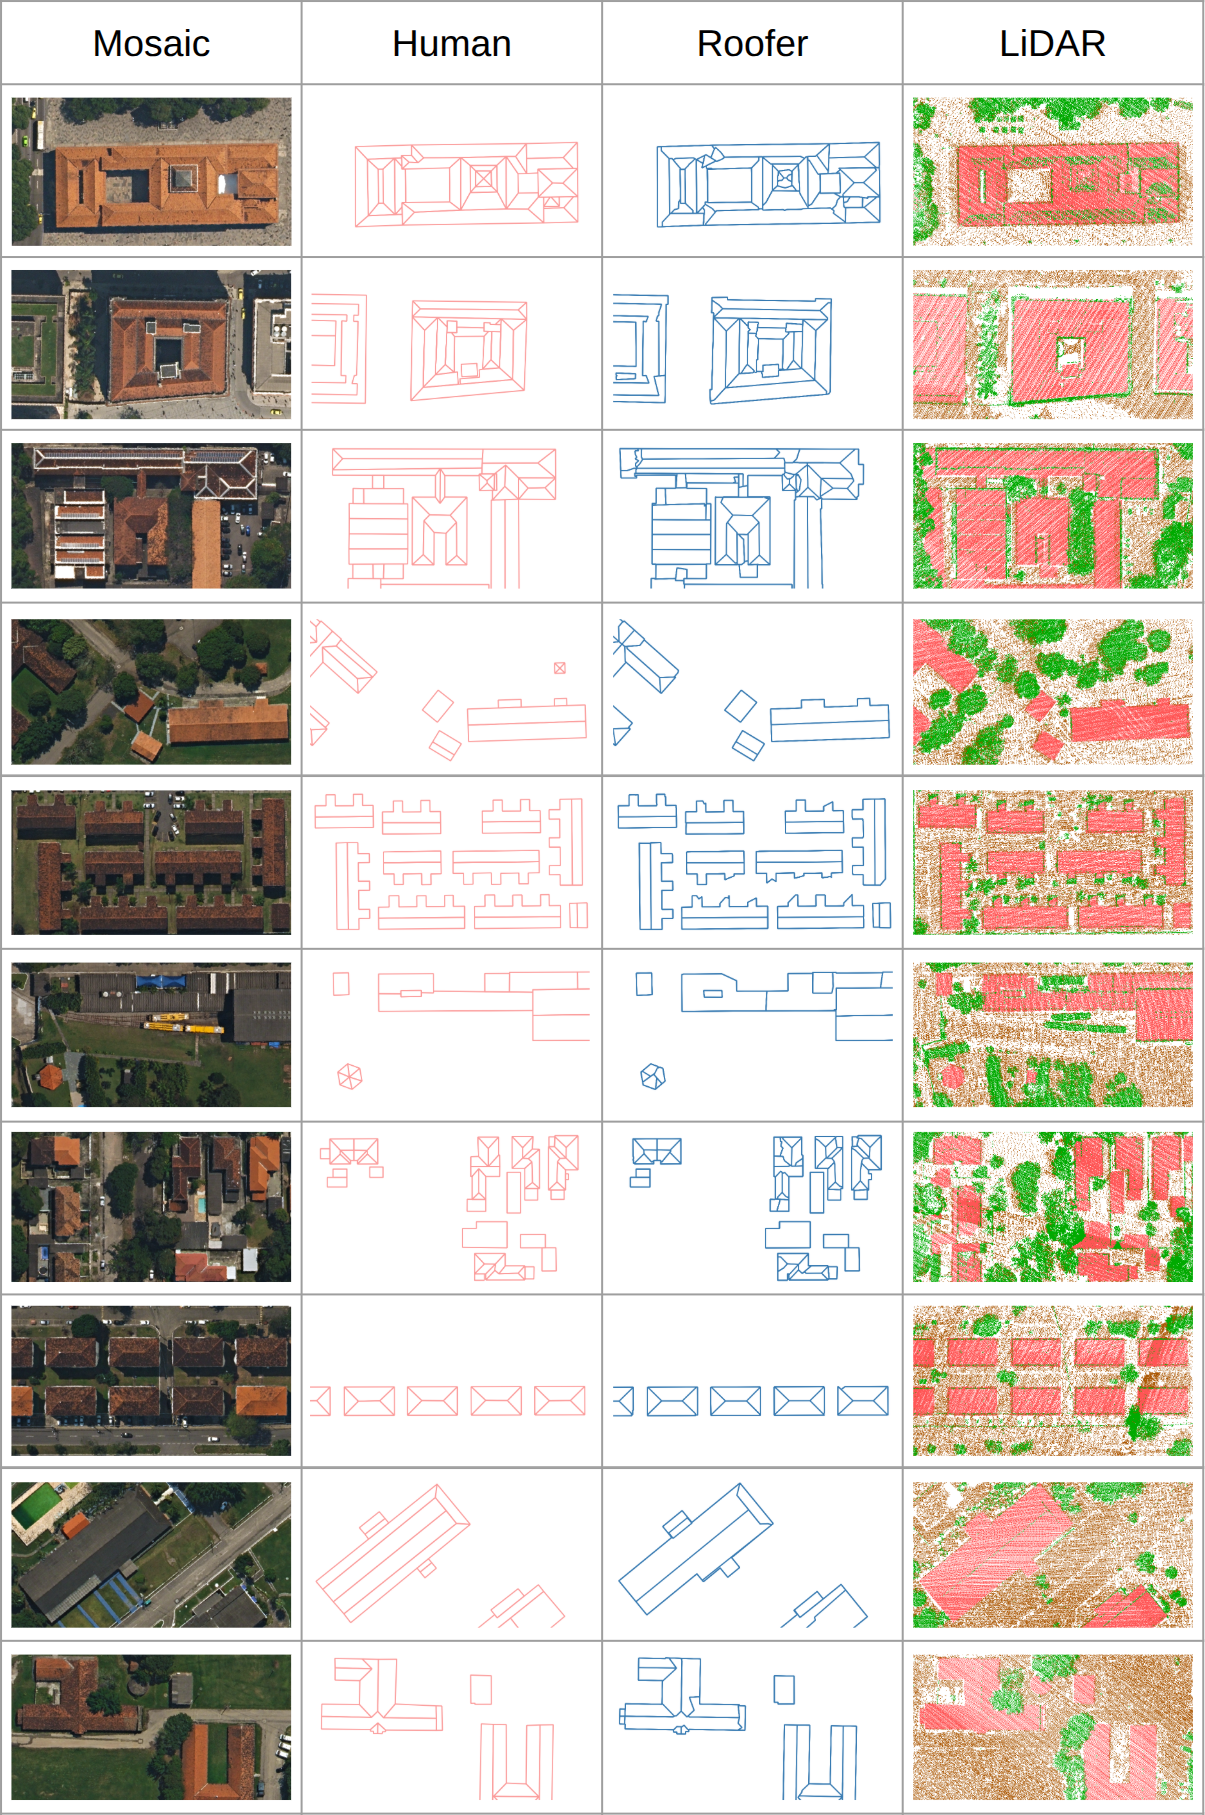
Figure 10: Comparison between manual and automated roof segmentation.
Source: Authors (2025)
- Final remarks
The proposed processing of the Rio de Janeiro municipal dataset using 2019 data to generate LoD 2 features proved to be feasible. Contributions of this work include large-scale data selection, compatibility adjustments to enable processing, and quality evaluation with identification of limiting factors, in addition to its novelty given that the applied algorithmic framework has been primarily tested in contexts distinct from those of cities in the Global South.
As conceived, the workflow does not address updates to built-up planar area or the detection of new buildings. However, nothing prevents its extension with a preliminary stage for such purposes. Similarly, the Rio de Janeiro municipal cadastre includes base and top elevation attributes linked to building footprints, which could be incorporated as inputs in densely built-up regions.
It is therefore concluded that the potential for leveraging pre-existing survey data has been demonstrated. Nonetheless, complementary investigations into point cloud classification methods are recommended, either to refine input data or to explore updates to the processing approach for multimodal inputs.
References
ANGRILL, Sara et al. Urban rainwater runoff quantity and quality – A potential endogenous resource in cities? Journal of Environmental Management, v. 189, p. 14–21, 2017. ISSN 0301-4797. DOI: 10.1016/j.jenvman.2016.12.027.
BILJECKI, Filip; LEDOUX, Hugo; STOTER, Jantien. An improved LOD specification for 3D building models. Computers, environment and urban systems, Elsevier, v. 59, p. 25–37, 2016. DOI: 10.1016/j.compenvurbsys.2016.04.005.
BILJECKI, Filip et al. Applications of 3D City Models: State of the Art Review. ISPRS International Journal of Geo-Information, v. 4, n. 4, p. 2842–2889, 2015. ISSN 2220-9964. DOI: 10.3390/ijgi4042842.
BRASIL. Decreto nº 11.888 de 22 de janeiro de 2024: Estratégia Nacional de Disseminação do Building Information Modelling no Brasil. Brasília, DF: Ministério do Desenvolvimento, Indústria, Comércio e Serviços, 2024.
BRASIL. Lei nº 13.709 de 14 de agosto de 2018: Lei Geral de Proteção de Dados Pessoais (LGPD). Brasília, DF: Presidência da República, 2018.
BUCCOLIERI, Riccardo; HANG, Jian. Recent Advances in Urban Ventilation Assessment and Flow Modelling. Atmosphere, v. 10, n. 3, 2019. ISSN 2073-4433. DOI: 10.3390/atmos10030144.
FALCÃO, Jonatas Goulart M. et al. Unregulated Vertical Urban Growth Alters Microclimate: Coupling Building-Scale Digital Surface Models with High-Resolution Microclimate Simulations. Smart Cities, v. 8, n. 6, 2025. ISSN 2624-6511. DOI: 10.3390/smartcities8060191.
GRAHAM, Lewis. The LAS 1.4 Specification. Photogrammetric Engineering & Remote Sensing, v. 78, n. 2, 2012. ISSN 0099-1112.
GRÖGER, Gerhard; PLÜMER, Lutz. CityGML – Interoperable semantic 3D city models. ISPRS Journal of Photogrammetry and Remote Sensing, v. 71, p. 12–33, 2012. ISSN 0924-2716. DOI: 10.1016/j.isprsjprs.2012.04.004.
GUO, Haoran et al. A method for hierarchical weighted fitting of regular grid DSM with discrete points. ISPRS Annals of the Photogrammetry, Remote Sensing and Spatial Information Sciences, Copernicus Publications Göttingen, Germany, v. 10, p. 91–98, 2024. DOI: 10.5194/isprs-annals-X-1-2024-91-2024.
HAO, Lechuan; ZHANG, Ye; CAO, Zhimin. Building extraction from stereo aerial images based on multi-layer line grouping with height constraint. 2016 IEEE International Geoscience and Remote Sensing Symposium (IGARSS). [S.l.: s.n.], 2016. P. 445–448. DOI: 10.1109/IGARSS.2016.7729110.
HIRSCHMÜLLER, Heiko. Semi-global matching-motivation, developments and applications. Photogrammetric Week 11, Wichmann, p. 173–184, 2011. Disponível em: <https://elib.dlr.de/73119/>.
ISMAEL, Rojgar Qarani; SADEQ, Haval. LoD2 Building Reconstruction from Stereo Satellite Imagery using Deep Learning and Model-Driven Approach. Zanco Journal of Pure and Applied Sciences, v. 37, n. 2, p. 103–118, 2025. Disponível em: <https://zancojournal.su.edu.krd/index.php/JPAS/article/view/3140>.
KRAPF, S. et al. RID—Roof Information Dataset for Computer Vision-Based Photovoltaic Potential Assessment. Remote Sensing, v. 14, n. 10, 2022a. ISSN 2072-4292. DOI: 10.3390/rs14102299.
KRAPF, S. et al. Deep Learning for Semantic 3D City Model Extension: Modeling Roof Superstructures Using Aerial Images for Solar Potential Analysis. ISPRS Annals of the Photogrammetry, Remote Sensing and Spatial Information Sciences, Copernicus GmbH, v. 10, 4/W2-2022, p. 161–168, out. 2022b. ISSN 2194-9042. DOI: 10.5194/isprs-annals-X-4-W2-2022-161-2022.
LUSSANGE, Johann et al. KIBS: 3D detection of planar roof sections from a single satellite image. ISPRS Journal of Photogrammetry and Remote Sensing, v. 220, p. 207–216, 2025. ISSN 0924-2716. DOI: 10.1016/j.isprsjprs.2024.11.014.
MOHAJERI, Nahid et al. A city-scale roof shape classification using machine learning for solar energy applications. Renewable Energy, v. 121, p. 81–93, 2018. ISSN 0960-1481. DOI: 10.1016/j.renene.2017.12.096.
MOHAMMADI, Hamid; SAMADZADEGAN, Farhad; REINARTZ, Peter. 2D/3D information fusion for building extraction from high-resolution satellite stereo images using kernel graph cuts. International Journal of Remote Sensing, Taylor & Francis, v. 40, n. 15, p. 5835–5860, 2019. DOI: 10.1080/01431161.2019.1584417.
PAIVA, Gabriel M.; BADOLATO, Irving S.; COELHO, Luiz Carlos T. Segmentação de Cobertura Arbórea em Área Urbana Sobre Ortoimagens RGB-NIR. [S.l.]: Zenodo, nov. 2024. DOI: 10.5281/zenodo.14003436.
PETERS, Ravi et al. Automated 3D reconstruction of LoD2 and LoD1 models for all 10 million buildings of the Netherlands. Photogrammetric Engineering & Remote Sensing, American Society for Photogrammetry e Remote Sensing, v. 88, n. 3, p. 165–170, 2022. DOI: 10.14358/PERS.21-00032R2.
ROBINSON, Darren; STONE, Andrew. Irradiation modelling made simple: the cumulative sky approach and its applications. In: PLEA conference. [S.l.: s.n.], 2004. P. 19–22.
SEILOV, Sh Zh et al. The concept of building a network of digital twins to increase the efficiency of complex telecommunication systems. Complexity, Wiley Online Library, v. 2021, n. 1, p. 9480235, 2021.
STOTER, Jantien et al. Automated reconstruction of 3D input data for noise simulation. Computers, Environment and Urban Systems, v. 80, p. 101424, 2020. ISSN 0198-9715. DOI: 10.1016/j.compenvurbsys.2019.101424.
SUN, Xiaokai et al. Semantic Segmentation and Roof Reconstruction of Urban Buildings Based on LiDAR Point Clouds. ISPRS International Journal of Geo-Information, v. 13, n. 1, 2024. ISSN 2220-9964. DOI: 10.3390/ijgi13010019.
TOPOCART AEROLEVANTAMENTOS. Relatório de execução de mapeamento aerofotogramétrico do município do Rio de Janeiro por mosaicos de ortoimagens digitais coloridas obtidas por plataforma aérea e ortorretificadas de acordo com elevações (“True Ortho”); modelo digital de elevações e modelo digital do terreno por perfilamento a LASER. Brasília, Brazil, 2019.
VERMA, V.; KUMAR, R.; HSU, S. 3D Building Detection and Modeling from Aerial LIDAR Data. In: 2006 IEEE Computer Society Conference on Computer Vision and Pattern Recognition (CVPR’06). [S.l.: s.n.], 2006. v. 2, p. 2213–2220. DOI: 10.1109/CVPR.2006.12.
WANG, Chen et al. Flood risk management in sponge cities: The role of integrated simulation and 3D visualization. International Journal of Disaster Risk Reduction, v. 39, p. 101139, 2019. ISSN 2212-4209. DOI: 10.1016/j.ijdrr.2019.101139.
WANG, Ruisheng. 3D building modeling using images and LiDAR: a review. International Journal of Image and Data Fusion, Taylor & Francis, v. 4, n. 4, p. 273–292, 2013. DOI: 10.1080/19479832.2013.811124.
WANG, Ruisheng; PEETHAMBARAN, Jiju; CHEN, Dong. LiDAR Point Clouds to 3-D Urban Models: A Review. IEEE Journal of Selected Topics in Applied Earth Observations and Remote Sensing, v. 11, n. 2, p. 606–627, 2018. DOI: 10.1109/JSTARS.2017.2781132.
WYSOCKI, Olaf et al. Reviewing Open Data Semantic 3D City Models to Develop Novel 3D Reconstruction Methods. The International Archives of the Photogrammetry, Remote Sensing and Spatial Information Sciences, v. 48, p. 493–500, 2024. DOI: 10.5194/isprs-archives-XLVIII-4-2024-493-2024.
About the Authors
Irving da Silva Badolato is an Assistant Professor at the School of Engineering of the Rio de Janeiro State University (FEN/UERJ), appointed to the Department of Cartographic Engineering (CARTO) since 2016, a member of the Laboratory of Photogrammetry and Remote Sensing (LFSR), and a developer of open-source software for education in digital photogrammetry. He received his Bachelor’s degree in Electrical Engineering with an emphasis on Systems and Computing from the same institution in 2010 and earned a Master’s degree in Computer Science and Systems Engineering from COPPE/UFRJ in 2014. He is currently pursuing a PhD in the Graduate Program in Computational Sciences and Mathematical Modeling at the Institute of Mathematics and Statistics of the Rio de Janeiro State University (IME/UERJ).
Guilherme Lucio Abelha Mota graduated in Systems and Computer Engineering from UERJ in 1997 and obtained his Master’s degree in 2000 and his PhD in 2004 in Electrical Engineering from PUC-Rio. During his doctoral studies, he completed a research internship under a Sandwich Fellowship at Leibniz University Hannover, Germany. He has worked in the field of computer graphics since 1996, mainly in image processing, analysis, and classification, as well as computer vision. He is a faculty member at UERJ in the Department of Informatics and Computer Science and in the Graduate Program in Computational Sciences and Mathematical Modeling, where he leads research involving deep learning for computer vision. He is a member of IEEE GRSS, ISPRS, SELPER, and ACEBRA.
Gilson Alexandre Ostwald Pedro da Costa holds a PhD in Electrical Engineering from PUC-Rio (2009), with part of his doctoral studies conducted at Leibniz University Hannover, Germany. He earned his Bachelor’s degree in Computer Engineering (PUC-Rio, 1991) and a Master’s degree in Computer Engineering with an emphasis on Geomatics (UERJ, 2003), and completed postdoctoral research at PUC-Rio (2010–2015) and at the Institute of Photogrammetry and Geoinformation (IPI) of Leibniz University Hannover (2019–2020). He is an Associate Professor at UERJ in the Department of Informatics and Computer Science and serves as Coordinator of the Graduate Program in Computational Sciences and Mathematical Modeling at IME/UERJ. He has more than 100 publications and works in Image Analysis and Computer Vision applied to Remote Sensing, with a focus on deforestation detection. He is a member of ISPRS, IEEE GRSS Brazil, and SELPER.
Author Contributions
Conceptualization, [I.S.B., G.L.A.M., G.A.O.P.C.]; methodology, [I.S.B., G.L.A.M., G.A.O.P.C.]; software, [I.S.B.]; data curation, [I.S.B.]; writing—original draft preparation, [I.S.B.]; writing—review and editing, [G.L.A.M.; G.A.O.P.C.]; supervision, [G.L.A.M.; G.A.O.P.C.]; funding acquisition, [G.L.A.M.; G.A.O.P.C.]. All authors have read and agreed to the published version of the manuscript.
Funding
This research was funded by the Carlos Chagas Filho Foundation for Research Support of the State of Rio de Janeiro (FAPERJ), which provided resources for laboratory infrastructure upgrades and the acquisition of computing equipment.
Data Availability
The data used in this research are available through the open data portal of the City of Rio de Janeiro, via the official portals of the Municipal Institute of Urbanism Pereira Passos, and through institutional data-sharing agreements in compliance with IPP Ordinance No. 53 of December 3, 2010.
Acknowledgements
The authors acknowledge the contributions of Architect and Urban Planner Michelle Costa da Silva for consultancy on roof terminology and data labeling; the Pereira Passos Institute and the City Information Coordination Office for providing the data and clarifications regarding the current cadastral model; and the 3D Geoinformation research group at Delft University of Technology for the development and sharing of the software adopted in the processes described in this study.
Conflicts of Interest
The authors declare no conflicts of interest.
About Coleção Estudos Cariocas
Coleção Estudos Cariocas (ISSN 1984-7203) is a publication dedicated to studies and research on the Municipality of Rio de Janeiro, affiliated with the Pereira Passos Institute (IPP) of the Rio de Janeiro City Hall.
Its objective is to disseminate technical and scientific production on topics related to the city of Rio de Janeiro, as well as its metropolitan connections and its role in regional, national, and international contexts. The collection is open to all researchers (whether municipal employees or not) and covers a wide range of fields — provided they partially or fully address the spatial scope of the city of Rio de Janeiro.
Articles must also align with the Institute’s objectives, which are:
- to promote and coordinate public intervention in the city’s urban space;
- to provide and integrate the activities of the city’s geographic, cartographic, monographic, and statistical information systems;
- to support the establishment of basic guidelines for the city’s socioeconomic development.
Special emphasis will be given to the articulation of the articles with the city's economic development proposal. Thus, it is expected that the multidisciplinary articles submitted to the journal will address the urban development needs of Rio de Janeiro.
[1] Reviver Centro’s web portal is available at https://reviver-centro-pcrj.hub.arcgis.com.
[2] Information about the 3DBAG models is available at https://3d.bk.tudelft.nl/projects/3dbag
[3] Available at https://siurb.rio/portal/home/search.html?searchTerm=trueortofotos\#content
[4] Available at https://www.data.rio/documents/c34400f6e0d641ac811019220a6fffa2
[5] Free software, which may be downloaded from https://github.com/3DBAG/roofer.
[6] The final composition requires command line apps available at https://github.com/cityjson/cjseq and https://github.com/cityjson/cjio
[7] Available at https://plugins.qgis.org/plugins/CityJSON-loader
[8] For example, the viewer available at https://ninja.cityjson.org