
Volume 14 Issue 1 *Corresponding author wmanoel.pereira@gmail.com Submitted 28 Jan 2026 Accepted 29 Apr 2026 Published 30 May 2026 Citation PEREIRA NETO, W.; ANDRADE, V. The role of the built environment in modal integration: an analysis of BRT terminal surroundings through walkability and bikeability. Coleção Estudos Cariocas, v. 14, n. 1, 2026.
DOI: 10.71256/19847203.14.1.213.2026 The article was originally submitted in PORTUGUESE. Translations into other languages were reviewed and validated by the authors and the editorial team. Nevertheless, for the most accurate representation of the subject matter, readers are encouraged to consult the article in its original language.


| The role of the built environment in modal integration: an analysis of BRT terminal surroundings through walkability and bikeability O papel do ambiente construído na integração modal: análise dos entornos de terminais de BRT através da caminhabilidade e da ciclabilidade El papel del entorno construido en la integración modal: análisis del entorno de los terminales de BRT a través de la caminabilidad y la ciclabilidad Walter Manoel Pereira Neto¹, Victor Andrade Carneiro da Silva² 1 Universidade Federal do Rio de Janeiro, Av. Pedro Calmon, 550, Cidade Universitária, Rio de Janeiro/RJ, CEP:21941-630, ORCID 0000-0002-9288-9200, wmanoel.pereira@gmail.com 2 Universidade Federal do Rio de Janeiro, Av. Pedro Calmon, 550, Cidade Universitária, Rio de Janeiro/RJ, CEP:21941-630, ORCID 0000-0001-5466-6455, victorandrade@fau.ufrj.br
AbstractThis paper analyzes transport modal integration within the Transcarioca BRT system, specifically focusing on pedestrian and cyclist accessibility around the Alvorada and Paulo da Portela terminals. Utilizing a unified walkability and bikeability index, the study reveals that the built environment in both locations presents unsatisfactory conditions. While the traditional commercial land use in Madureira (Paulo da Portela) inherently favors pedestrians, Barra da Tijuca (Alvorada) offers superior cycling infrastructure. The findings underscore significant socioeconomic inequalities and the persistent neglect of active transport modes in urban mobility policies. Keywords: modal integration, BRT, walkability, bikeability, biult envionment.
ResumoEste artigo propõe uma análise da integração entre modos de transporte no BRT Transcarioca, focando na acessibilidade de pedestres e ciclistas no entorno dos terminais Alvorada e Paulo da Portela. Através de um índice unificado de caminhabilidade e ciclabilidade, a pesquisa identifica que o ambiente construído de ambos os locais possui condições insatisfatórias. Enquanto Madureira (Paulo da Portela) favorece o pedestre por sua ocupação comercial tradicional, a Barra da Tijuca (Alvorada) oferece melhor infraestrutura cicloviária. Os resultados evidenciam desigualdades socioeconômicas e a negligência das políticas de mobilidade urbana em relação aos modos ativos de transporte. Palavras-chave: integração modal, BRT, caminhabilidade, ciclabilidade
ResumenEste artículo analiza la integración entre modos de transporte en el BRT Transcarioca, centrándose en la accesibilidad de peatones y ciclistas en el entorno de los terminales Alvorada y Paulo da Portela. A través de un índice unificado de caminabilidad y ciclabilidad, la investigación identifica que el entorno construido de ambos lugares presenta condiciones insatisfactorias. Mientras que la ocupación comercial tradicional de Madureira (Paulo da Portela) favorece al peatón, Barra da Tijuca (Alvorada) ofrece una mejor infraestructura ciclista. Los resultados ponen de manifiesto las desigualdades socioeconómicas y la negligencia de las políticas de movilidad urbana en relación con los modos de transporte activos. Palabras clave: integración modal, BRT, caminabilidad, ciclabilidad. |
1 Introduction
Moving around the city is a human action practiced for centuries, whether to travel to some place to fulfill an objective or simply to wander along the paths (Careri, 2002). However, as a result of the popularization of the automobile in the 20th century, active mobility, understood as mobility on foot and by bicycle, was eclipsed.
Since the ownership of private automobiles is not a reality for all inhabitants, the use of the public transportation system becomes essential for the travel of economically disadvantaged people. Rio de Janeiro has a diverse public transport network, consisting of train lines, metro, buses, ferries, cable cars, and more recently BRT and VLT. However, road transportation represents the largest share of trips among public transport in the city. For the West and Southwest Zones, lacking high-capacity transport, the BRT became the solution to improve the mobility of their residents. This mode of transport has become fundamental for the public transportation system of Rio de Janeiro and can be seen represented on the maps promoting the city's transport network.
However, both the BRT and the other modes of public transport do not serve the entire route of all their users, so a portion of their journeys to the final destination is made on foot or by bicycle. This can represent a third of trips in cities such as Rio de Janeiro (ANTP, 2020), a very significant number in a city of more than 6 million inhabitants (IBGE, 2022). This reinforces the fact that every citizen at some point in their trip covers a path on foot, or rather, "every trip begins and ends on foot, therefore everyone is a pedestrian on an urban street at some point" (GDCI/NACTO, 2018). In low-income groups, in addition to walking, the use of the bicycle becomes the main, if not the only, means of transport for longer distances, but the role of pedestrians and cyclists in the transport network has often been neglected in urban mobility policies, as it is not understood as part of it (Vasconcellos, 2018).
As a part of the journey, from the drop-off point to the desired destination, is or can be made on foot or by bicycle, it is fundamental for a transportation system to have a relationship of integration with the space of the pedestrian and the cyclist (Lefevre, 2009), that is, that the surroundings of its stations be comfortable and attractive to walk in and connected to cycling infrastructures. Understanding that active modes are important for feeding mass transit, there was an expectation that this integration would happen in one of the most recent modes of transport in Rio de Janeiro, the BRT Rio corridors, fostered by the legacy campaign of the sports events (Kassens-Noor et al., 2016).
A high-capacity transport system, that is, one that transports over 12 thousand passengers per hour per direction (Ministério das Cidades, 2008), integrated with public space and any mode of transport would encourage the user's active travel to access it (Lefevre, 2009). However, in the relationship between active modes and high-capacity transport in Rio de Janeiro, situations of facilitated access for pedestrians and cyclists to these modes of transport are occasional and still not very efficient and adequate. For example, the presence of cycling infrastructure, such as bike racks outside or inside stations and bike lanes in their surroundings, is still limited, just as the promotion of pedestrian access is precarious, considering that the sidewalk has poorly maintained paving, as well as poor physical conditions of accessibility and signage.
Based on the understanding of the importance of walking and cycling trips, considering their low visibility or even invisibility within the context of the transport network, and adding to the concepts of accessibility and equity in transport (Pereira, 2019), it becomes important to understand the access conditions of pedestrians and cyclists to the BRT. It is understood that access goes beyond the entrance door, also considering the route taken by pedestrians and cyclists to a transport station. Therefore, this study aimed to analyze how and which elements of the built environment in the surroundings of the stations promote or fail to promote the attractiveness of active modes to the BRT, from the perspective of the concepts and criteria of walkability and bikeability. Furthermore, it had the following specific objectives: to develop an evaluation index consolidating the main tools of this type on walkability and bikeability; to identify and map the attributes of the built environment in the surroundings of two distinct BRT surroundings; and to analyze the impact of these elements on promoting modal integration between the BRT and active modes.
This analysis is then based on the application of an index developed for this research, with the aim of investigating the built environment through walkability and bikeability, understood as elements that interfere with the choice of walking and cycling (Bradshaw, 1993; Gehl, 2010). It did not start, therefore, from a direct interaction with pedestrians and cyclists who use the BRT as part of their trips. Thus, the focus was on the physical elements of the built environment defined here as essential for a survey that configure the surroundings of the two selected terminals and, from that, understand the access conditions of pedestrians and cyclists to the BRT.
2 Theoretical discussion
The National Urban Mobility Policy (PNMU) is very pragmatic in defining urban mobility as the “condition in which the displacements of people and cargo in urban space take place” (Brasil, 2012). The use of the word “condition” in this context can be understood as a box that encompasses conceptions of displacement, structure, accessibility, options, physical and social limitations, which relate to the three types of factors that interfere in people's travel decisions as defined by Vasconcellos (2018): “personal factors, such as physical and financial conditions; family factors, such as local culture and the personal life cycle; and external factors, such as the supply of means of transport.” This definition of factors serves as an indicator of the predominant public in urban travel, through collective and non-motorized transport.
The interference factors indicate which modes of transport will be chosen by people to travel, which are known, among various classifications, as individual motorized, collective, and active transport. The individual motorized mode is nothing more than the use of private motor vehicles such as cars, trucks, and motorcycles. Collective or public transport “are those that by nature allow simultaneous use by several people – and no one can claim its exclusive use: they are collective transport vehicles, such as vans, buses, and metro” (Vasconcellos, 2018). Active modes, on the other hand, are those whose displacements require only human effort, in general terms pedestrians and cyclists.
Active, or non-motorized, transport is the most sustainable way of moving around, as it is non-polluting, reduces automobile traffic in cities as it becomes a travel option, improves quality of life, and is more effective for short-distance trips (Ferreira, 2007). However, investments in urban mobility pay more attention to vehicle flow, whether private automobiles or collective transport, and to the efficiency of rail transport. According to Vasconcellos:
[...] the association of second-class mobility status with pedestrians makes it difficult for short-term changes to have a structural impact on Brazilian cities. Part of the problem is linked to the fact that the majority of those who walk frequently belong to the lowest income strata, who have little influence on mobility policies (Vasconcellos, 2017).
This view of the pedestrian makes it difficult to see that investing in adequate, adapted, and comfortable sidewalks is a transport policy and, even more difficult, that this brings benefits to the city. On the other hand, to reduce automobile use, transport policies need to exercise a new paradigm over circulation spaces, where cycling and walking would be at the top of priorities, while the automobile at the opposite extreme. Thus, the street must be analyzed as a social place, space of public transport and “green modes”: bicycle and walking (Banister, 2008).
The circulation space of pedestrians and cyclists must be as fluid as possible, without obstacles, and suitable for all types of people, to complete the trip to the desired destination. This is possible through good accessibility, which taken from a broader perspective,
Can be defined as the ease with which people can reach places and opportunities – or, conversely, a characteristic of places and opportunities in terms of how easily they can be accessed by the population (Pereira, 2019).
To some extent, accessibility can also be understood as the ease with which people move autonomously to desired destinations, as well as the condition of access to basic services and social facilities (Rodrigues, 2017).
Thus, for evaluation purposes, accessibility is here assessed in the physical conditions that comprise the first or last mile of trips made by pedestrians and cyclists, that is, the stretch of the journey carried out by these modes between the point of access to collective transport and the starting or ending point of the trip. But, beyond accessibility, two concepts are important to measure the degree of adequacy and comfort of the pedestrian and cyclist space: walkability and bikeability.
The circulation routes of pedestrians and cyclists need to be attractive, stimulating for walking and cycling. This can happen through the aesthetic attributes of public space, including urban cleanliness, aesthetic attributes of surrounding buildings, as well as the permeability of facades, presence of street furniture for the comfort and safety of passersby, such as benches, trash cans, and flowerbeds, in addition to tree planting and good lighting (Speck, 2017; Vasconcellos, 2017; Gehl, 2010).
In order to investigate and encourage walkability and bikeability, several measurement tools or guidelines for their qualities emerged, aiming to survey the potentialities and weaknesses of certain neighborhoods or vicinities. The data collected could later be appropriated by public policy makers or organized civil society groups and, in this research, assisted in the construction of field collection criteria.
3 Methodological procedures
3.1 Definition of the evaluation object
To analyze the relationship of walkability and bikeability in a surroundings of interaction with the BRT, the Transcarioca corridor was chosen because it crosses populous neighborhoods in the North and Southwest zones and is the only one that has the maximum number of connections with other transport facilities such as metro, train, airport, and all the other corridors. In this corridor, the Paulo da Portela and Alvorada terminals proved more relevant for the analysis as they represent two distinct and opposing occupation dynamics and are located in commercially relevant neighborhoods (Jorge, 2013).
On one hand, Paulo da Portela is situated in one of the busiest commercial centers of Rio de Janeiro, with traditional layout and occupation, on a human scale, located in the suburb of the North Zone and occupied by a medium and low-income population. On the other hand, Alvorada is situated at the intersection of arterial roads in Barra da Tijuca, with planned layout and occupation, on the automobile scale, surrounded by condominiums and shopping centers and presenting a high-income population.
Since the chosen BRT terminals are located in two commercial centralities, a strong flow of people entering/exiting unrelated to housing is expected. Walking or cycling trips may have their origin/destination at individuals' residences, but also access to services, work, commerce, or leisure.
Furthermore, both Terminals represent connection points with other modes of transport, which means that not all users who access these structures necessarily carry out some activity in the surroundings. At the Paulo da Portela terminal, for example, users connect with the train lines of Madureira Station and with various bus and van lines, while at Alvorada the user can change corridors, between TransCarioca and TransOeste, and also access various bus lines.
For the analysis of walkability and bikeability in the surroundings of the terminals, it was necessary to define a study boundary for the mapping, taking into account comfortable distances for pedestrians and cyclists to complete the initial or final stretches of their trips. However, the tolerable distance for pedestrians and cyclists is not the same, so to analyze the attributes of the built environment of the surroundings, we initially started by defining two overlapping areas for the survey, a larger one considering a comfortable reach radius for cycling and a smaller one considering a comfortable radius for walking. However, this would represent a wide study area that could reach up to a 10km radius from a station (GDCI/NACTO, 2018; Labmob, 2018).
On the other hand, ITDP considers two scenarios for evaluating walking distance to a medium and high-capacity transport station: one considering a distance of 1km as sufficient and another a distance of 400m. Considering these dynamics of distance and time, the distance of 400m from the station accesses was adopted, which is within the margin of up to 525m that a pedestrian covers in 5 minutes, at an average speed of up to 5km/h (GDCI/NACTO, 2018). Since both the Paulo da Portela Terminal and the Alvorada Terminal have more than one access, the study area resulted from the combination of two and three reach radii respectively.
From this, the field survey was carried out, considering the index presented in the following topic, in the surroundings of each terminal. This survey started from an initial collection via Google Street View, with on-site visits to confirm the collected elements and observe other elements that were not possible to identify through the virtual tool.
Finally, a comparative analysis was made between the field survey and the expectations according to the collection index, in order to identify qualities of the built environment of the reference cases that promote or fail to promote walkability and bikeability. With this analysis it is possible to observe the impact of these two conditions and the BRT system on promoting the accessibility of active modes..
3.2 Definition of the evaluation index
There are several tools for measuring the built environment from the perspective of walkability and bikeability, but none that combined both, especially with the objective of evaluating modal integration, understanding that walkability criteria do not necessarily encompass the elements that affect or motivate cyclists.
The first tool that aimed to evaluate the walkability of a place was developed by Bradshaw (1993) comprising 10 evaluation categories, but considering both physical details of the built environment and perceptions questioned to pedestrians.
Speck (2017) elaborated the General Theory of Walkability, defining ten steps to make cities walkable. These steps do not function as a scoring system but rather as a set of recommendations and scenarios that foster walkability, through four dimensions: walkable cities must be useful, safe, comfortable, and interesting.
In the Brazilian context, one of the most relevant and used in scientific studies is the Walkability Index, version 2.0, developed by ITDP (2018). The index has a scoring system, considering as fundamental elements for promoting walking: good sidewalks, short distances, attractiveness through uses and facades, road and public safety, and aspects of environmental comfort, such as protection from weather and noise, grouped into 6 categories and 15 indicators.
Another tool that has been disseminated as an evaluation, but also planning instrument, is Complete Streets (WRI BRASIL, 2021), a project that is not just conceptual, but also a program initially developed in partnership with 11 Brazilian cities in 2017, in order to redesign streets aiming at comfort and safety for all people. There is no rulebook or specific criteria for what a Complete Street would be, but rather more general guidelines that must be balanced according to the local reality of each street to be remodeled.
In addition to the above instruments, there is the Global Street Design Guide (GDCI/NACTO, 2018), which presents a vastness of guidelines on how to make streets more balanced for all their users, prioritizing active modes, especially the pedestrian. The guide has the "Pedestrian Tools" and the "Cyclist Tools," a set of 31 guidance elements for intervention involving urban design, street furniture, landscaping, and active facades, and for each item there is a range of details to be followed.
Winters et al. (2013) developed a bikeability index, composed of 5 main factors, grouping characteristics that influence cyclists in their route choices: route density, segregation, connectivity, topography, and destination density. Within these factors, elements focused on signage and safety, bicycle traffic, road intersections well served by utilities, slope, and land use diversity are among the main characteristics.
Wahlgren and Schantz (2011) developed the active commuting route environment scale (ACRES), another method for measuring bikeability. In this scale, regarding bicycle users, there would be 18 factors that influence bikeability considering built environment, traffic, and social space. Most of them are more related to factors that favor or disfavor cycling flow.
Given this variety of tools with diverse and complementary criteria, we opted for the development of a single evaluation framework that would aggregate the maximum possible criteria to measure the walkability and bikeability of the same space, considering all characteristics that are directly related to the built environment. This index was then separated into items that influence cycling and items that influence walking, thus defining which analytical lens would be used for each element surveyed. It is important to note that there are items that affect both forms of mobility, therefore they appear in both frameworks.
Characteristics such as the presence of bike racks or bicycle parking directly influence cyclists, while the presence of awnings, canopies, pergolas, among other weather protection furniture and incentives to stay, are more relevant for pedestrians. Characteristics such as tree planting or noise pollution equally affect pedestrians and cyclists. That said, the definition of the unified index follows below:
Table 1: Walkability survey items
Analysis axes | Walkability |
Quality of circulation spaces | Sidewalk width |
Sidewalk paving |
Absence of obstacles |
Draining pavement |
Short distances | Small-dimension blocks |
Reach of public facilities |
Modal connections with public fruition |
Reach of parks and squares |
Distance to other modes of transport |
Well-identified accesses
|
Attractiveness | Diversity of uses |
Light traffic |
Road safety |
Crossings |
Low-speed streets |
Vertical signage |
Traffic calming |
Smart traffic lights |
Shared streets
|
Public safety | Lighting |
Short extent of opaque fences/walls
|
Environment |
Shade and shelter |
Tree planting and landscaping |
Trash can
|
Support infrastructures | Resting / staying points |
Drinking fountains |
Accesses and Accessibility |
Pedestrian ramps |
Orientation for visually impaired people |
Source: Developed by the author
Table 2: Bikeability survey items
Analysis axes | Bikeability |
Quality of circulation spaces | Cycling infrastructure |
Route objectivity |
Bike path paving |
Short distances |
Reach destinations within 5km |
Reach of public facilities |
Modal connections with public fruition |
Reach of parks and squares |
Distance to other modes of transport
|
Attractiveness | Diversity of uses |
Light traffic |
Road safety |
Safe intersections |
Low-speed streets |
Pavement markings |
Vertical signage |
Demarcated buffer |
Constructed buffer |
Traffic calming |
Smart traffic lights |
Waiting areas
|
Public safety | Lighting |
Environment |
Tree planting and landscaping |
Support infrastructures |
Bike racks / Bicycle parking |
Shared bicycle stations |
Accesses and Accessibility |
Dedicated bicycle accesses |
Integration with bicycles
|
Source: Developed by the author
To carry out the survey of the items in the table above, the criteria presented by the chosen instruments were considered. Not all determine mapping metrics, only indicating the need for the existence of certain elements, therefore, priority was given to using the survey methods of the instruments that establish some metric, that is, not just the existence of the element, but existence according to a minimum factor. Thus, the survey criteria for conducting the analyses are presented in the following table:
Table 3: Walkability survey criteria
Walkability | Criteria |
Sidewalk width | Categorization of sidewalk segments according to width, considering: wide for 3 or more people, regular for up to 2 people, and narrow for up to 1 person; and capacity considering the level of pedestrian flow and the need for pedestrians to deviate, especially into the roadway. Accommodates: meets the flow of people / Does not accommodate: does not meet the flow of people. Sidewalks that accommodate less than two people side by side or with less than 1.5m in width are automatically identified as "does not accommodate." |
Sidewalk paving |
Categorization of sidewalk segments according to the number of holes and unevenness per 100m. Poor: Above 10, Regular: Between 6 and 10, Good: Between 1 and 5, Excellent: 0 |
Absence of obstacles |
Categorization of sidewalk segments according to the presence of elements that reduce the clear circulation zone. Stones, garbage bags, bollards, sales stalls, poorly positioned poles and trees, etc. Few obstacles: Absence of elements or elements that reduce the clear zone. Many obstacles: presence of obstacles that reduce or totally obstruct the clear zone. |
Draining pavement |
Identification of adequate paving for rainwater absorption |
Small-dimension blocks |
Categorization of block faces according to the length of the sidewalk segment considering ranges of 100m. Each range increase, the block face is considered worse for travel. Excellent: Up to 200m. Good: Up to 300m. Regular: Up to 400m. Poor: Above 400m. |
Reach of public facilities |
Identification of public facilities within a 400m radius |
Modal connections with public fruition |
Identification of the complexity of exit and arrival routes between the Terminal and other modes of transport |
Reach of parks and squares |
Identification of parks and squares located within 400m |
Distance to other modes of transport |
Identification of access points to other modes of transport within 400m |
Well-identified accesses |
Identification of well-signposted and located indications to access modes of transport |
Diversity of uses |
Classification of buildings according to use |
Light traffic |
Categorization of road segments according to automobile traffic intensity |
Crossings |
Identification of all crossings and categorization of intersections according to the number of crossings presented and the presence of traffic lights (on roads above 30km/h). Complete crossing and incomplete crossing / Signalized crossing and non-signalized crossing. Footbridges and tunnels are classified as signalized crossing. |
Low-speed streets
|
Identification of road segments according to the maximum permitted speed. Survey of speed signs and speed assignment according to road typology on unsigned roads. Pedestrian-only streets or streets up to 30km/h are considered safe for pedestrians and cyclists. The higher the speed, the less safe. |
Vertical signage |
Identification of signs favorable to pedestrians. Pedestrian crossings, schools, pedestrian priority, leisure area, access to modes of transport, etc. |
Traffic calming |
Identification of traffic calming elements and the proportion of road segments with these elements in relation to the whole |
Smart traffic lights |
Identification of traffic lights with pedestrian countdown at intersections |
Shared streets |
Identification of road segments with pedestrian priority |
Lighting |
Categorization of the road segment according to lighting level considering a score sum: 20 pts if there are lighting poles aimed at the road, 40 pts if there are lighting poles for sidewalks, on a pedestrian scale, 20 points for each end of the segment that has lighting favoring crossings, and -10 pts if there are damaged or obstructed lighting poles |
Short extent of opaque fences/walls |
Identification of walls over 30m in length and comparison to the total sidewalk segments |
Shade and shelter |
Categorization of sidewalk segments according to the presence and extent of shading elements (trees, awnings, pergolas). Excellent: Over 75% / Good: Over 50% / Sufficient: Over 25% / Insufficient: Below 25% |
Tree planting and landscaping |
Identification of public spaces with trees, gardens, or shrubby elements |
Trash can |
Identification of trash cans near commercial areas and high-flow facilities |
Resting / staying points |
Identification of seats near commercial areas and in fruition areas |
Drinking fountains |
Identification of publicly accessible drinking fountains |
Pedestrian ramps |
Identification of pedestrian ramps at all intersections |
Orientation for visually impaired people / Audible and tactile signage |
Identification of audible traffic lights, tactile paving strips on sidewalks, station accesses, and pedestrian ramps |
Source: Developed by the author
Table 4: Bikeability survey criteria
Bikeability | Criteria |
Cycling infrastructure | Identification of bike lanes, bike paths, shared lanes, or bicycle-friendly roads |
Route objectivity |
Identification of the route of bikeable roads, without deviations and sinuosities |
Bike path paving |
Identification of the materiality and quality of the bikeable road paving |
Reach destinations within 5km |
Identification of destinations reachable with cycling infrastructure within 5km |
Reach of public facilities |
Identification of public facilities within a 400m radius |
Modal connections with public fruition |
Identification of the complexity of exit and arrival routes between the Terminal and cycling infrastructures |
Reach of parks and squares |
Identification of parks and squares located within 400m |
Distance to other modes of transport |
Identification of access points to other modes of transport within 400m |
Diversity of uses |
Identification of commerce, banks, and convenience stores along the routes |
Light traffic |
Categorization of road segments according to automobile traffic intensity |
Safe intersections |
Identification of signalized or protected intersections (footbridges or tunnels) |
Low-speed streets |
Identification of road segments according to the maximum permitted speed. Survey of speed signs and speed assignment according to road typology on unsigned roads. |
Pavement markings |
Markings on the pavement indicating or guiding bicycle circulation |
Vertical signage |
Identification of signs favorable to cyclists. Cyclists on the road, cyclist priority, crossings, etc. |
Demarcated buffer |
Identification of buffer strips |
Constructed buffer |
Identification of physical buffer elements |
Traffic calming |
Identification of traffic calming elements and the proportion of road segments with these elements in relation to the whole |
Smart traffic lights |
Identification of traffic lights with bicycle countdown at intersections |
Waiting areas |
Identification of waiting areas at intersections of automobile roads with bike paths |
Lighting |
Categorization of the road segment according to lighting level considering a score sum: 20 pts if there are lighting poles aimed at the road, 40 pts if there are lighting poles for sidewalks, on a pedestrian scale, 20 points for each end of the segment that has lighting favoring crossings, and -10 pts if there are damaged or obstructed lighting poles |
Tree planting and landscaping |
Identification of public spaces with trees, gardens, or shrubby elements |
Bike racks / Bicycle parking |
Identification of bike racks and bicycle parking |
Shared bicycle stations |
Identification of shared bicycle stations |
Dedicated bicycle accesses |
Identification of facilitated bicycle access at the terminal and other stations |
Integration with bicycles |
Identification of connection between the BRT and cycling infrastructures |
Source: Developed by the author
Considering that the survey encompasses a diversity of roads, for items involving mappings of many elements, preference was given to presenting the analyses in homogeneous bands for items such as lighting, sidewalk width and paving, shading, among others. All field mapping was done using the Google My Maps tool, and then imported and adjusted in QuantumGIS (QGIS) 3.28 Firenze software, where all quantitative parameters were calculated, using the field calculator tool for measuring quantities, dimensions, and percentages.
In the item on traffic intensity, traffic in the studied areas was observed at two times: at 8am and at 7pm. The Google Maps tool that maps vehicle flow levels via GPS was used as a basis, however since it does not cover all roads, the mapping was complemented with field observation.
To anticipate the survey regarding transport infrastructures, virtual sources dedicated to mapping this data were used. To identify the official transport infrastructures in the surroundings such as bus stops, terminals, and stations of the various modes of transport, data from DataRio, Google Maps, and Moovit were used. For shared bicycle stations, the information published by BikeItaú of Rio de Janeiro (BikeRio) was used, and for the identification and classification of bicycle circulation routes, the mapping of existing infrastructure by the Cycling Expansion Plan (Rio de Janeiro, 2023).
4 Mapping of built environment attributes
The analysis of the survey was organized into four sections that shared more commonalities, the first focusing on the quality of circulation spaces and related infrastructure. The second on traffic quality, while the third on public safety. The last section is dedicated to climatic comfort and landscaping.
4.1 Quality of circulation spaces, infrastructure, and accessibility
In this section, the diagnosis of capacity, conservation, obstacles, and cycling infrastructure is shown, illustrated in figures 1 to 5 and summarized in table 5. While in table 6 and figures 5 and 6, we observe accessibility conditions, support infrastructures for pedestrians and cyclists.
Walking trips and accesses take place on sidewalks and it is essential that they have comfortable paving for walking, with accessibility elements following the NBR 9050 criteria. In the case of raised crossings, it is important that the shortest possible crossing distance be considered. Sidewalks must have widths adequate to the pedestrian flow, especially in the vicinity of access points to terminals and stations, which receive larger entry and exit flows.
Bicycle trips should take place through a variety of cycling infrastructures, which can be segregated or shared, and each type will require elements and spaces adequate to the built environment and to the surrounding automobile traffic level. In the surroundings of stations, it is also necessary to have bicycle parking points, to encourage intermodality.
In general, the sidewalks surrounding the Alvorada Terminal are more qualified for comfortable walking than the perimeter studied at the Paulo da Portela Terminal. On the other hand, Alvorada does not have the same pedestrian flow and does not have occupation processes such as the installation of stalls and irregular parking of automobiles that could compromise the paving and the free circulation of pedestrians.
The Madureira Terminal is not connected to a bike path, the nearest being 400m away. In comparison, the surroundings of Alvorada are better served by cycling infrastructure, in addition to being effectively connected to the BRT terminal. Only the west side of Avenida das Américas would be the only stretch within the radius that still has no infrastructure, but which is within the cycling expansion planning.
Table 5: Notes on capacity, conservation, obstacles, and cycling infrastructure
Attribute | Paulo da Portela Terminal | Alvorada Terminal |
Sidewalk width | Adequate, but compromised on commercial streets, due to street vendors, gondolas, and high flow of people. | Adequate, but compromised around Bosque da Barra, with sections without a sidewalk. |
Sidewalk paving |
5% of stretches have excellent conservation, 62% good, 27% sufficient, and 6% insufficient |
46% of stretches have excellent conservation, 23% good, 10% sufficient, and 21% insufficient |
Absence of obstacles |
32% of stretches present conflicts |
Only 2% of stretches present conflicts |
Draining pavement |
Not found |
Not found |
Cycling infrastructure |
No connection to bike path. The nearest is 400m away |
Connected to bike paths, in the directions of the beach, Bosque da Freguesia, and Jardim Oceânico. |
Route objectivity |
No objectivity |
Objective routes |
Bike path paving |
Well signposted and conserved |
Poorly signposted and poorly conserved |
Integration with bicycles |
Not integrated |
Precarious integration, without parking |
Source: Developed by the author
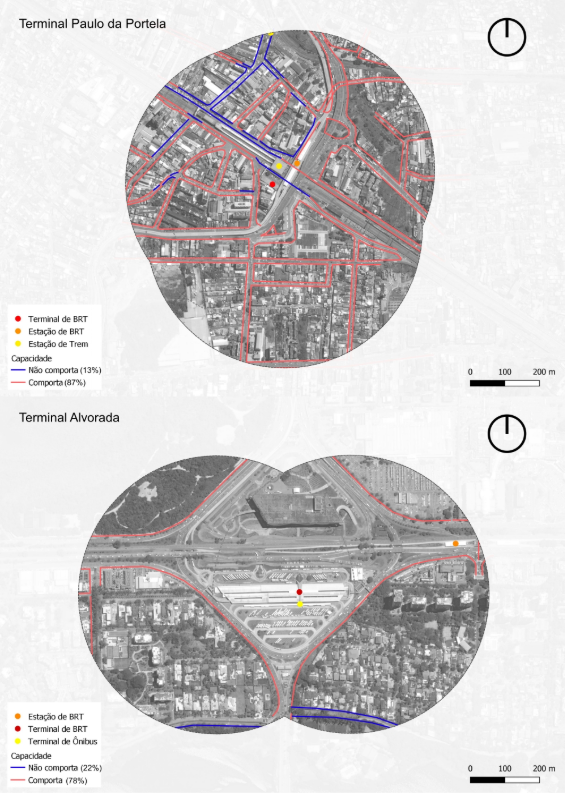
Figure 1: Sidewalk flow capacity.
Source: Developed by the author.
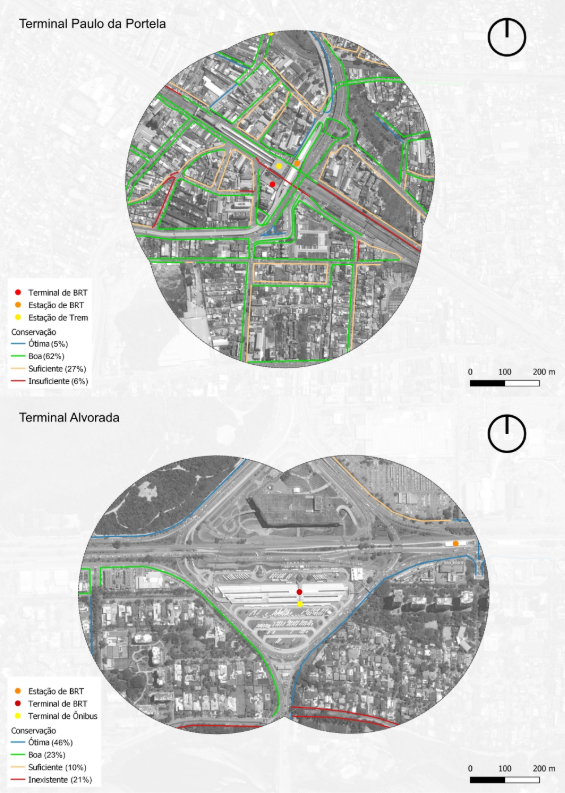
Figure 2: Sidewalk conservation.
Source: Developed by the author.
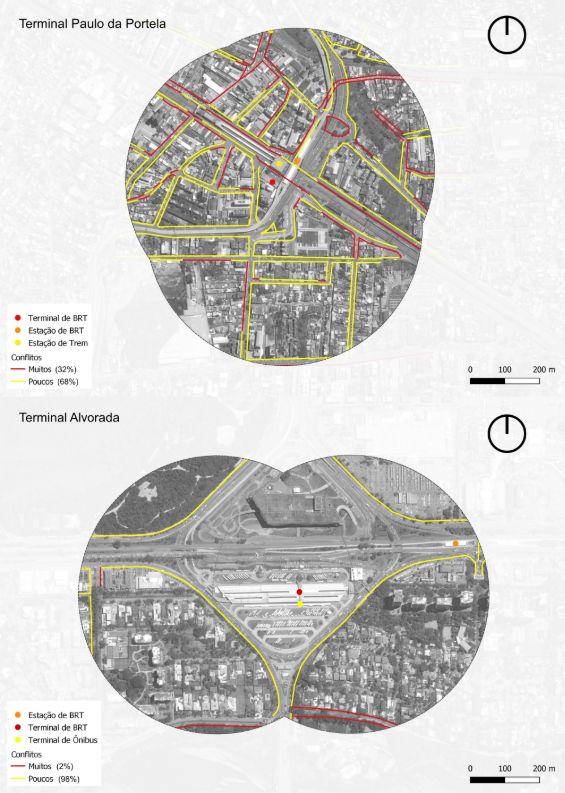
Figure 3: Sidewalks with conflict elements with pedestrian flow.
Source: Developed by the author.
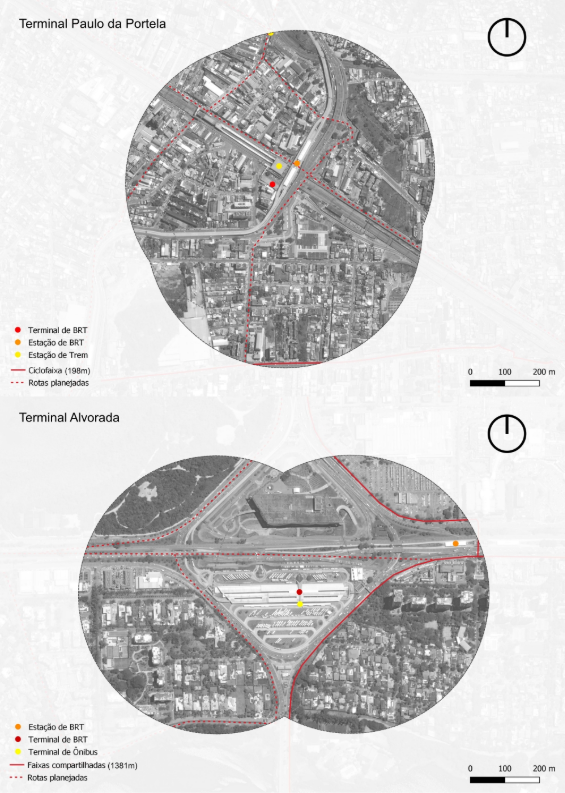
Figure 4: Cycling infrastructure.
Source: Developed by the author.
In both studied scenarios, no audible signage elements were identified, which would mainly help visually impaired people. Tactile paving was only identified alongside ramps, with the exception of warning paving at store entrances on the new pedestrian promenade of Avenida Ministro Edgard Romero, in Madureira.
Although the goal of pedestrians and cyclists is to reach their desired destination, the need for pauses during the route may arise, and it would be ideal to have rest points and water distribution for refreshment. In this sense, the two studied areas provide few seating options on public roads and no public drinking fountains.
For cyclists, support elements that encourage bicycle use involve the installation of bike racks, bicycle parking, and shared bicycle stations. Neither of the analyzed terminals has bicycle parking within its structures. In the surroundings of the Paulo da Portela terminal, no bike racks or shared bicycle stations were identified. In the Alvorada terminal surroundings, it is possible to access a shared bicycle station of BikeRio, and public bike racks were found only in the underground crossing near Barra Shopping.
In general, cyclists who wish to use their own bicycle to arrive at or leave the BRT terminals need to risk leaving them locked to poles and railings, not appropriate for this function. There is hope that this scenario will change, with the new law approved in 2023 requiring all BRT stations to have bicycle parking (Rio de Janeiro, 2023).
Table 6: Notes on accessibility, support infrastructures for pedestrians and cyclists
Attribute | Paulo da Portela Terminal | Alvorada Terminal |
Orientation for visually impaired people / Audible and tactile signage | No audible signage and tactile paving only alongside ramps and at the entrance of some stores | No audible signage and tactile paving only alongside ramps, with many curb cuts not signposted |
Modal connections with public fruition |
Main accesses direct via streets, but also footbridges, stairways, or elevators (varied operation) |
Mandatory accesses via footbridges / transfer between Terminal platforms |
Pedestrian ramps |
>Two pedestrian crossings with absence of ramps. >6 ramps without tactile paving. >28 curb cuts 55% with damaged paving or tactile paving |
>All crossings with ramps or curb cuts >4 ramps without tactile paving >9 curb cuts Paving and tactile paving conserved |
Resting / staying points |
>Few public seats distributed, in concentrated areas. >Many bus shelters that can serve as shelter |
>Public seats nonexistent >No bus shelters in the surroundings |
Drinking fountains |
Public hydration spots not found |
Public hydration spots not found |
Bike racks / Bicycle parking |
No bicycle parking at the terminal, nor bike racks in the surroundings. |
No bicycle parking at the terminal, with bike racks in the surroundings (Barra Shopping underground passage)
|
Shared bicycle stations |
Not found |
Has one station |
Dedicated bicycle accesses |
Not found |
Not found |
Source: Developed by the author.
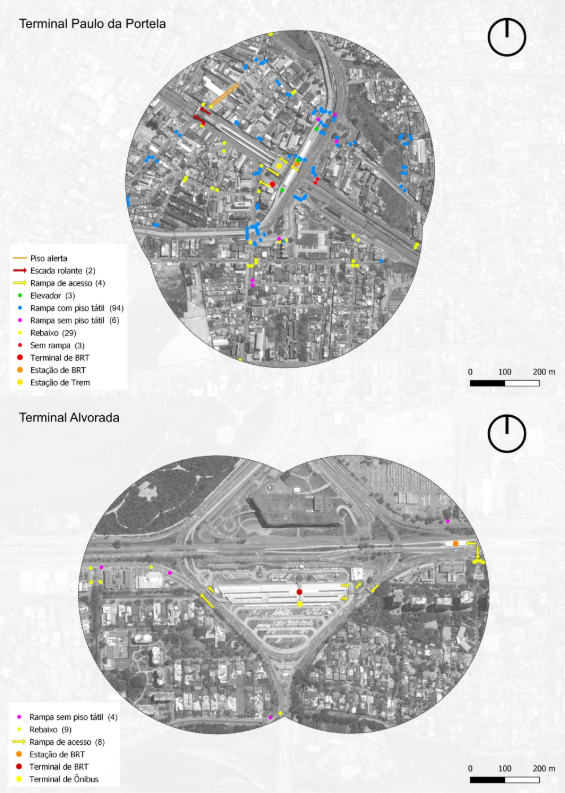
Figure 5: Accessibility attributes.
Source: Developed by the author.
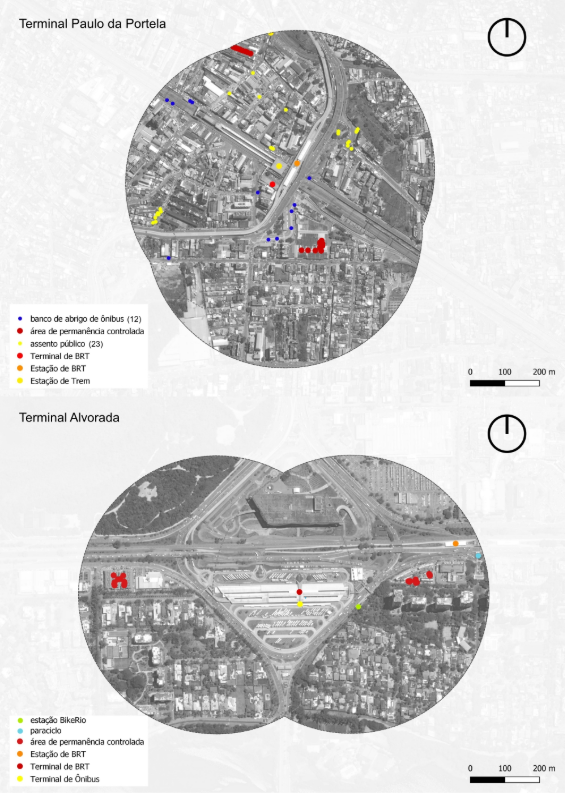
Figure 6: Attributes of staying/resting places.
Source: Developed by the author.
4.2 Short distances, attractiveness, and landscape quality
In this section, the results of the survey on sidewalk distances traveled in the surroundings of the terminals and the ease of access to other transport services, public agencies, and community and leisure facilities are presented, shown in table 7 and figures 7 and 8. While table 8 and figures 9 and 10 deal with diversity of uses and tree planting.
Short distances encourage pedestrians to access services (Cervero, 2013) and walking is acceptable up to 400m to reach destinations, with up to 200m being ideal, while for cyclists, it is important that the cycling infrastructure allows access to destinations within a 5km radius, distance they are willing to cycle (Winters et al., 2013). It is important that accesses to public facilities, including transport stations, and leisure areas are easy to reach and well signposted so that pedestrians and cyclists can circulate with objectivity.
The Paulo da Portela terminal has more varied and stimulating routes while the Alvorada terminal has longer and more discouraging distances, due to the extensive railings and walls of condominiums and shopping malls. Pedestrians entering or leaving the Paulo da Portela Terminal can connect with various modes of transport within the radius, access various public services and some squares, two of them, in fact, with nighttime activities. On the other hand, there are no directional signs for users to reach these points, much less which lines and routes they can use. Meanwhile, as there is no connection with bike paths, access to facilities and activities is compromised for cyclists.
Users of the Alvorada Terminal only have the option of connection with bus lines, accessed through the conventional bus platforms that make up the BRT structure. Considering that the surrounding distances are extensive, it becomes advantageous for passenger travel to exchange lines and services quickly and objectively within the same structure. Cyclists have more benefits since there is already a more significant cycling network in Barra. In addition to being able to circulate along the entire waterfront of Barra da Tijuca and Recreio dos Bandeirantes, they can access a series of businesses, services, and public facilities located on Avenida das Américas and Ayrton Senna, such as the Lourenço Jorge Hospital, the Jardim Oceânico metro station, and Gardênia Azul, a neighborhood with a more humble population and more lacking in infrastructure.
On the other hand, the surroundings include Bosque da Barra, a natural park widely used for picnics, however with an uninviting access. Public facilities are only accessed by covering distances greater than 400m, requiring more travel effort, making it more advantageous in terms of time and energy to use BRT transport, conventional bus, or bicycle. Regarding identified directional signage, in the surroundings there is only one sign indicating Barra beach, there is not even guidance to the Bosque.
Table 7: Notes on block dimensions and access to facilities and services.
Attribute | Paulo da Portela Terminal | Alvorada Terminal |
Small-dimension blocks | Sidewalk stretches with variable distances, but mostly stimulating | Sidewalk stretches with long and discouraging distances |
Modal connections with public fruition / Distance to other modes of transport |
Easy access to train stations of different branches and 18 bus stops in the surroundings |
Easy access to buses that enter the Terminal. |
Well-identified accesses |
No directional signage |
The platforms are well signposted, but there is no signage on the outside. |
Reach of public facilities |
Easy access to public services
|
Difficult access to public services
|
Reach of parks and squares |
Easy access to some squares (some with nighttime activities) |
Easy access to Bosque da Barra, but uninviting route. |
Reach destinations within 5km (bicycle) |
No connectivity |
Ease of access to various destinations |
Source: Developed by the author.
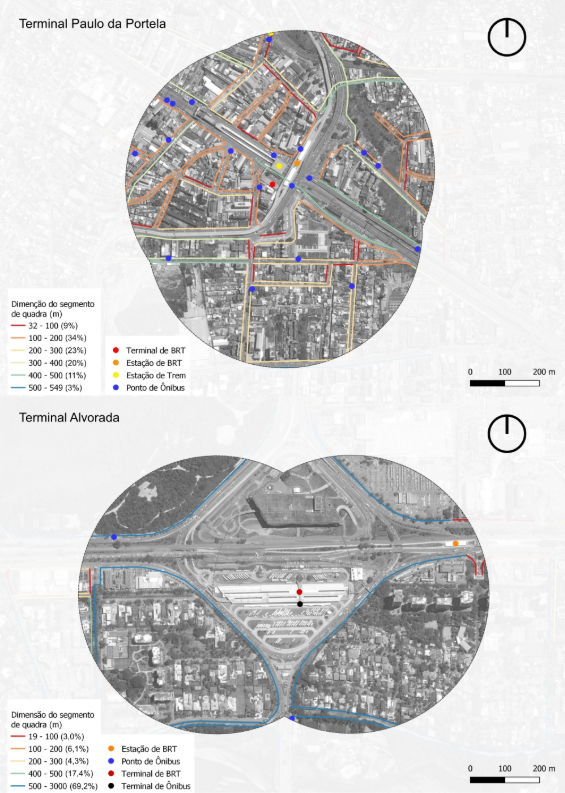
Figure 7: Block segment dimensions.
Source: Developed by the author.
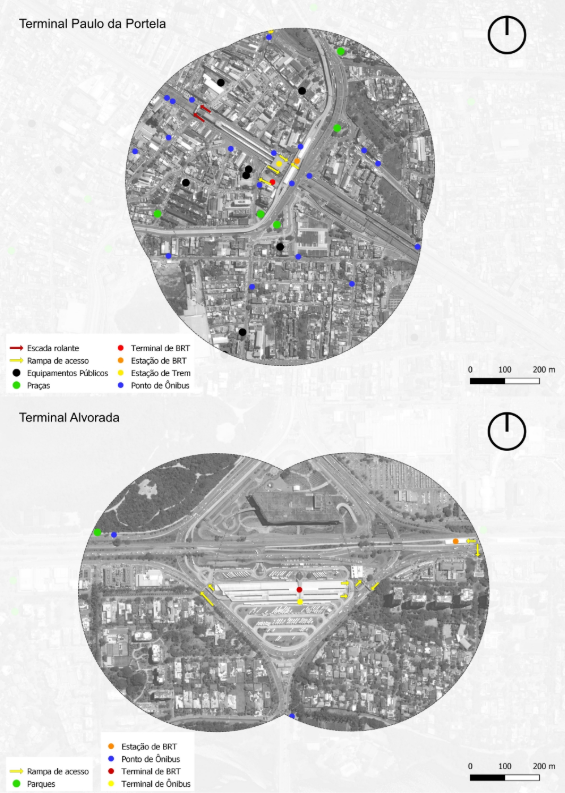
Figure 8: Access to community and leisure facilities.
Source: Developed by the author.
Table 8: Notes on diversity of uses and tree planting.
Attribute | Paulo da Portela Terminal | Alvorada Terminal |
Diversity of uses | Diversified, but poorly balanced Integrated relationship with the public road | Little diversified / monofunctional Distanced relationship with the public road |
Shade and shelter |
Few shading structures |
Few shading structures |
Tree planting and landscaping |
Scarce and scattered tree planting |
Dense tree planting, but with stretches without |
Trash cans |
Few, concentrated on commercial streets
|
Almost nonexistent |
Source: Developed by the author.
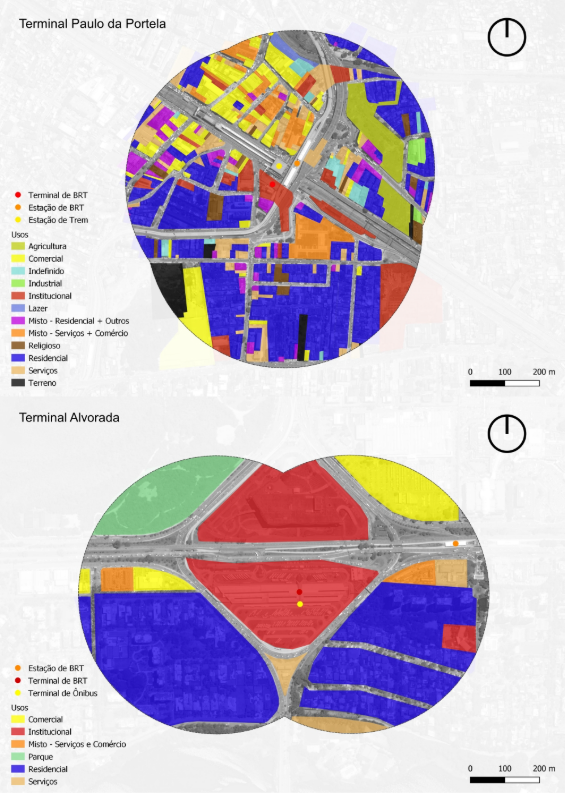
Figure 9: Variety of uses.
Source: Developed by the author.
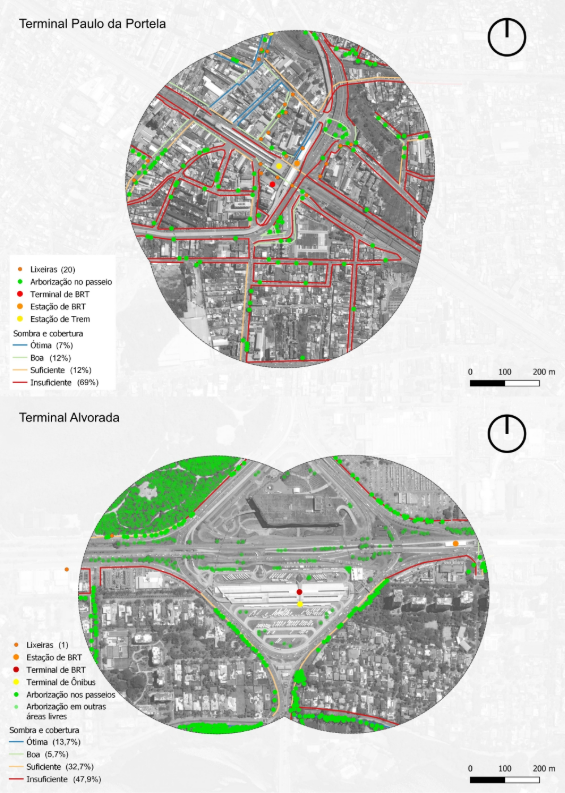
Figure 10: Attributes of urban cleanliness, shading, and tree planting.
Source: Developed by the author.
4.3 Traffic and Road Safety
In this section, we explore the surveys on traffic intensity and calming, road speed, and crossings, summarized in table 9 and illustrated in figures 11 to 14.
Streets with light traffic are more stimulating for pedestrians, as the noise level is more comfortable compared to those with heavier traffic. At the same time, congested streets compromise the use of public transport by bus, because without the existence of an exclusive lane or bus circulation preference, the trip will demand much more time than expected by the user.
During the day, heavy traffic in Madureira is concentrated on roads parallel to the railway line, where bus stops and accesses to the train station are located. At night this scenario expands, extending congestion to stretches influenced by intersections near the viaduct loops and on Rua Maria Lopes, in addition to increased intensity on other commercial streets. At the beginning of the day, with local activities starting their workday, pedestrian and cyclist trips are more comfortable, while at night, the main return time for people, the surroundings of Paulo da Portela are less stimulating for walking and cycling on the main roads.
The surroundings of Alvorada, on the other hand, are basically composed of expressways and present more intensity at the beginning of the day in the Beach - Avenida das Américas direction (east side) and at the roundabout for those wishing to follow this path. Pedestrians who, perhaps, wish to go to the beach at the beginning of the day may feel more uncomfortable with the traffic and, considering it is not a very attractive path for walking. In the nighttime period, the flows in the opposite direction present greater intensity, the stretch parallel to the sidewalk surrounding the Carrefour market being more intense. The path is extensively flanked by railings, which combined with the noise of automobiles makes walking discouraging and unsafe.
As cyclists have no circulation space on the asphalt, in the case of Barra, traffic intensity does not interfere with the flow of those who use the shared lanes. However, for adventurers who wish to cycle on the west side of the study area, traffic intensity makes using the expressways unsafe.
It is also fundamental for the comfort of pedestrians and cyclists that the environment in which they circulate protects them from road traffic. Streets with low speeds and well signposted, as well as marked crossings, with traffic lights and consistent with the flow of people, are important elements for the feeling of safety when walking and cycling.
Friendly streets should have a maximum permitted speed of 30 km/h and the higher the limit, the greater the chances of fatal accidents. It was identified that the main roads of both surroundings, where pedestrian and cyclist flows are concentrated, do not convey safety for their circulation. Any traffic accident situation on these roads can result in fatality.
Only residential streets present lower permitted limits, where there are also traffic calming elements, which function as abrupt reducers of the speed of drivers accessing from faster roads. More than half of the intersections in the surroundings of Madureira do not meet the safety needs and desires of pedestrians.
The context of the center of Madureira is favorable for conflicts between automobiles, pedestrians, and cyclists, since the commercial streets do not accommodate the pedestrian flow and have no cycling infrastructure to separate cyclists from automobile lanes. There is a very present behavior of people deliberately crossing the roads outside signposted crossings to shorten access time to stores and street vendors, risking accidents not only with drivers, but also with bicycles.
In the case of Alvorada, the study area did not cover the grade-level crossings of Avenida das Américas, so those identified are located at intersections with internal roads, which had no signage. On the other hand, the crossing options are independent of car traffic: two footbridges and one tunnel. These are not recommended typologies, as they increase pedestrian travel time and contribute to a feeling of insecurity in situations of low movement or lighting.
As for cycling signage, the bike lane in Madureira is well signposted with signs and crossing paint, while the shared lane in Barra has worn paint and is practically absent of signs in the evaluated surroundings. Other elements that assist in the safety of cyclist traffic were not found.
Table 9: Notes on traffic intensity and calming, road speed, and crossings.
Attribute | Paulo da Portela Terminal | Alvorada Terminal |
Light traffic | 77% with light traffic during the day. Drops to 52% at night. | 64% with light traffic during the day Rises to 69% at night. |
Low-speed streets |
Streets with higher circulation are not safe |
Streets with higher circulation are not safe |
Crossings |
25.8% of crossings are completely signalized (traffic light and crossing) 19.4% of crossings do not require signage |
60% of crossings have neither traffic lights nor crossing markings 40% of crossings do not require signage |
Traffic calming |
Present on low-circulation roads |
Present on low-circulation roads |
Vertical signage |
Existence of pedestrian circulation signs, but deficient on main roads Bike path well signposted |
No pedestrian circulation signs. One sign about bike path. |
Pavement markings (bike path) |
Bike path well marked, including at intersections |
Shared lane poorly marked |
Demarcated buffer |
Not found |
Not found
|
Constructed buffer |
Not found |
Not found |
Smart traffic lights |
Not found |
Not found |
Waiting areas | Not found | Not found |
Source: Developed by the author.
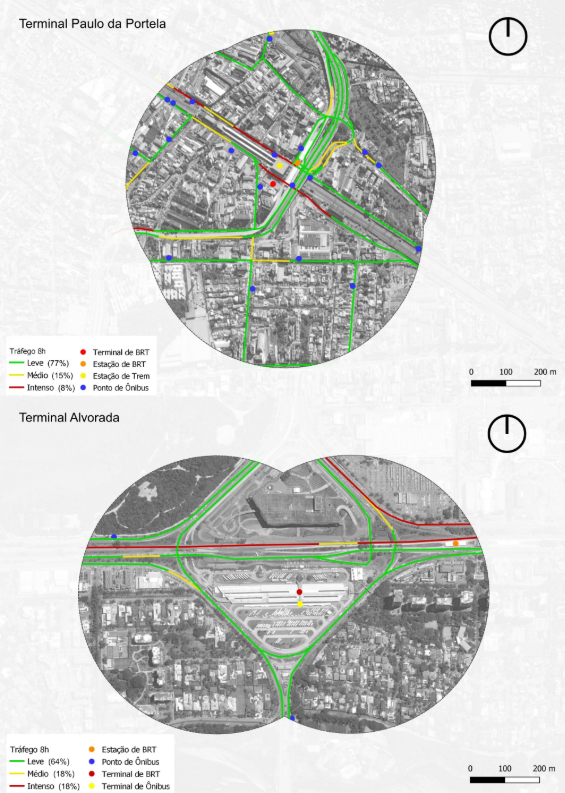
Figure 11: 8am traffic.
Source: Developed by the author.
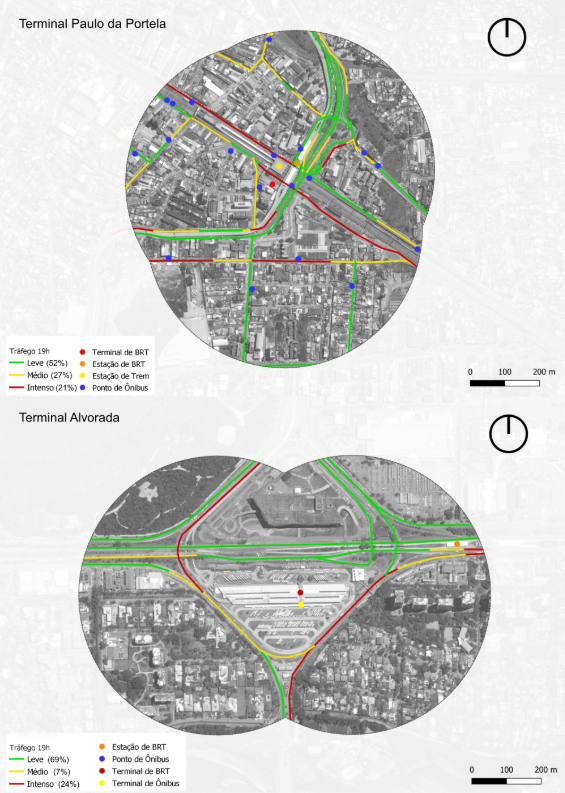
Figure 12: 7pm traffic.
Source: Developed by the author.
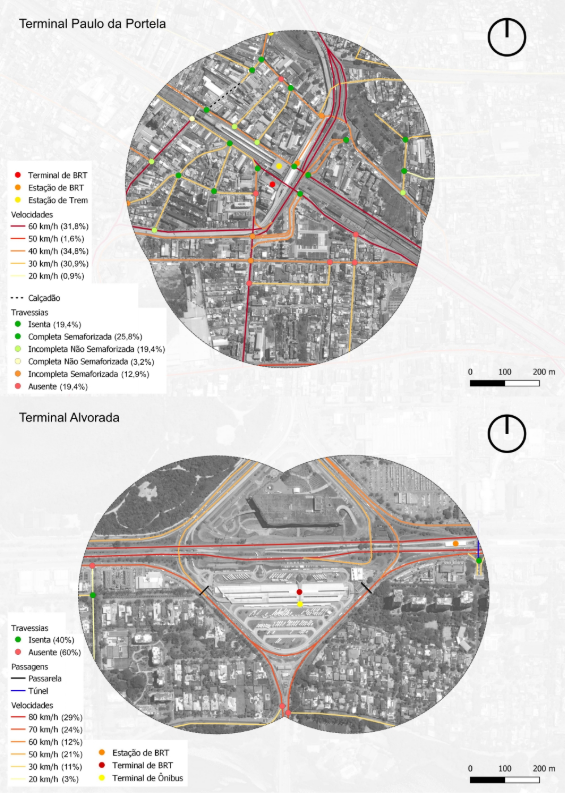
Figure 13: Attributes of permitted speed and crossings.
Source: Developed by the author.
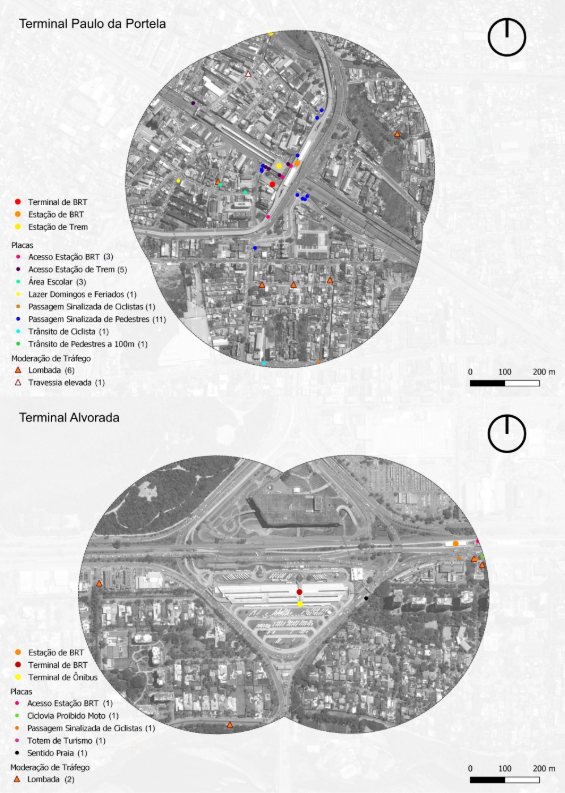
Figure 14: Attributes of traffic calming and road signage.
Source: Developed by the author.
4.4 Public Safety
In this section, we show the results on physical attributes that contribute to the feeling of public safety, visualized in figure 15 and table 9. The more deficient the public lighting and the more extensive the walls, the greater the feeling of insecurity for pedestrians and cyclists, especially women (Giannotti et al., 2017), as the environment is more prone to situations of violence.
In the analysis of the Madureira study area, luminosity is considered sufficient in 90% of sidewalks and public roads, due, however, to lighting dedicated only to automobile circulation lanes, but which illuminate the sidewalks. Only 10% of these segments present satisfactory levels of luminosity for pedestrians thanks to the remaining luminaires from Rio Cidade (IPLANRIO, 1996). On the other hand, the 10% insufficient are concentrated in the vicinity of the Negrão de Lima and BRT viaducts, that is, wall faces, areas covered by the structures, and the public sidewalks that compose them. The surroundings of the Alvorada Terminal, in turn, present a highly unsafe environment for pedestrians and cyclists, especially at night, where more than 92% of sidewalks (including shared lanes) do not have sufficient lighting characteristics.
Approximately 21% of the sidewalks around Paulo da Portela are faced by extensive walls without lighting that prioritizes the pedestrian, which become twilight zones, reinforcing the feeling of insecurity. More than 75% of the sidewalk/shared lane and footbridge segments around Alvorada are flanked by walls and railings, a consequence of large gated condominiums, shopping malls/supermarkets, and a large fenced park, which increase exposure to situations of violence.
For cyclists, circulation on the roadways becomes more advantageous than on sidewalks, as they present better lighting levels and walled stretches are more easily overcome by bicycle, despite the low attractiveness. The most unsafe points end up being those facing the BRT viaduct, as they have low visibility of third-party observation and possibility of escape.
Table 10: Notes on lighting and extent of railings and walls.
Attribute | Paulo da Portela Terminal | Alvorada Terminal |
Lighting | 90% between sufficient and excellent Little lighting focused on sidewalks | Only 8% sufficient No lighting focused on sidewalks |
Short extent of opaque fences/walls |
21% of sidewalk segments are faced by extensive walls or railings
|
92% of sidewalk segments are faced by extensive walls or railings |
Source: Developed by the author.
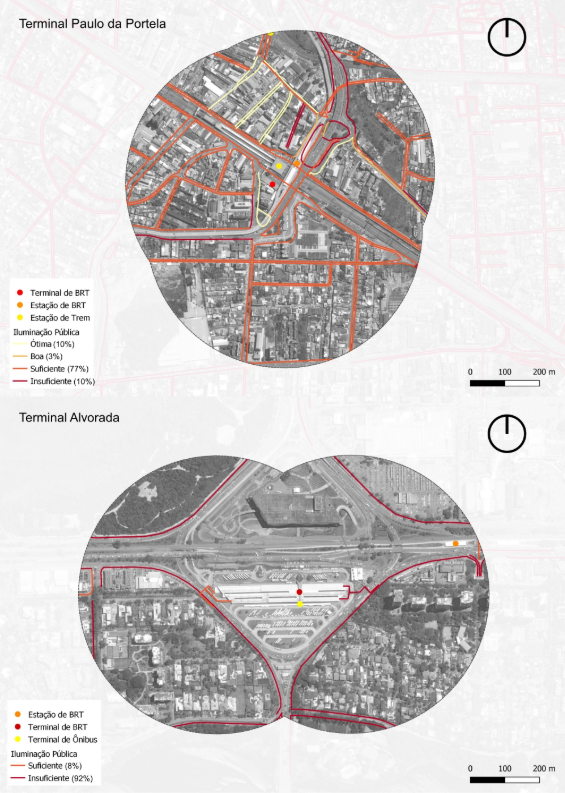
Figure 15: Lighting attributes.
Source: Developed by the author.
4.5 Synthesis of the survey
It is perceived that neither of the two reference cases presents a fully satisfactory reality for walkability and bikeability, with the majority of items presenting deficiencies. On the other hand, in the comparison between the two study areas, the surroundings of the Paulo da Portela Terminal are more stimulating for pedestrians, while for cyclists, the Barra da Tijuca area presents elements more favorable to bicycle use.
The result of this greater stimulus to walking, in the case of Madureira, and to cycling in the case of Barra da Tijuca, is much more related to the history and type of occupation of each region. In Madureira, passersby benefit from the more traditional occupation of a predominantly retail and street-level commercial centrality, which is attractive to lower-income consumers. Meanwhile, in the case of Barra da Tijuca, the characteristic is the built complex and public areas in large proportions with their closed, controlled limits and little interaction with public space, favoring car use for travel. Thus, public space becomes uninviting for pedestrians, who, in turn, are hardly local residents or consumers.
It is not surprising that the sidewalks present better conservation, since there is a lower flow of pedestrians circulating, as well as few points of entry and exit of people provided by the low attractiveness of uses. Consequently, they do not attract some problems such as the irregular occupation of sidewalks by shopkeepers, street vendors, or drivers. However, it is a more interesting environment for bicycle use as it offers distinct cycling routes separated from vehicle traffic and easy connection to the terminal.
5 Conclusion
The use of the public transportation system is essential for the travel of economically disadvantaged people, however it is known that collective transport does not serve the entire trip of all its users, so a portion of their journeys to their destination is made on foot or by bicycle. In low-income groups, walking as the main form of travel is significant, while bicycle use becomes the most viable option, if not the only means of transport for longer distances. Thus, prioritizing pedestrians and cyclists in the transport system is closely related to the accessibility of these people, since it guarantees access opportunities with cost reduction through walking and cycling.
Walkability and bikeability are sets of characteristics of the built environment that encourage active modes, and there are several measurement tools for these two sets. From the grouping of items directly related to the built environment that most objectively affect pedestrian and cyclist travel, it was possible to observe which of these promote or discourage walking or cycling as a complementary trip in the daily journeys of citizens.
It was noticed that neither of the two studied reference cases presents a fully satisfactory reality for the promotion of walkability and bikeability, having mostly characteristics that are little or not at all stimulating. Understanding that these deficiencies of the built environment directly affect travel on foot or by bicycle, predominant forms of mobility for disadvantaged groups (Vasconcellos, 2018), this implies a serious problem of social justice in urban mobility policies, which does not properly look at active modes. It is hoped that this survey contributes to urban intervention policies that are more sensitive to pedestrians and cyclists in the analyzed regions.
The surroundings of Paulo da Portela already have a diversity of attractiveness that promote a high flow of people and interventions should enhance the qualities of the surroundings, for example, reviewing and requalifying public sidewalks to accommodate people flows and make them more accessible; enabling shared streets for bicycles; improving lighting with luminaires focused on the pedestrian and reducing twilight zones; installing more rest points with shading in places of greater movement and better landscape quality; improving road signage to favor pedestrian and cyclist orientation, especially about intermodal connections.
Meanwhile, in Alvorada, in addition to the previous suggestions, there could be a redesign of the terminal surroundings to the human scale, with the insertion of landscape elements that reduce exposure to weather and feelings of insecurity, noise, and long distances. Explore the connection to the beach and the park, through continuous attractive visual and physical elements for pedestrians and cyclists, and road signage aimed at the human scale; and the access footbridges to the terminal, making them less hostile, with attractive design, well-lit and covered.
As this study adopted some of the walkability and bikeability factors identified in the reference framework for the field survey, it would be enriching for complementary analyses or studies in other regions to expand the details to be observed as well as the size of the studied area. The field survey boundary had as a reference the maximum distance walked comfortably, however, for an analysis that wishes to understand more deeply the attributes of public space along a cycling route, an expanded study with a radius of up to 5km is recommended, ideal distance for bicycle users. Considering the new bike parking law, an analysis of the advances in intermodality between BRT stations and bicycles since 2023 is suggested.
It would also be relevant to deepen the understanding of the impact of climate change on walkability and bikeability, considering the record heat indices of Rio de Janeiro, understanding, for example, how the lack of environmental comfort elements has affected the circulation of people in the studied surroundings on extremely hot days. In the case of Madureira, it certainly has an impact on street commerce in these situations. Still thinking about commerce, it would also be interesting to conduct a study investigating the relationship between sidewalk attributes and the economic vitality of the analyzed regions.
Certainly, it is also essential to have a more expanded analysis of the profile of people who are most affected by the shortcomings of the transport system, especially active modes, in order to deepen the look at social justice, considering at least race and gender. Poorly lit and low-traffic paths, for example, are less attractive to women, who are more exposed to situations of crime, especially sexual violence.
One must also think about promoting walkability and bikeability from a broader and interdisciplinary view of urban planning. An environment suitable for cycling and walking also results from the overlap or coordination of planning decisions that make it more or less receptive to active modes. It could start from an adequate application of zoning, which should promote mixed-use use and occupation, redistribution of work opportunities and access to commerce, services, and leisure, avoiding long trips, density combined with the curbing of urban sprawl and in places with good infrastructure.
Finally, as can be observed in the reference case of Madureira, the contributions of the collected data not only bring to light issues of the surroundings of the BRT Terminal, but also of the Madureira train station. Therefore, the methodology of this research on the spatial relationship between BRT corridors and active modes can also be applied to understand the dynamics of integration with other mass transit systems.
References
ANDRADE, V. LINKE, C. C. (Org.). Cidades de Pedestres. Rio de Janeiro, RJ: Babilônia Cultura Editorial, 2017.
ANTP, ASSOCIAÇÃO NACIONAL DE TRANSPORTE PÚBLICO. Sistema de informação da mobilidade urbana, relatório 2018, São Paulo, 2020.
BANISTER, D. The sustainable mobility paradigm. Transport Policy, n 15, p. 73-80, 2008.
BRADSHAW, C. Creating – And Using – A Rating System For Neighbourhood Walkability Towards an Agenda for “Local Heroes”. In: 14th International Pedestrian Conference. Anais... Boulder, Colorado, 1993.
BRASIL. Lei de Mobilidade Urbana. Lei 12.587, de 3 de janeiro de 2012. Brasília, 2012.
CARERI, F. Walkscapes: El andar como práctica estética. Barcelona, ESP: Editorial Gustavo Gili, 2002.
CERVERO, R. Transport Infrastructure and the Environment: Sustainable Mobility and Urbanism. Working Paper, No. 2013-03, University of California, Institute of Urban and Regional Development (IURD), Berkeley, CA, 2013.
CIDADE ATIVA. Diagnóstico Ruas Completas: Joel Carlos Borges. Relatório Final. Cidade Ativa, 2018.
FERREIRA, E. Integração com transporte não-motorizado. ANTP, 2007.
GEHL, Jan. Cities for People. Washington, D.C: Island Press, 2010.
GIANNOTTI, M, et al. Gênero e Andar a Pé: Ambiente Construído Incentiva Igualmente Mulheres e Homens a Caminhar? In: ANDRADE, V. LINKE, C. C. (Org.). Cidades de Pedestres. Rio de Janeiro, RJ: Babilônia Cultura Editorial, 2017.
GLOBAL DESIGNING CITIES INITIATIVE (GCDI) & NATIONAL ASSOCIATION OF CITY TRANSPORTATION OFFICALS (NACTO). Guia Global de Desenho de Ruas. São Paulo, SP. Editora Senac São Paulo, 2018.
INSTITUTO BRASILEIRO DE GEOGRAFIA E ESTATÍSTICA (IBGE). Censo Demográfico 2022. Rio de Janeiro: IBGE, 2022
INSTITUTO DE POLÍTICAS DE TRANSPORTE E DESENVOLVIMENTO (ITDP). Guia de Planejamento Cicloinclusivo, 2017;
INSTITUTO DE POLÍTICAS DE TRANSPORTE E DESENVOLVIMENTO (ITDP). Índice de Caminhabilidade 2.0: Ferramenta. Rio de Janeiro, 48 p., 2018.
INSTITUTO DE POLÍTICAS DE TRANSPORTE E DESENVOLVIMENTO (ITDP). Padrão de Qualidade DOTS, 2017.
IPLANRIO, Empresa Municipal de Planejamento e Informática do Rio de Janeiro. Rio Cidade: o urbanismo de volta às ruas. Rio de Janeiro: MAUAD, 1996.
JORGE, G. Análise do centro do bairro da Taquara e sua transformação da malha urbana através da implantação do BRT Transcarioca. Dissertação (Mestrado) – Escola Politécnica, Universidade Federal do Rio de Janeiro. Rio de Janeiro, 2013.
KASSENS-NOOR, E, et al. Olympic Transport Legacies: Rio de Janeiro’s Bus Rapid Transit System. Journal of Planning Education and Research, v. 38, n. 1, 2016.
LEFÈVRE, B. Urban Transport Energy Consumption: Determinants and Strategies for Its Reduction. S.A.P.I.E.N.S, v. 2, n. 3, 2009.
MASCARÓ, Lúcia. MASCARÓ, Juan. Vegetação Urbana. Porto Alegre: FINEP: UFRGS, 2002.
MILANO, Miguel. DALCIN, Eduardo. Arborização de Vias Públicas. Rio de Janeiro: Light, 2000.
MINISTÉRIO DAS CIDADES. Manual de BRT. Bus Rapid System. Guia de Planejamento. Brasília, 2008
PEREIRA, R. H. M. Justiça distributiva e equidade no transporte: legado dos megaeventos e desigualdades de acesso a oportunidades no Rio de Janeiro. Rio de Janeiro: IPEA, 2019.
PREFEITURA DO RIO DE JANEIRO. CicloRio: Plano de Expansão Cicloviária. Rio de Janeiro: Rio Prefeitura, 2023. Available at: http://transportes.prefeitura.rio/wp-content/uploads/sites/31/2022/07/CicloRio-Plano-de-Expansão-Cicloviária-transportes.pdf. Accessed on: 5 oct. 2023
RODRIGUES, J. Acessibilidade, caminhabilidade e políticas para portadores de deficiência no Brasil. In: ANDRADE, V. LINKE, C. C. (Org.). Cidades de Pedestres. Rio de Janeiro, RJ: Babilônia Cultura Editorial, 2017.
RIO DE JANEIRO. Lei Nº 7.792, de 9 de março de 2023. Dispõe sobre a instalação de bicicletários nas estações de acesso ao BRT - Transporte Rápido por Ônibus. Rio de Janeiro, RJ: Câmara Municipal, 2023.
SPECK, J. Cidade Caminhável. São Paulo, SP: Perspectiva, 2017.
TRANSPORTE ATIVO; LABMOB. Pesquisa Perfil do Ciclista 2015. Rio de Janeiro, 2018. Available at: http://ta.org.br/perfil/ciclista.pdf. Accessed on: 08 nov. 2023.
VASCONCELLOS, E. A. Mobilidade Urbana e Cidadania. São Paulo, SP: Senac São Paulo, 2018.
VASCONCELLOS, E. A. Andar nas cidades do Brasil. In: ANDRADE, V. LINKE, C. C. (Org.). Cidades de Pedestres. Rio de Janeiro, RJ: Babilônia Cultura Editorial, 2017.
WAHLGREN, L. SCHANTZ, P. Bikeability and methodological issues using the active commuting route environment scale (ACRES) in a metropolitan setting. BMC Medical Research Methodology 2011.
WINTERS, M. et al. Mapping bikeability: a spatial tool to support sustainable travel. Environment and Planning B: Planning and Design, v. 40, 2013.
WRI BRASIL. Ruas Completas no Brasil: Promovendo uma mudança de paradigma. WRI Brasil, 2021. Available at: https://www.wribrasil.org.br/publicacoes/ruas-completas-no-brasil. Accessed on: 1 nov. 2023.
About the Authors
Walter Manoel Pereira Neto holds a degree in Architecture and Urbanism (UFRJ), is a specialist in Urban Policy and Planning (IPPUR/UFRJ), and holds a Master's in Urbanism (PROURB/UFRJ). He has expertise in active mobility, geoprocessing, and GIS. His academic and professional work involves georeferencing methods and geospatial data analysis, as well as vectorization, editing, and updating of cartographic bases.
Victor Andrade Carneiro da Silva was an Adjunct Professor at the Federal University of Rio de Janeiro and Coordinator of the Sustainable Mobility Laboratory (LABMOB) of the Graduate Program in Urbanism (PROURB) and is an Associate Professor at the Department of Engineering Technology and Didactics, of the Technical University of Denmark. Head of the DTU research group in Logistics. Specialist in Mobility Hubs, Electric Mobility, and Micromobility.
Author Contributions
Conceptualization, [W.M.P.N.]; methodology [W.M.P.N.; V.A.C.S.]; software [W.M.P.N.]; validation [W.M.P.N.]; formal analysis [W.M.P.N.]; investigation [W.M.P.N.]; resources [W.M.P.N.]; data curation [W.M.P.N.]; writing—original draft preparation [W.M.P.N.; V.A.C.S.]; writing—review and editing [W.M.P.N.]. All authors have read and agreed to the published version of the manuscript.
Conflicts of Interest
The authors declare no conflicts of interest.
About Coleção Estudos Cariocas
Coleção Estudos Cariocas (ISSN 1984-7203) is a publication dedicated to studies and research on the Municipality of Rio de Janeiro, affiliated with the Pereira Passos Institute (IPP) of the Rio de Janeiro City Hall.
Its objective is to disseminate technical and scientific production on topics related to the city of Rio de Janeiro, as well as its metropolitan connections and its role in regional, national, and international contexts. The collection is open to all researchers (whether municipal employees or not) and covers a wide range of fields — provided they partially or fully address the spatial scope of the city of Rio de Janeiro.
Articles must also align with the Institute’s objectives, which are:
- to promote and coordinate public intervention in the city’s urban space;
- to provide and integrate the activities of the city’s geographic, cartographic, monographic, and statistical information systems;
- to support the establishment of basic guidelines for the city’s socioeconomic development.
Special emphasis will be given to the articulation of the articles with the city's economic development proposal. Thus, it is expected that the multidisciplinary articles submitted to the journal will address the urban development needs of Rio de Janeiro.