
Volume 14 Issue 2 *Corresponding author fabiolimageo@gmail.com Submitted 30 Apr 2026 Accepted 22 Jun 2026 Published 06 Jul 2026 Citation LIMA, F. S. et al. Analysis of population travel to Family Clinics (FC) and Municipal Health Centers (CMS) in the Geographic Regions of the City of Rio de Janeiro. Coleção Estudos Cariocas, v. 14, n. 2, 2026.
DOI: 10.71256/19847203.14.2.227.2026 The article was originally submitted in PORTUGUESE. Translations into other languages were reviewed and validated by the authors and the editorial team. Nevertheless, for the most accurate representation of the subject matter, readers are encouraged to consult the article in its original language.


| Analysis of population travel to Family Clinics (FC) and Municipal Health Centers (CMS) in the Geographic Regions of the City of Rio de Janeiro Análise do deslocamento da população até as Clínicas da Família (CF) e aos Centros Municipais de Saúde (CMS) nas Regiões Geográficas do Município do Rio de Janeiro Análisis del desplazamiento de la población hacia las Clínicas de la Familia (CF) y los Centros Municipales de Salud (CMS) en las Regiones Geográficas de la Ciudad de Río de Janeiro Fábio da Silva Lima1, Fábia Antunes Zaloti², Gabriel de Oliveira Alves³,
Paulo Márcio Leal de Menezes4 and Manoel do Couto Fernandes5 1 Universidade Federal do Rio de Janeiro, Avenida Athos da Silveira Ramos, 274, Cidade Universitária, Rio de Janeiro/RJ, CEP: 21941-916, ORCID: 0009-0006-2356-5401, fabiolimageo@gmail.com 2 Universidade Federal do Rio de Janeiro, Avenida Athos da Silveira Ramos, 274, Cidade Universitária, Rio de Janeiro/RJ, CEP: 21941-916, ORCID: 0000-0003-1568-4823, fabia.zaloti@gmail.com 3 Universidade Federal do Rio de Janeiro, Avenida Athos da Silveira Ramos, 274, Cidade Universitária, Rio de Janeiro/RJ, CEP: 21941-916, ORCID: 0009-0004-9029-0255, gabrieldeolialves@gmail.com 4 Universidade Federal do Rio de Janeiro, Avenida Athos da Silveira Ramos, 274, Cidade Universitária, Rio de Janeiro/RJ, CEP: 21941-916, ORCID: 0000-0001-7049-7081, pmenezes@acd.ufrj.br 5 Universidade Federal do Rio de Janeiro, Avenida Athos da Silveira Ramos, 274, Cidade Universitária, Rio de Janeiro/RJ, CEP: 21941-916, ORCID: 0000-0002-4500-0624, manoel.fernandes@igeo.ufrj.br
AbstractIn recent decades, Brazil has expanded the use of geospatial data. The 2022 Census began providing address coordinates, thus enabling new spatial analyses. This study examines the average travel distance of the population from private households to Family Clinics (CF) and Municipal Health Centers (CMS), using the Geographic Regions of the City of Rio de Janeiro as the spatial unit of analysis. Values are elevated in the Southwest and West Zones, and reduced in the Central and North Zones. It is concluded that there is an unequal distribution of health facilities, which implies greater displacements in certain regions. Keywords: geospatial data, average travel distance, spatial analysis, family clinics, geographic regions
ResumoNas últimas décadas, o Brasil tem ampliado o uso de dados geoespaciais. O Censo de 2022 passou a disponibilizar coordenadas de endereços, permitindo assim a realização de novas análises espaciais. Esta pesquisa analisa o deslocamento médio da população dos domicílios particulares até as Clínicas da Família (CF) e aos Centros Municipais de Saúde (CMS), tendo como recorte espacial as Regiões Geográficas do Município do Rio de Janeiro. Os resultados apontam que os deslocamentos médios da população foram elevados nas Zonas Sudoeste e Oeste, e reduzidos no Centro e na Zona Norte. Conclui-se que ocorre uma distribuição desigual dos equipamentos de saúde, o que implica maiores deslocamentos em determinadas regiões. Palavras-chave: dados geoespaciais, deslocamento médio, análise espacial, clínicas da família, regiões geográficas
ResumenEn las últimas décadas, Brasil ha ampliado el uso de datos geoespaciales. El Censo de 2022 comenzó a disponibilizar coordenadas de direcciones, lo que permitió nuevos análisis espaciales. Este estudio analiza el desplazamiento promedio de la población desde los domicilios particulares hacia las Clínicas de la Familia (CF) y los Centros Municipales de Salud (CMS), utilizando como recorte espacial las Regiones Geográficas de la Ciudad de Río de Janeiro. Los resultados indican que los desplazamientos promedio de población fueron mayores en las zonas suroeste y oeste, y menores en las zonas central y norte. Se concluye que existe una distribución desigual de los centros de salud, lo que implica mayores desplazamientos en ciertas regiones. Palabras clave: datos geoespaciales, desplazamiento promedio, análisis espacial, clínicas de la familia, regiones geográficas |
1 Introduction
Family Clinics (CF) and Municipal Health Centers (CMS) constitute the primary structure of Primary Health Care (PHC) within the scope of the Unified Health System (SUS), playing an important role in the population's access to health services. These units represent the population's first contact with the health system, through the provision of basic care, continuous follow-up, and referral to other services when necessary (Brasil, 2017; 2021; 2024).
Although PHC is widely recognized as one of the pillars of the SUS, the mere existence of health units is not sufficient to guarantee the population's effective access to services. The spatial distribution of these units in relation to the population's places of residence constitutes a relevant factor for understanding possible territorial inequalities in access to health, especially in municipalities marked by significant socio-spatial differences, such as Rio de Janeiro.
In this context, Barcellos et al. (2008) analyzed the georeferencing of health data in Brazilian municipalities and identified, basically, three problems: difficulties in processing address data by Geographic Information Systems (GIS) referred to in their study as Health Information Systems (SIS), lack of standardization of these data, and the absence of georeferencing strategies (Barcellos et al., 2008).
Subsequently, Borges (2015) highlights the importance of integrating, whenever possible, data from the Demographic Censuses and Geographic Information Systems (GIS), also referred to in their study as Health Information Systems (SIS), emphasizing that this articulation must consider their potentialities and limitations (Borges, 2015).
Given this scenario, the availability of the geodetic coordinates of the CF and CMS, as well as the addresses of private households from the National Register of Addresses for Statistical Purposes (CNEFE) of the Brazilian Institute of Geography and Statistics (IBGE) (2022), expands the possibilities for geospatial analysis by enabling the articulation between data, geodata, information, and geoinformation across different territorial units, as well as allowing the integration of this information in Geographic Information Systems (GIS), providing methodological support for analyzing the spatial distribution of health services and the accessibility of the population to the care network.
Regarding health data, the Municipal Health Department of Rio de Janeiro provides information on the location of the Municipal Health Units, including the geodetic coordinates of the CF and CMS, based on latitude and longitude values referenced to the SIRGAS2000 geodetic reference system (IBGE, 2005; Rio de Janeiro, 2023; 2026).
The georeferenced data of the CF and CMS constitute an important basis for assessing the accessibility of the population to health services, making it possible to analyze the spatial coverage of the care network and the proximity between the population and the available services. Furthermore, these analyses contribute to the identification of possible territorial inequalities in the distribution of services and in access to primary care, providing input for the planning, management, and improvement of public health policies.
Despite the increasing availability of georeferenced data, studies that evaluate, in an integrated manner, the relationship between the location of households and the distribution of primary care units at the municipal scale are still relatively scarce. Understanding this relationship is essential for identifying potentially more vulnerable areas regarding access to health services.
In light of the above, the analysis of the average displacement of the population residing in private households to the nearest primary care unit, especially the CF and CMS, is justified by the need to understand the spatial patterns of access to health services and the existing inequalities between the different regions of the municipality.
This approach is applied to the Geographic Regions of the Municipality of Rio de Janeiro which, following the advent of Complementary Law No. 286, of September 8, 2025, came to comprise the regions of Centro, Zona Norte, Zona Sul, Zona Oeste, and Zona Sudoeste. From this territorial division, it becomes possible to understand the spatial dynamics of access to services, identify gaps in the care network, and support the planning and evaluation of public policies aimed at expanding access to health services (Rio de Janeiro, 2023; 2025; 2026).
2 Theoretical Framework
In the final period of the 20th century and the first decades of the 21st century, new methodologies and theoretical approaches emerged that transformed the concerns of geographers and other researchers, contributing to the redefinition of research objects and the expansion of methods for collecting, storing, and analyzing data, enabling the understanding of the spatial organization of phenomena (Gomez; Jones III, 2010).
In this context, data started to play a fundamental role in the production of geographic knowledge, especially when they are gathered in a structured manner, constituting a database that, when associated with a location on the Earth's surface, such as latitude and longitude coordinates in a geodetic reference system, becomes a georeferenced database. In the literature, this type of structure can also be referred to as a geographic, geospatial, or, more broadly, spatial database (Fitz, 2008; Goodchild, 2010).
The growing availability of spatial data led to the development of new techniques and methods of analysis. Still in the early 2000s, Câmara and Monteiro (2001) already highlighted the emergence of increasingly robust geographic databases, capable of motivating the development of a set of techniques for spatial data analysis.
According to Longley et al. (2013, p.194), geographic databases constitute a critical component of GIS, due to the costs associated with their creation and maintenance, since they represent a fundamental structure for the storage, management, and analysis of complex spatial data (Longley et al., 2005; 2013).
The use, manipulation, and processing of geographic databases increasingly require the adoption of an integrated set of GIS tools, which correspond to a computational infrastructure capable of performing various operations with geographic data. Through these systems, data and information can be converted into geographic information, i.e., geoinformation, enabling their correlation and analysis in problem-solving, from the preparation of inventories of spatially distributed assets to the construction and application of models (Longley et al., 2005; 2013; Fitz, 2008; Goodchild, 2010; Menezes; Fernandes, 2013).
The importance of these tools is directly related to the understanding of the spatial logic of phenomena. Gomes (2017) argues that this logic, when articulated with other fields of knowledge, highlights the relevance of geographic reasoning. According to the author, this reasoning can be synthesized into three domains: the first corresponds to the spatial domain (space and time) defined as "the ability to know how to orient oneself, to build paths between different things in space"; the second refers to the domain of knowledge (knowledge of spatiality) defined as "the development of behaviors" and the understanding of the environment in which we are inserted; and, finally, the third corresponds to the domain of understanding dispersion, associated with the analysis of "the logic of locations" or the logic of the distribution of phenomena (Gomes, 2017).
In this context, Geographic Information Science (GIScience) is inserted, a term introduced by Goodchild (1992, p. 34), which is responsible for integrating researchers from various areas of knowledge interested in this spatial logic, highlighting the importance of geographic reasoning in the production of geographic information, in the development of databases and algorithms, in spatial analysis, and in the modeling of uncertainties in the use of Geographic Information Systems (GIS) (Goodchild, 1992; 2009; 2010).
Among the various procedures developed in this field, density analysis stands out, which corresponds to a spatial analysis technique that identifies and represents the concentration of events or objects in space, producing a continuous surface that highlights areas of greater and lesser intensity of occurrence of a phenomenon (Longley et al., 2013).
Another technique widely used in the cartographic representation of spatial phenomena is the statistical classification of data using the natural breaks method, proposed by Jenks and Caspall (1971). This method consists of identifying the ideal breaking points based on the distribution of the data and the location of their natural groupings, allowing the standardization of class intervals in choropleth maps and a more adequate representation of the existing differences between the analyzed areas.
Based on the works of Jenks and Caspall (1971) and Armstrong et al. (2003), three hypotheses for the use of choropleth maps can be identified. The first refers to the visualization of the distribution of a geographic phenomenon. The second concerns the attribution of specific values to defined spatial units. Finally, the third consists of assigning a gradual color scale to represent different regions, allowing the identification of the concentration or dispersion of a geographic phenomenon.
However, the use of choropleth maps also presents limitations, among which tabular errors stand out, which are problems inherent to the data before their representation on maps; overview errors (or cartographic generalization errors), which occur when reality is excessively simplified or generalized, potentially distorting interpretation; and boundary errors, which are related to the artificial limits of geographic areas (Jenks; Caspall, 1971; Armstrong et al., 2003).
Furthermore, the complexity of these errors makes their treatment in isolation difficult, requiring the adoption of specific evaluation and optimization measures. In this context, the Tabular Accuracy Index (TAI), the Goodness of Variance Fit Measure (GVF), and the Overview Accuracy Index (OAI) stand out, adopted in the study to define the intervals of the choropleth maps (Jenks; Caspall, 1971; Armstrong et al., 2003).
GVF: Goodness of Variance Fit Measure: (índice de ajuste de variância)
 (1)
(1)
TAI: Tabular Accuracy Index: (índice de acurácia tabular)
 (2)
(2)
OAI: Overview Accuracy Index: (índice de acurácia geral)
 (3)
(3)
Where:
 : i=1,…,N are the observed values
 : number of classes
 : is the mean of class j
 : is the number of values in class j
 : i=1,...,N represent the areas of the polygons
 : is indexed by the j=1,…,k classes
 =1,…,Nⱼ polygons belonging to class j.
Source: Armstrong et al. (2003, p. 600)
3 Materials and Methods
This section presents the characterization of the study area and the methodological procedures adopted in the research. Initially, the main characteristics of the municipality of Rio de Janeiro are described, which underlie the understanding of the analyses developed. Subsequently, the methodological steps carried out throughout the study are detailed, covering the processes of obtaining, preparing, manipulating, processing, and editing the data.
It is highlighted that each dataset required specific processing procedures, due to its characteristics and the analytical objectives of the research. These steps were fundamental for the production of the geoinformation used in the study, enabling the spatial and statistical analyses that supported the interpretation and discussion of the results.
3.1 Characterization of the Study Area
The municipality of Rio de Janeiro is located in the Southeast region of Brazil and constitutes the capital of the homonymous state. With an approximate area of 1,200.329 km² (IBGE, 2025), it presents diverse relief, marked by mountainous areas, lowlands, and an extensive coastal strip, characteristics that influence urban occupation and population distribution. Figure 1 presents the study area with the five Geographic Regions of the Municipality of Rio de Janeiro: Centro, Zona Norte, Zona Sul, Zona Oeste, and Zona Sudoeste, denomination established by Complementary Law No. 286, of September 8, 2025 (Rio de Janeiro, 2023; 2025).
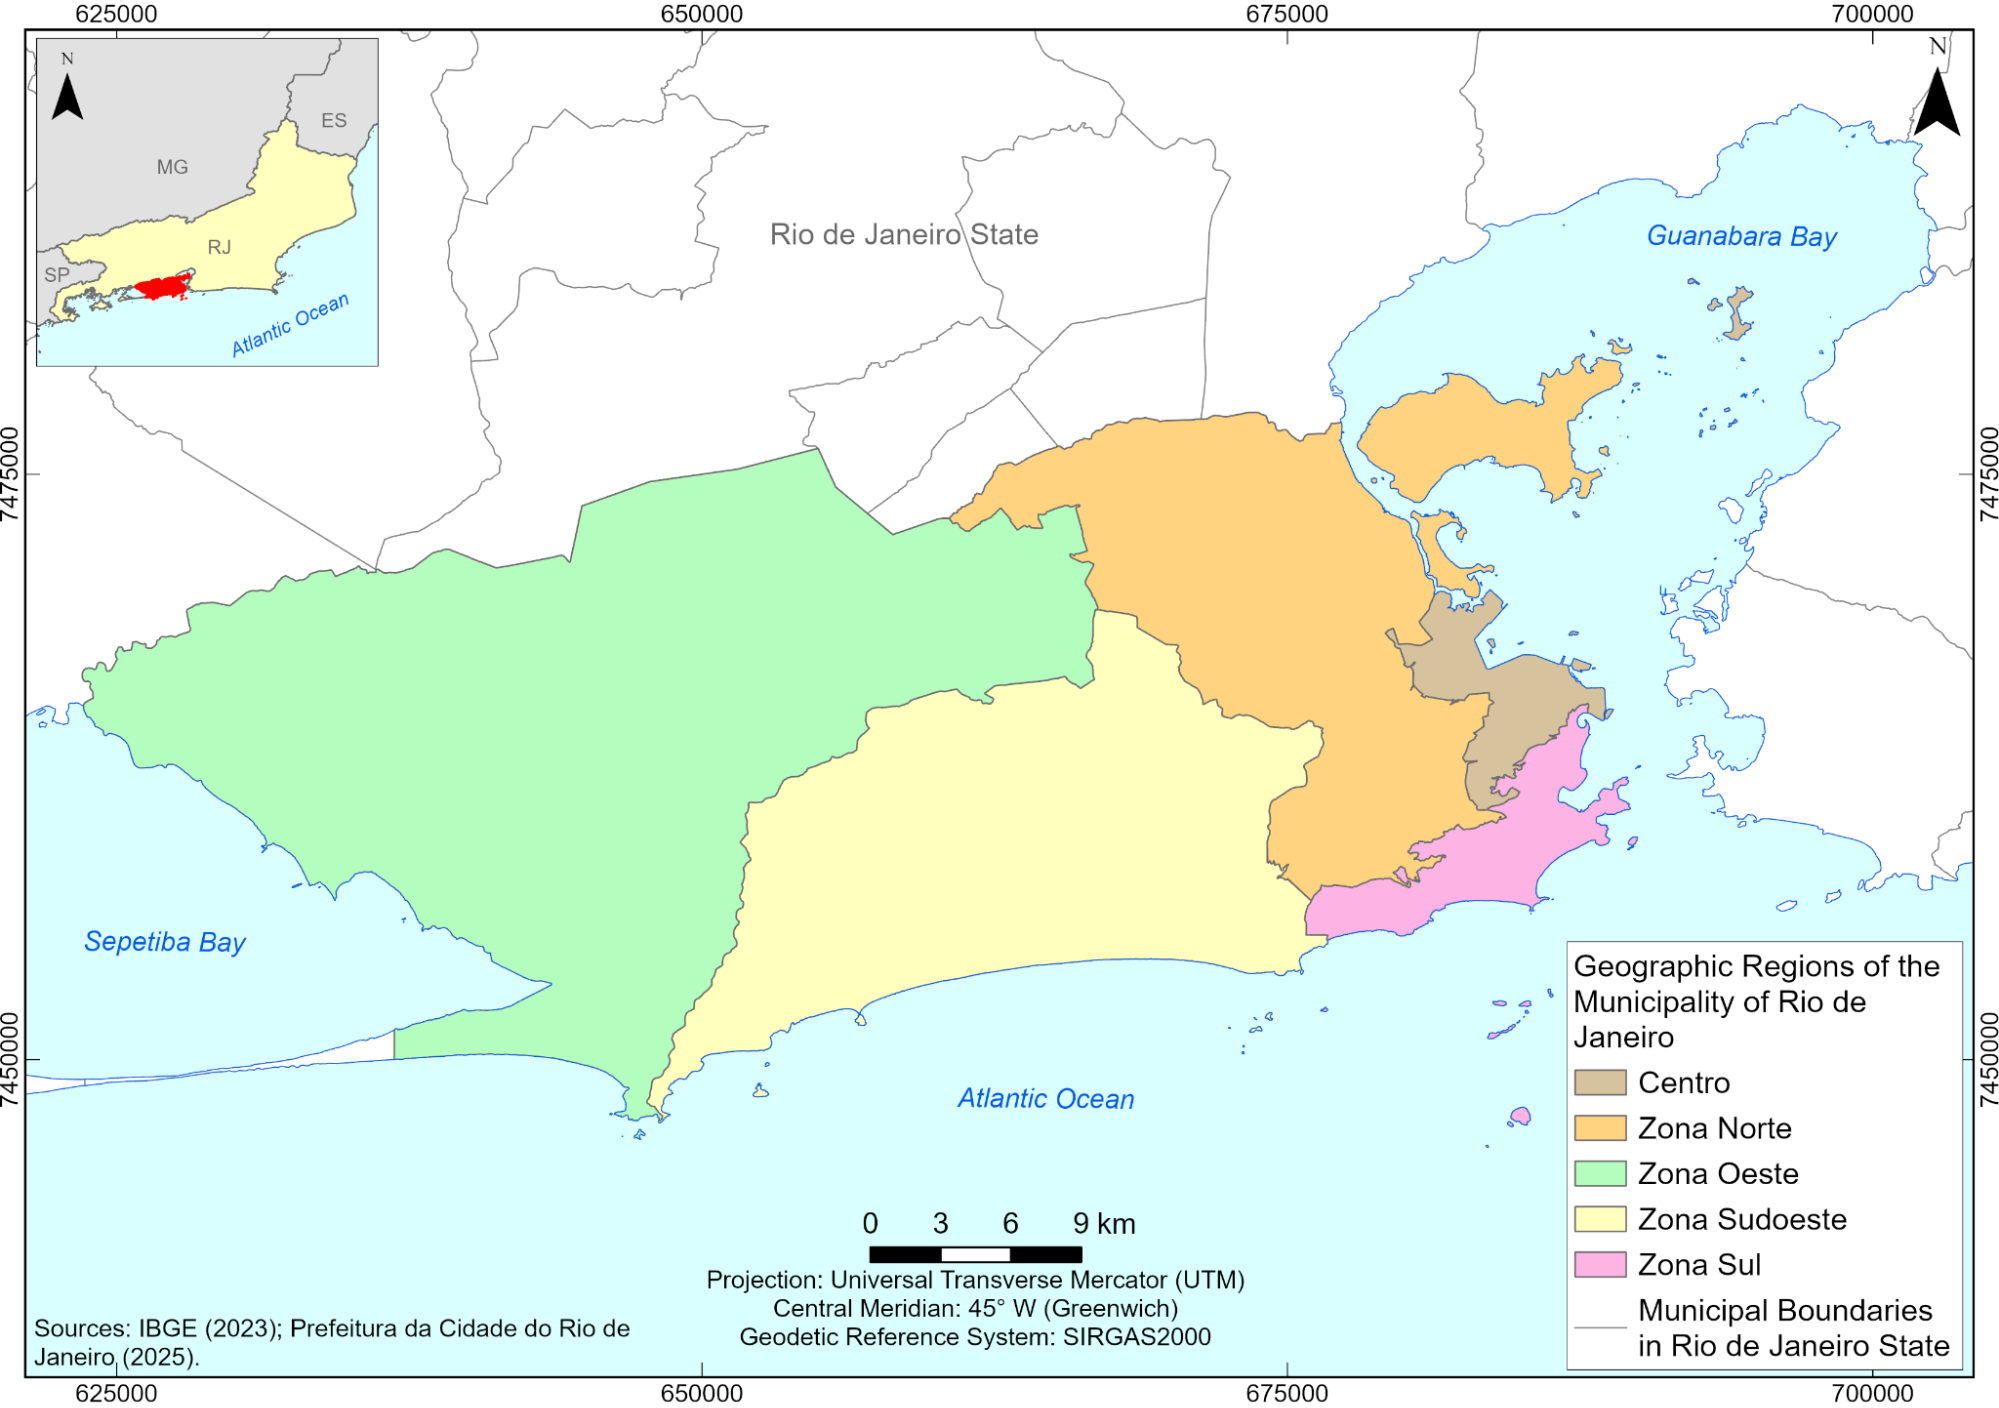
Figure 1: Location of the Geographic Regions of the Municipality of Rio de Janeiro.
Source: The authors, 2026.
The Municipality of Rio de Janeiro is composed of 166 neighborhoods. Table 1 presents the list of neighborhoods that make up each of these geographic regions of the municipality (Rio de Janeiro, 2023; 2025).
Table 1: List of neighborhoods comprising the geographic regions of the Municipality of Rio de Janeiro.
Geographic Regions | Neighborhoods | No. of Neighborhoods |
Zona Sul | Botafogo, Catete, Copacabana, Flamengo, Gávea, Glória, Humaitá, Ipanema, Jardim Botânico, Lagoa, Laranjeiras, Leblon, Leme, Rocinha, São Conrado, Urca e Vidigal
| 17 |
Zona Norte | Abolição, Acari, Água Santa, Alto da Boa Vista, Anchieta, Andaraí, Argentino, Bancários, Barros Filho, Bento Ribeiro, Bonsucesso, Brás de Pina, Cachambi, Cacuia, Campinho, Cascadura, Cavalcanti, Cidade Universitária, Cocotá, Coelho Neto, Colégio, Complexo do Alemão, Cordovil, Costa Barros, Del Castilho, Encantado, Engenheiro Leal, Engenho da Rainha, Engenho de Dentro, Engenho Novo, Freguesia (Ilha do Governador), Galeão, Grajaú, Guadalupe, Higienópolis, Honório Gurgel, Inhaúma, Irajá, Jacaré, Jacarezinho, Jardim América, Jardim Carioca, Jardim Guanabara, Lins de Vasconcelos, Madureira, Manguinhos, Maracanã, Maré, Marechal Hermes, Maria da Graça, Méier, Moneró, Olaria, Osvaldo Cruz, Parada de Lucas, Parque Anchieta, Parque Colúmbia, Pavuna, Penha, Penha Circular, Piedade, Pilares, Pitangueiras, Portuguesa, Praça da Bandeira, Praia da Bandeira, Quintino Bocaiúva, Ramos, Riachuelo, Ribeira, Ricardo de Albuquerque, Rocha, Rocha Miranda, Sampaio, São Francisco Xavier, Tauá, Tijuca, Todos os Santos, Tomás Coelho, Turiaçu, Vaz Lobo, Vicente de Carvalho, Vigário Geral, Vila da Penha, Vila Isabel, Vila Kosmos, Vista Alegre e Zumbi | 89 |
Centro | Benfica, Caju, Catumbi, Centro, Cidade Nova, Estácio, Gamboa, Imperial de São Cristóvão, Lapa, Mangueira, Paquetá, Rio Comprido, Santa Teresa, Santo Cristo, Saúde e Vasco da Gama
| 16 |
Zona Oeste | Bangu, Barra de Guaratiba, Campo dos Afonsos, Campo Grande, Cosmos, Deodoro, Gericinó, Guaratiba, Ilha de Guaratiba, Inhoaíba, Jabour, Jardim Sulacap, Magalhães Bastos, Paciência, Padre Miguel, Pedra de Guaratiba, Realengo, Santa Cruz, Santíssimo, Senador Camará, Senador Vasconcelos, Sepetiba e Vila Militar
| 23 |
Zona Sudoeste | Anil, Barra da Tijuca, Barra Olímpica, Camorim, Cidade de Deus, Curicica, Freguesia (Jacarepaguá), Gardênia Azul, Grumari, Itanhangá, Jacarepaguá, Joá, Praça Seca, Pechincha, Rio das Pedras, Recreio dos Bandeirantes, Tanque, Taquara, Vargem Grande, Vargem Pequena e Vila Valqueire | 21 |
Adapted from: Rio de Janeiro (2025).
The municipality brings together one of the largest population contingents in the country, a reflection of an intense urbanization process throughout its history. The population is unevenly distributed, concentrating mainly in the Zona Norte and Zona Oeste, while the most recent urban expansion areas are located in the Zona Oeste and Zona Sudoeste. The Zona Sul has a smaller population contingent, yet high real estate valuation and high density in coastal areas. The Centro is characterized by the predominance of administrative, legal, political, and economic functions, which results in significant daily circulation of people, despite housing a smaller number of residents compared to other areas of the municipality, as shown in Table 2 (Rio de Janeiro, 2024).
Table 2: Area, population, and demographic density by Geographic Region of the Municipality of Rio de Janeiro
Geographic Region | Area (Km²) | Population (2022) | Demographic density (Inhab/Km²) |
Zona Norte | 258,65 | 2.401.129 | 9.283,03 |
Zona Oeste | 572,04 | 1.840.343 | 3.217,13 |
Zona Sudoeste | 293,78 | 1.105.620 | 3.763,39 |
Zona Sul | 45,26 | 574.858 | 12.699,27 |
Centro | 34,39 | 289.273 | 8.410,32 |
Adapted from: IBGE (2022, 2023) and Rio de Janeiro (2023, 2025).
According to the 2022 Demographic Census, the Municipality of Rio de Janeiro has 6,211,223 inhabitants and a demographic density of 5,174.6 inhabitants per square kilometer, occupying the fourth position among the most densely populated municipalities in the State and the 18th position in the national ranking (IBGE, 2023). According to population estimates, the municipality reached 6,730,729 inhabitants in 2025, which corresponds to an approximate growth of 8.3% compared to the last census (IBGE, 2023; 2025).
The most populous neighborhoods are concentrated predominantly in the Zona Oeste, with emphasis on Campo Grande (352,704 inhabitants), Santa Cruz (249,130), Bangu (211,912), Realengo (165,881), and Guaratiba (154,125). This region concentrates about 38% of Rio's population and has the largest territorial extension of the municipality. In the Zona Sudoeste, Jacarepaguá (175,943), Barra da Tijuca (142,263), and Recreio dos Bandeirantes (141,316) stand out, while in the Zona Norte are Tijuca (142,326), Vila Isabel (65,790), Penha (58,516), Complexo do Alemão (54,202), and Brás de Pina (45,048). The Zona Sul, in turn, presents the highest rates of population density and verticalization, with emphasis on Copacabana (128,919) and Botafogo (77,018) (Rio de Janeiro, 2024).
The city's population growth has historically been associated with industrialization processes, the expansion of the urban network, and the development of transport networks. In recent decades, the advance of occupation towards the Zona Oeste has been observed, driven by the availability of areas for urbanization. This dynamic has resulted in strong socio-spatial contrasts, evidenced by the coexistence of highly valued areas and regions with deficits in infrastructure and urban services (Abreu, 2022).
3.2 Methodological procedures
The methodological stage is based on the application of geoprocessing techniques, with the objective of understanding the displacement patterns of the population towards health services and identifying possible territorial inequalities in access to PHC among the different Geographic Regions of the municipality. The analyses also consider urbanized areas, as they concentrate the main uses of the city, such as housing, commerce, services, industry, public equipment, leisure, and transport, in addition to including vacant areas, favelas, and other elements that make up the urban infrastructure (Rio de Janeiro, 2021). Thus, it is intended to contribute to the understanding of the spatial organization of the public health network and its effects on the population's conditions of access to the services offered.
To achieve this objective, methodological procedures structured in successive and complementary stages were developed. Figure 2 presents the workflow adopted in the article, summarizing the procedures and techniques adopted to carry out this study. The process begins with the acquisition of data and cartographic bases, followed by the stages of preparation, processing, and data treatment, moving on to the geospatial and statistical (or geostatistical) analyses and, finally, reaching the generation of thematic cartographic products.
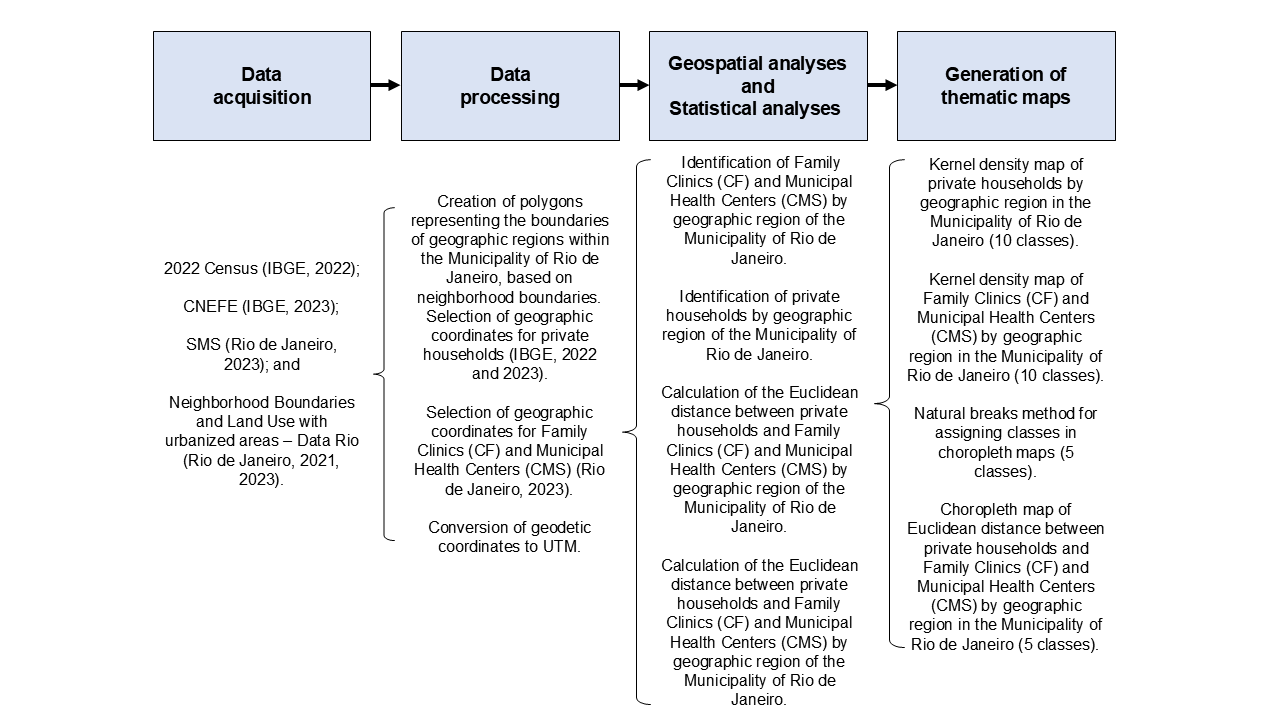
Figure 2: Workflow of the methodological stages of the article.
Source: The authors, 2026.
The first methodological stage of the study consisted of obtaining the geospatial data and the cartographic bases necessary for carrying out the analyses. Initially, the geodetic coordinates of private households from the National Register of Addresses for Statistical Purposes (CNEFE), made available by the Brazilian Institute of Geography and Statistics (IBGE), referring to the year 2022, were obtained. This innovative base gathers georeferenced information of addresses surveyed in the national territory and makes it possible to spatially represent the distribution of private households in the municipality, constituting an important reference for the analysis of proximity to health services (IBGE, 2022).
Regarding the acquisition of location data for health units from the Municipal Health Department of Rio de Janeiro (SMS), which comprises categories such as Family Clinics (CF), Reference Centers (CR), Municipal Health Centers (CMS), Psychosocial Care Centers (CAPS), Teaching Health Centers (CSE), Regional Emergency Centers (CER), Emergency Care Units (UPA), Municipal Hospitals, and Municipal Polyclinics, it was decided to obtain only the geodetic coordinates of the Family Clinics (CF) and the Municipal Health Centers (CMS), since these units represent the main gateway for the population into the Unified Health System (SUS) and constitute the basis of Primary Health Care (PHC). This information allows identifying the location of PHC units and analyzing their spatial distribution in the municipal territory, providing the necessary elements to evaluate the population's conditions of access to the services offered (Rio de Janeiro, 2023; 2025; 2026).
In addition to the data regarding households and health units, the territorial limits of the neighborhoods of the Municipality of Rio de Janeiro for 2025 were obtained, used in the creation of the polygons of the municipal geographic regions. Additionally, the Land Use Mapping of the City of Rio de Janeiro (2019) was incorporated, used to identify and quantify the urbanized areas present in the research spatial scope. The use of these complementary bases allowed contextualizing and quantifying the spatial analyses carried out and adapting them to the characteristics of the municipality's urban occupation (Rio de Janeiro, 2021; 2023; 2025; 2026).
In this sense, this stage gathered the necessary data to spatially represent the population, health services, and the territorial units analyzed, constituting the basis for the data processing and spatial analysis flow.
The next stage consisted of the preparation, treatment, and processing of geospatial data, seeking to enable the articulation between the geodetic coordinates of private households and health units in a Geographic Information System (GIS). For this, geoprocessing tools were used, enabling the execution of geospatial and statistical (or geostatistical) analyses of geographic data. These procedures allowed an integrated analysis, contributing to the planning of the spatial distribution of health units and the identification of places of greater social relevance and greater proximity to the population.
The first stage of data processing consisted of preparing the information regarding neighborhood limits, grouped according to Complementary Law No. 286, of September 8, 2025, to generate the polygons of the geographic regions of the municipality: Centro, Zona Norte, Zona Sul, Zona Oeste, and Zona Sudoeste. This stage also included the grouping of urbanized areas corresponding to each geographic region of the research (Rio de Janeiro, 2021; 2023; 2025), as well as the selection of the geodetic coordinates of private households (IBGE, 2022; 2024) and the geodetic coordinates of the CF and CMS (Rio de Janeiro, 2026).
In this data processing stage, the transformation of the spatial reference system of geospatial data and cartographic bases was carried out in the ArcGIS Pro 3.6 software, initially represented in the geodetic coordinate system (latitude and longitude) associated with the SIRGAS2000 datum, to the UTM (Universal Transverse Mercator) projected coordinate system, preserving the same geodetic reference datum (SIRGAS2000). The adoption of planar Cartesian coordinates made it possible to more adequately represent the spatial relationships analyzed in the research, allowing the calculation of distances between the population and health services and the evaluation of spatial accessibility conditions in the different regions of the municipality.
With the objective of delimiting the area of influence of the CF and CMS, as well as adequately representing the distribution of private households in the different geographic regions of the municipality, the Buffer tool was used in the ArcGIS Pro 3.6 software. Based on tests carried out with different influence distances, it was verified that the radius of 5,000 meters provides the best balance between the spatial coverage of health units and the distribution of private households, proving adequate for the research objectives. This radius was adopted as a parameter for the spatial concentration analysis, carried out using the Kernel density estimation (Silverman, 1986). The application of this method allowed identifying areas with a higher concentration of occurrences (hotspots), represented through heat maps, evidencing spatial distribution trends and patterns.
Subsequently, the Kernel density estimator was applied using the previously defined radius and adopting the limits of the geographic regions as spatial barriers during processing. Thus, the analysis remained restricted to the interior of each region, avoiding interference between neighboring regions and enabling a more consistent representation of the spatial distribution patterns of health units and private households.
For the calculation of average Euclidean (planar) distances, the Near (Proximity) tool was used. The procedure allowed calculating the average distance between private households and the nearest PHC unit, especially the CF and CMS, adopting the planar method and the limits of the geographic regions themselves as spatial barriers, in order to preserve the particularities of each region and provide a more consistent evaluation of spatial accessibility conditions, with the results later used in the calculation of the average distances of each geographic region analyzed.
The thematic cartographic products generation stage involved the classification and cartographic representation of the results obtained in the Kernel density estimation analyses and in the average Euclidean (planar) distance analyses. For both representations, the natural breaks method was adopted, due to its ability to highlight differences between areas with different levels of concentration or accessibility. This method allows grouping similar values and establishing class limits based on the natural breaks observed in the data distribution, favoring the identification of relevant spatial patterns (Nogueira, 2008; Ferreira, 2014).
In the case of the Kernel density estimation, the application of this procedure resulted in the definition of ten density classes, considered the most adequate to represent the spatial variations observed among the five geographic regions analyzed. In addition to the statistical classification, the interpretation of the results was complemented by the visual analysis of the spatial distribution of health unit and household densities, allowing a more comprehensive understanding of the concentration and dispersion patterns observed in the territory.
For the cartographic representation of the average Euclidean (planar) distances, the five Geographic Regions of the Municipality of Rio de Janeiro were considered. The application of the natural breaks method resulted in the definition of five classes, considered the most adequate to represent the spatial variations of the average distances observed among the analyzed regions.
It should be noted that the definition of the intervals and the number of classes of the choropleth maps was carried out based on statistical criteria and quality assessment metrics of the classification, in order to ensure that the cartographic representation adequately reflected the distribution of the data. For this purpose, calculations were performed based on the procedures proposed by Jenks and Caspall (1971) and Armstrong et al. (2003), using the RStudio software, version 2025.05.0 (Posit, 2025).
Finally, after processing the Kernel density estimation and the average Euclidean (planar) distances, thematic choropleth maps were prepared with the objective of representing the spatial concentration patterns of private households, Family Clinics (CF), and Municipal Health Centers (CMS), as well as the variations in average distances observed among the Geographic Regions of the Municipality of Rio de Janeiro. The preparation of the cartographic products was carried out in the ArcGIS Pro 3.6 software (Esri, 2025; Brites et al., 2026).
4 Results
This section presents the results of the analyses carried out on the spatial distribution of private households and primary health care units in the municipality of Rio de Janeiro. Initially, the results related to the distribution of private households are discussed. Next, the location patterns of the Family Clinics (CF) and Municipal Health Centers (CMS) are presented. Subsequently, a comparison is made between the distribution of the population and health units in the different geographic regions of the municipality, allowing the identification of areas with greater or lesser concentration of these elements. Finally, the results of the geospatial and statistical analyses of the Euclidean distances between households and health units are presented, contributing to the understanding of the patterns of geographic accessibility to primary care services.
4.1 Results of the analysis regarding private households
The initial results of the spatial analysis based on the Kernel density estimation enabled the definition of ten classes using the natural breaks method. This classification showed better methodological suitability for representing the spatial distribution of private households in the five Geographic Regions of Rio de Janeiro, considering the estimated number of private households per square kilometer (km²) (Table 3).
Table 3: Definition of class intervals for the Kernel density estimation of private households by Geographic Region of the Municipality of Rio de Janeiro, in the RStudio software.
Definition of class intervals using the natural breaks method | Kernel density estimation of Private Households by Geographic Region of the Municipality of Rio de Janeiro (Km²) |
Class 1 | 0,00 - 378,04 |
Class 2 | 378,04 - 851,47 |
Class 3 | 851,47 - 1316,22 |
Class 4 | 1316,22 - 1826,53 |
Class 5 | 1826,53 - 2397,53 |
Class 6 | 2397,53 - 3068,09 |
Class 7 | 3068,09 - 3891,57 |
Class 8 | 3891,57 - 4805,41 |
Class 9 | 4805,41 - 5695,08 |
Class 10 | 5695,08 - 6781,88 |
Source: The authors, 2026.
Figure 3 presents the Kernel density estimation map of private households by Geographic Regions of the Municipality of Rio de Janeiro, with the respective intervals framed in 10 thematic classes, represented in a color gradient, in which the more saturated hues indicate the areas where these private households are densely clustered. These higher density areas represent the main household hotspots. On the other hand, the less saturated hues indicate locations where households are more dispersed, characterized by greater spacing and, consequently, lower density per square kilometer (km²).
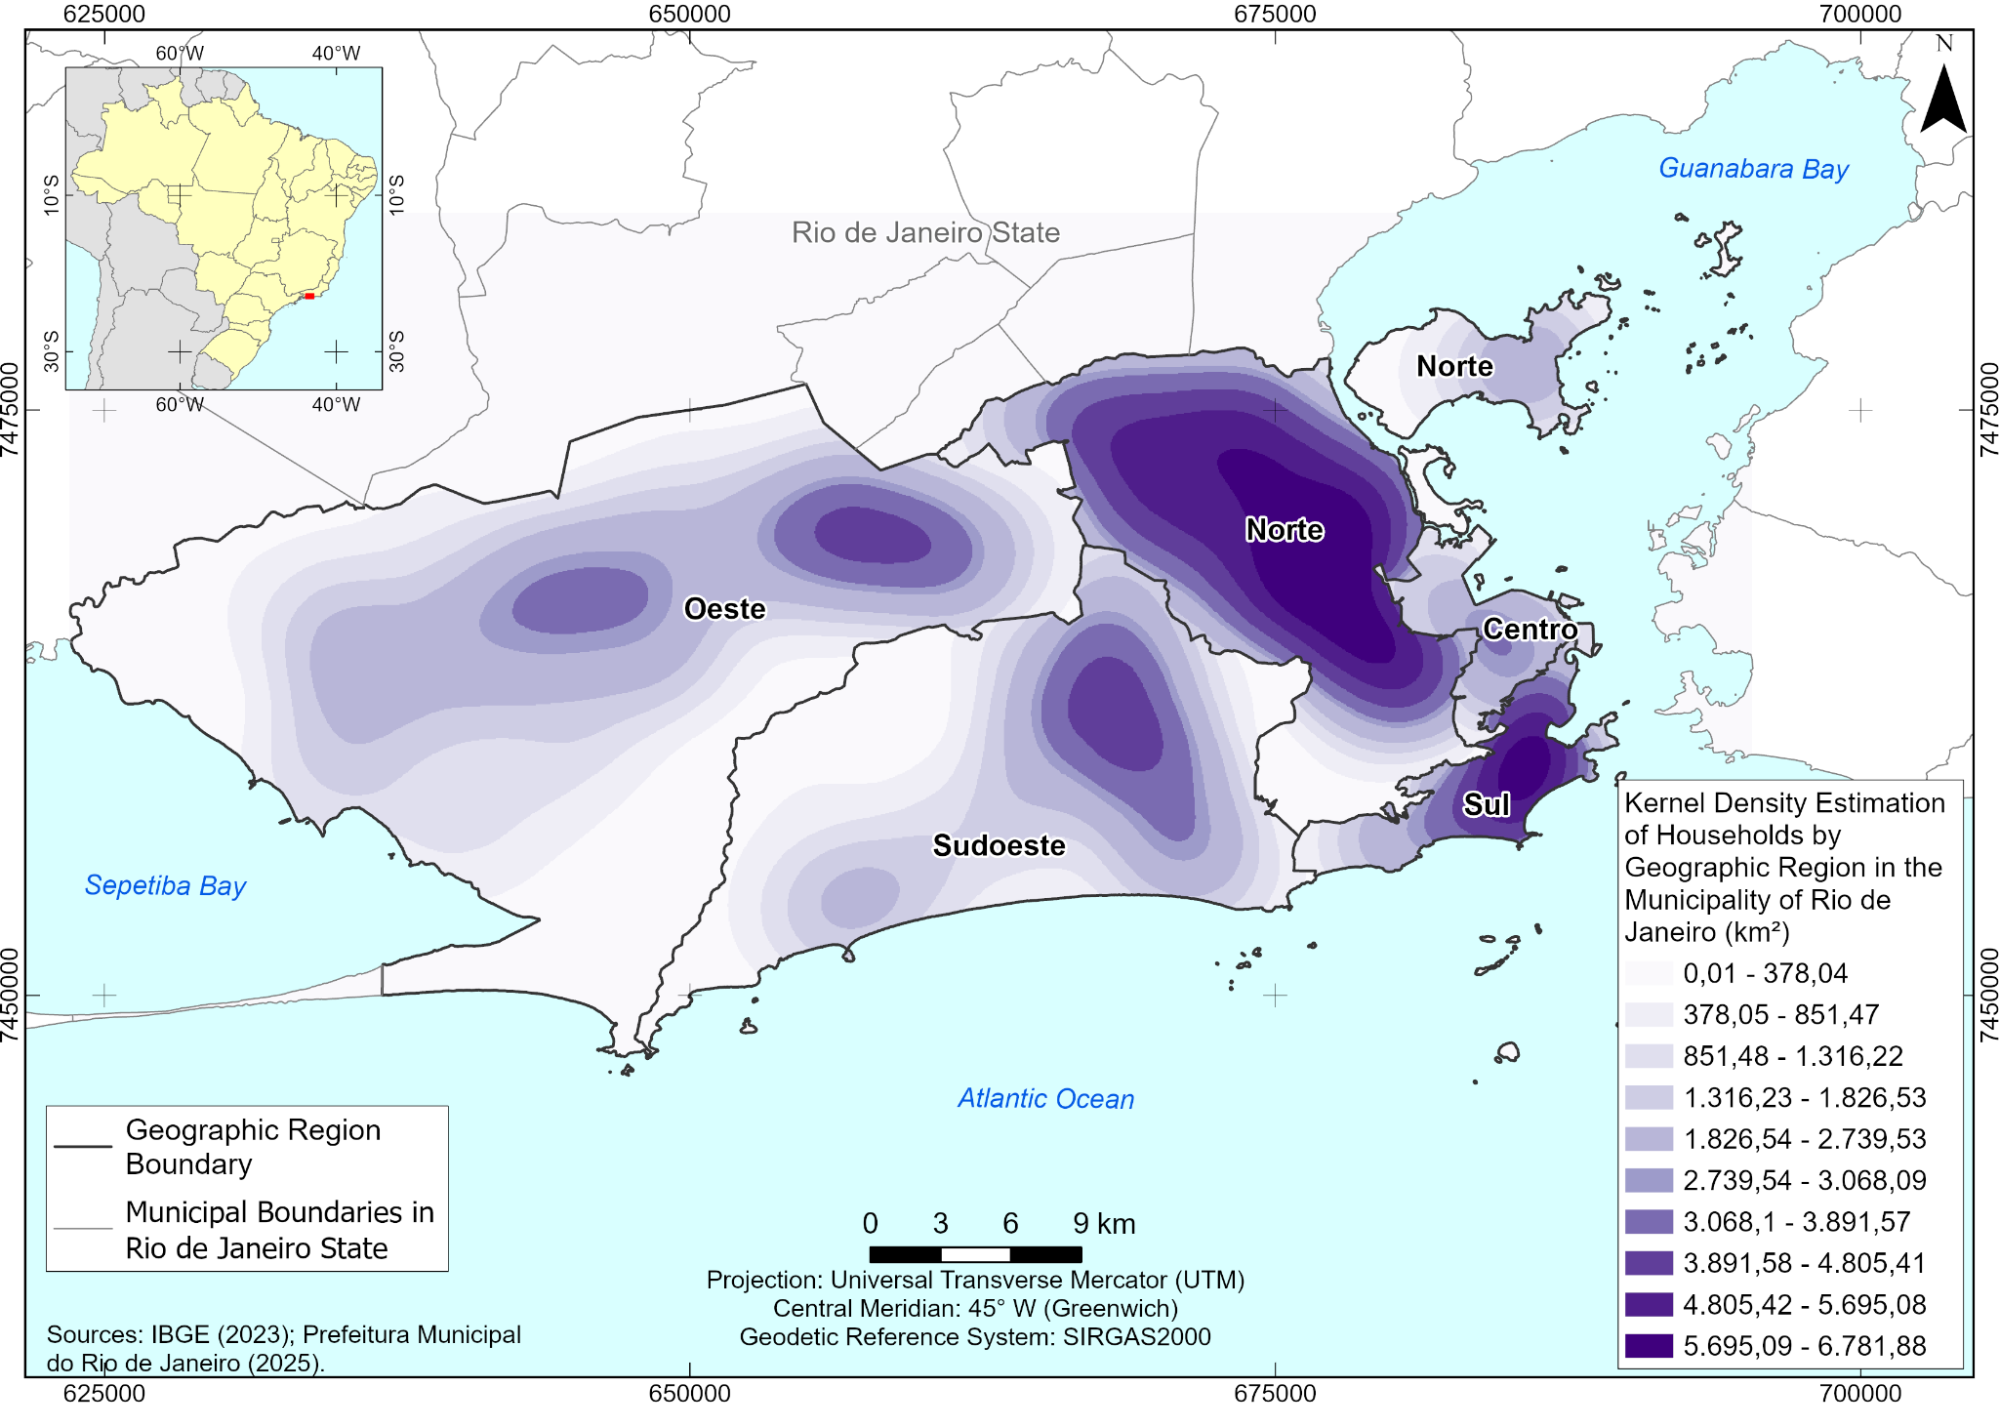
Figure 3: Kernel density estimation map of private households by Geographic Region of the Municipality of Rio de Janeiro.
Source: The authors, 2026.
Still according to Figure 3, in the Zona Sul, the areas of highest occupancy density are concentrated in parts of the neighborhoods of Copacabana and Botafogo, with emphasis on the Favela da Ladeira dos Tabajaras. In the Zona Norte, these areas are distributed across the neighborhoods of Engenho Novo, Méier, Todos os Santos, Cachambi, Pilares, Del Castilho, Inhaúma, Higienópolis, Jacaré and Favela do Jacarezinho, in addition to the Complexo do Alemão. In the Zona Sudoeste, the neighborhoods of Cidade de Deus, Gardênia Azul and Pechincha stand out. In turn, in the Zona Oeste, the highest concentrations of occupation are observed in the neighborhoods of Bangu and Padre Miguel, as well as in areas of Campo Grande, Inhoaíba and Cosmos.
4.2 Results of the analysis regarding Family Clinics (CF) and Municipal Health Centers (CMS)
The initial results of the spatial analysis based on the Kernel density estimation enabled the definition of ten classes using the natural breaks method. This classification showed better suitability for representing the spatial distribution of the CF and CMS in the five Geographic Regions of the Municipality of Rio de Janeiro, considering the estimated number of CF and CMS per square kilometer (km²) (Table 2).
Table 4: Definition of class intervals for the Kernel density estimation of the CF and CMS, by Geographic Region of the Municipality of Rio de Janeiro, in the RStudio software.
Definition of class intervals using the natural breaks method | Kernel density estimation of the CF and CMS by Geographic Region of the Municipality of Rio de Janeiro (Km²) |
Class 1 | 0,00 - 0,03 |
Class 2 | 0,03 - 0,07 |
Class 3 | 0,07 - 0,12 |
Class 4 | 0,12 - 0,18 |
Class 5 | 0,18 - 0,24 |
Class 6 | 0,24 - 0,32 |
Class 7 | 0,32 - 0,39 |
Class 8 | 0,39 - 0,46 |
Class 9 | 0,46 - 0,55 |
Class 10 | 0,55 - 0,66 |
Source: The authors, 2026.
Figure 4 presents the Kernel density estimation map of the CF and CMS by Geographic Regions of the Municipality of Rio de Janeiro, with the respective intervals framed in 10 thematic classes, represented in a color gradient, in which the more saturated hues indicate the areas where these health units are densely clustered; the hotspots represent the main concentration nuclei of the CF and CMS. On the other hand, the less saturated hues indicate areas where these health units are more dispersed, due to greater spatial distance and, consequently, lower density per square kilometer (km²).
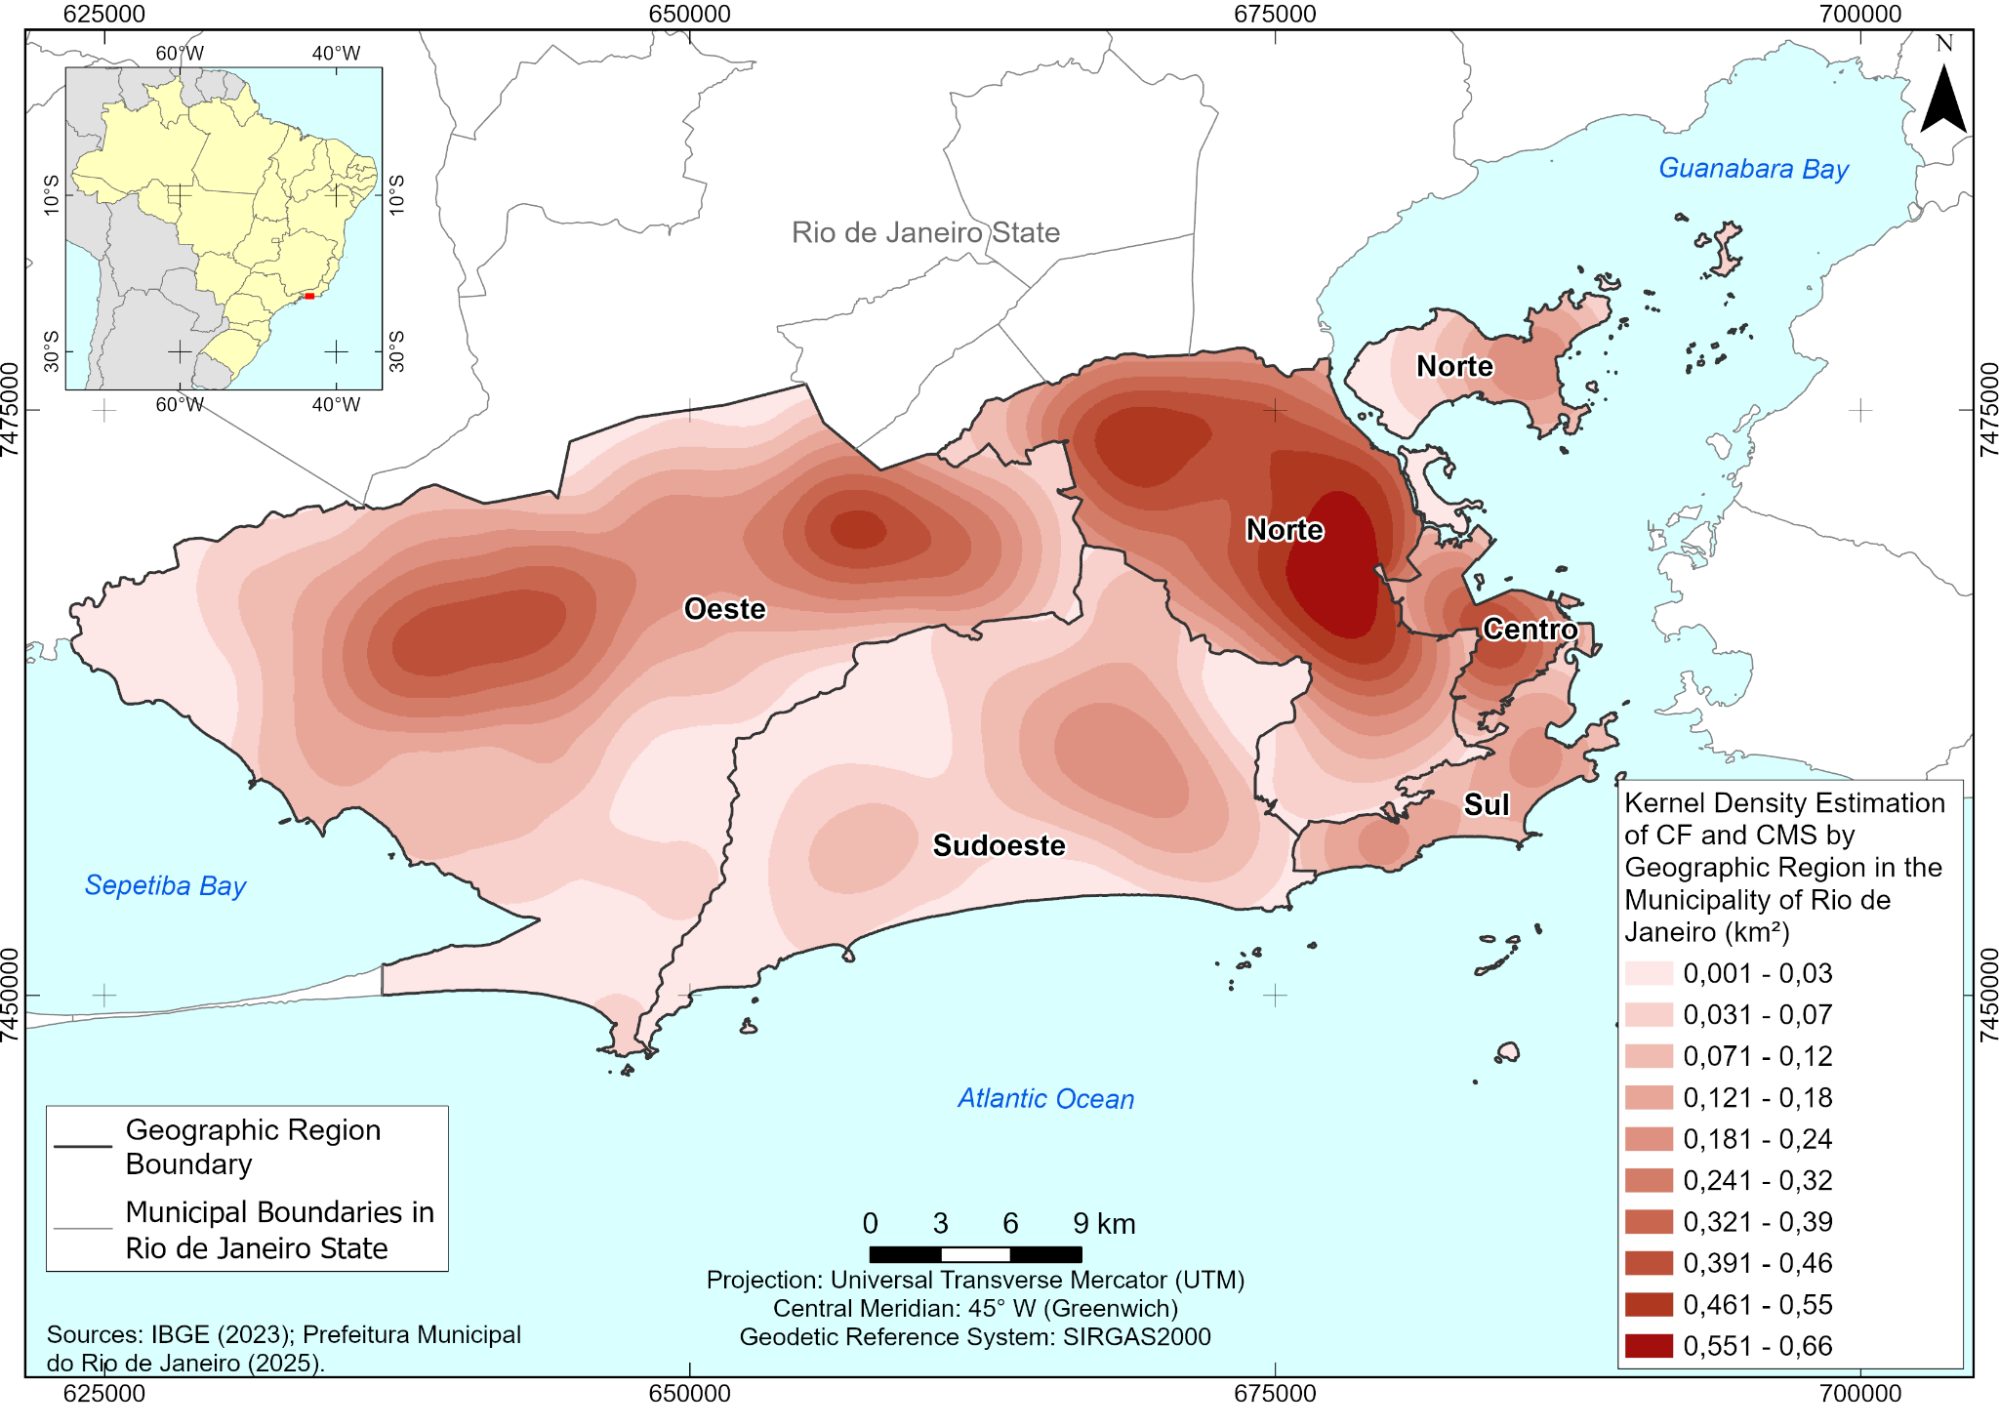
Figure 4: Kernel density estimation map of the CF and CMS by Geographic Region of the Municipality of Rio de Janeiro.
Source: The authors, 2026.
Still according to Figure 4, in the Zona Norte, the highest concentrations of CF and CMS are located in the neighborhoods of Méier, Engenho Novo, Riachuelo, Benfica, Rocha, Mangueira, Cachambi, Todos os Santos, Del Castilho, Inhaúma, Bonsucesso, Manguinhos, Jacaré, Favela do Jacarezinho and Complexo do Alemão. Another prominent area in the same region covers the neighborhoods of Barros Filho, Coelho Neto and Colégio. In the Zona Oeste, a high concentration of CF and CMS is observed in the neighborhoods of Bangu and Padre Miguel, in addition to a less intense concentration in the neighborhoods of Campo Grande, Inhoaíba, Cosmos and Paciência. In the Zona Sudoeste, there is a lower concentration of these health facilities in the neighborhoods of Cidade de Deus, Gardênia Azul and Pechincha. In turn, in the Zona Sul, there are no areas of expressive concentration of CF and CMS, with a more homogeneous distribution of these establishments being observed across the territory.
4.3 Results of the comparison between households and Primary Health Care units (CF and CMS) by Geographic Region
Regarding the comparison between the number of private households and the number of health units in the Geographic Regions of the Municipality of Rio de Janeiro, the results presented in Table 3 reveal important differences in the distribution of these services across the territory. When considering the relationship between the number of Family Clinics (CF), Municipal Health Centers (CMS) and the total number of private households, it is observed that the potential supply of care varies between regions. The Centro, for example, presents the lowest proportion of households per health unit, indicating a greater relative availability of these services. In contrast, the Zona Sul and Zona Sudoeste record the highest proportions of households per unit, suggesting a lower relative supply of health establishments in relation to the number of existing households.
Table 5: Number of CF, CMS and private households, according to the Geographic Regions of the Municipality of Rio de Janeiro (2025) and Land Use (2019).
Geographic Regions | Urbanized Area (km²) | No. of CF | No. of CMS | No. of private households (IBGE) | No. of households served by each CF or CMS |
Zona Sul | 25,29 | 4 | 9 | 326.362 | 25105 |
Zona Norte | 191,72 | 56 | 44 | 1.130.933 | 11309 |
Centro | 28,75 | 8 | 11 | 139.531 | 7344 |
Zona Oeste | 243,65 | 50 | 38 | 802.431 | 9119 |
Zona Sudoeste | 118,11 | 11 | 10 | 519.054 | 24717 |
Source: The authors, 2026.
The regions also present significant differences in their urbanized areas, an aspect that influences the distribution and access to health services. The Zona Oeste, even after the dismemberment of the Zona Sudoeste in 2025, has the largest urbanized area, 243.65 km², with 50 CF, 38 CMS and 802,431 private households. Next, the Zona Sudoeste has an urbanized area of 118.11 km², 11 CF, 10 CMS and 519,054 private households. The Zona Norte, with an urbanized area of 191.72 km², concentrates the largest number of health units, totaling 56 CF and 44 CMS, in addition to 1,130,933 private households. The Centro has the second smallest area of 25.29 km², with 8 CF, 11 CMS and 139,531 private households. Finally, the Zona Sul has the second smallest urbanized area, of 28.75 km², with 4 CF, 9 CMS and 326,362 private households.
Given this scenario, the proximity indices were defined based on the delimitation of class intervals of the Kernel density estimation of private households, as well as of the CF and CMS, by geographic region, using the natural breaks method.
From this perspective, the definition of intervals and the number of classes through the Kernel density estimation makes it possible to standardize the analysis and identify the areas with the highest concentrations of CF, CMS and private households, by geographic region. This procedure contributes to a greater understanding of the observed spatial patterns (Tables 4 and 5 and Figures 3 and 4).
4.4 Results of the distance analysis between private households and health units (CF and CMS)
The initial results of the geospatial and statistical (or geostatistical) analysis of the minimum Euclidean distances, in meters, between private households and the CF and CMS, using the Geographic Regions of the Municipality of Rio de Janeiro as the spatial scope, demonstrate that the Zona Sudoeste presented the worst access indicators, with the highest average distance of 1,336.02 meters, the highest maximum value of 7,192.35 meters and the highest standard deviation of 854.99 meters, which highlights a high heterogeneity, that is, a need for displacement over long distances in the Zona Sudoeste.
On the other hand, the Centro presented the best access indicators, with the lowest average distance of 573.70 meters and the lowest standard deviation of 347.51 meters, followed by the Zona Norte, with an average distance of 632.30 meters and a standard deviation of 348.21 meters, which highlights a greater homogeneity, that is, greater average proximity to health services in the Centro and Zona Norte.
Figure 5 presents a comparative analysis of Euclidean distances (in meters) by Geographic Region of the Municipality of Rio de Janeiro, including the minimum, maximum, average and standard deviation values; due to the wide variation between values, the data are represented on a logarithmic scale. The joint analysis of these measures allows the distribution of distances and spatial inequalities in access to health services, with closer values indicating homogeneity, while greater differences between the minimum and maximum values reveal greater heterogeneity.
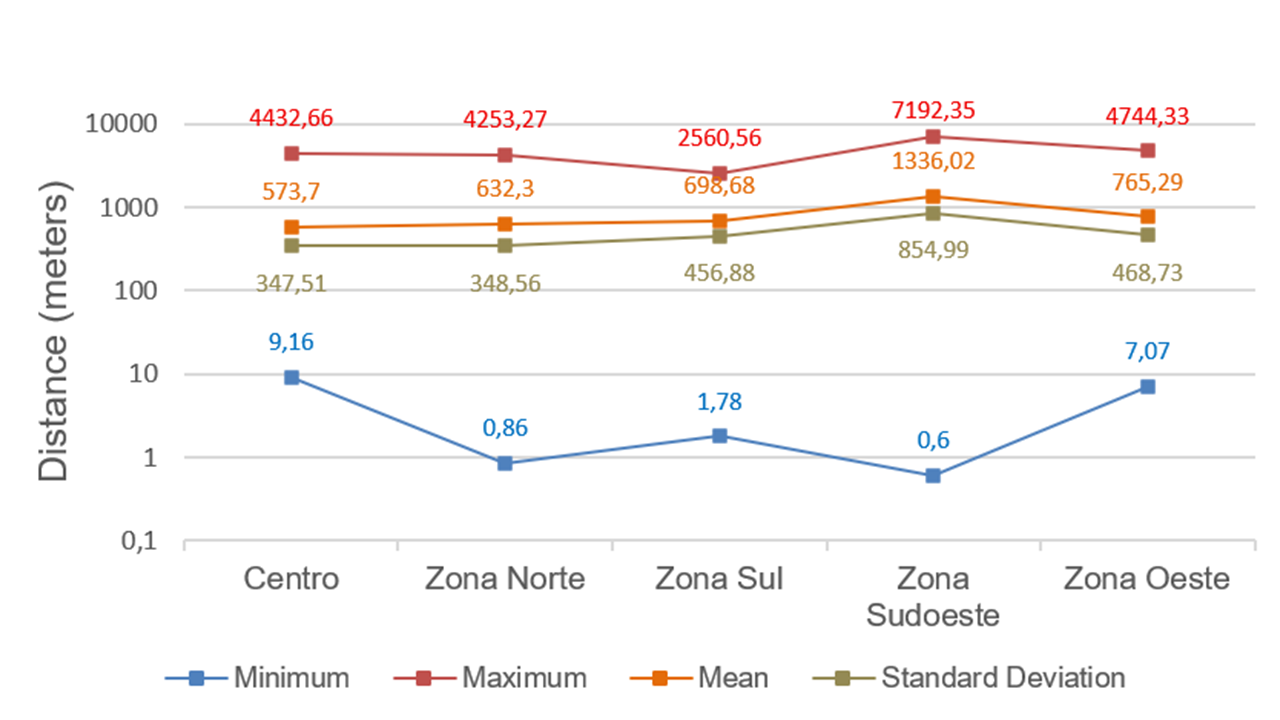
Figure 5: Graph of minimum, maximum, average and standard deviation distances (in meters), by Geographic Region of the Municipality of Rio de Janeiro.
Source: The authors, 2026.
It is observed that the Zona Sudoeste presents the largest range of distance variation, indicating greater heterogeneity in displacements. In contrast, the Centro and Zona Norte present smaller amplitude and less dispersion around the mean, evidencing greater spatial homogeneity and better conditions of access to health services.
The analysis of the average Euclidean distances (in meters), between private households and the CF and CMS, by geographic region, with the definition of the proximity index intervals using the natural breaks method, allowed the classification into five classes (Table 6).
It should be noted that the definition of intervals using the proximity index, based on average Euclidean distances, makes it possible to standardize the analysis and identify the areas that require greater or lesser displacement between private households and the CF and CMS, by geographic region. This procedure also contributes to a better understanding of spatial patterns (Table 6 and Figure 6).
Table 6: Definition of class intervals for the proximity index (average Euclidean distances) of displacement between Private Households and the CF and CMS by Geographic Region of the Municipality of Rio de Janeiro.
Intervals | Distances (m) to the CF and CMS |
Class 1 | 573 |
Class 2 | 632 |
Class 3 | 698 |
Class 4 | 765 |
Class 5 | 1336 |
Source: The authors, 2026.
Figure 6 shows that the Geographic Region of the Municipality of Rio de Janeiro with the greatest need for displacement, between private households and the CF and CMS, is the Zona Sudoeste (Class 5), with an average distance of 1,336 meters, followed by the Zona Oeste (Class 4), with displacements of 765 meters, the Zona Sul (Class 3), with a value of 698 meters, and the Zona Norte (Class 2), with an average distance of 632 meters. In turn, the Centro (Class 1) was the region that presented the lowest average displacement between private households and the CF and CMS, with an average displacement of 573 meters.
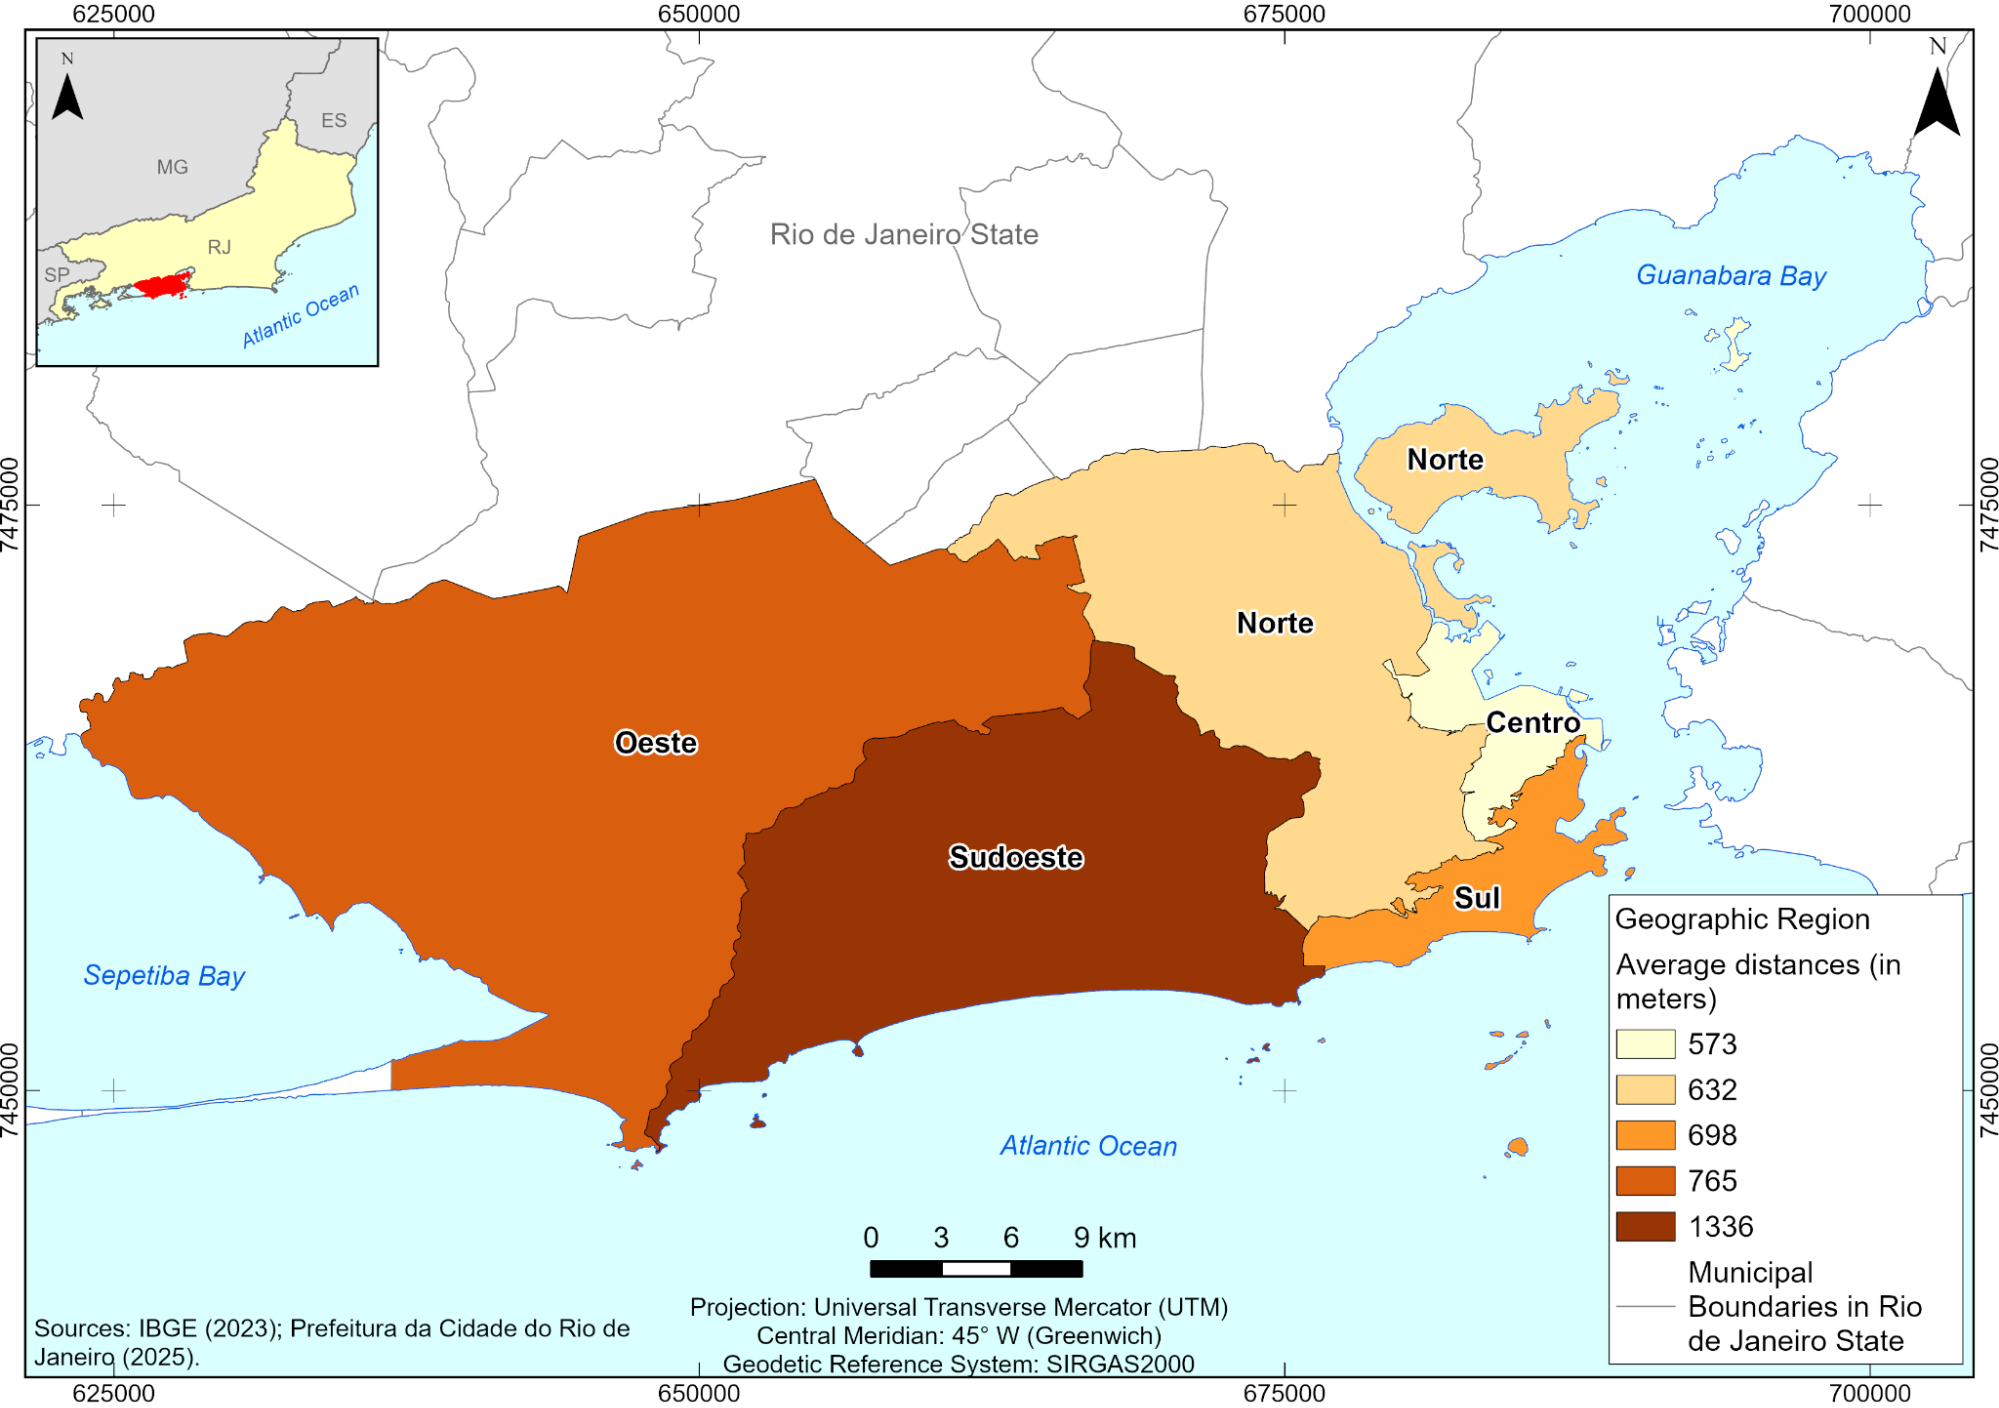
Figure 6: Choropleth Map of average Euclidean distances (in meters) between private households and the CF and CMS, by Geographic Region of the Municipality of Rio de Janeiro.
Source: The authors, 2026.
The use of histograms makes it possible to identify important characteristics that are not easily perceived through summary statistical measures, constituting a fundamental tool to complement the exploratory analysis of the data. While the mean summarizes the distribution in a single value, histograms allow visualizing patterns, concentrations and variations, offering a more complete understanding of the data behavior.
Thus, after the stages of preparation, manipulation, processing and editing of the data, geoinformation was generated that supported the analyses, evidencing that the use of the mean associated with histograms complements the interpretation of the results obtained.
Figure 7 presents the distribution of distances by Geographic Region of the Municipality of Rio de Janeiro through histograms, allowing the analysis of data behavior in terms of frequency and distribution shape. This representation makes it possible to identify patterns of concentration, dispersion, symmetry and asymmetry that are not captured by descriptive statistics, contributing to a more comprehensive understanding of the data.
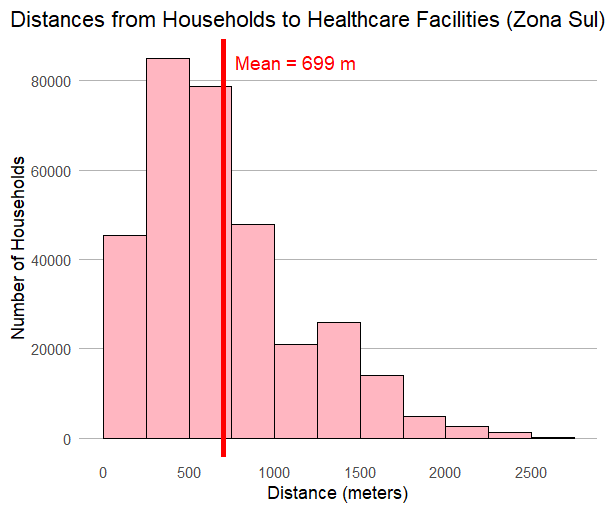
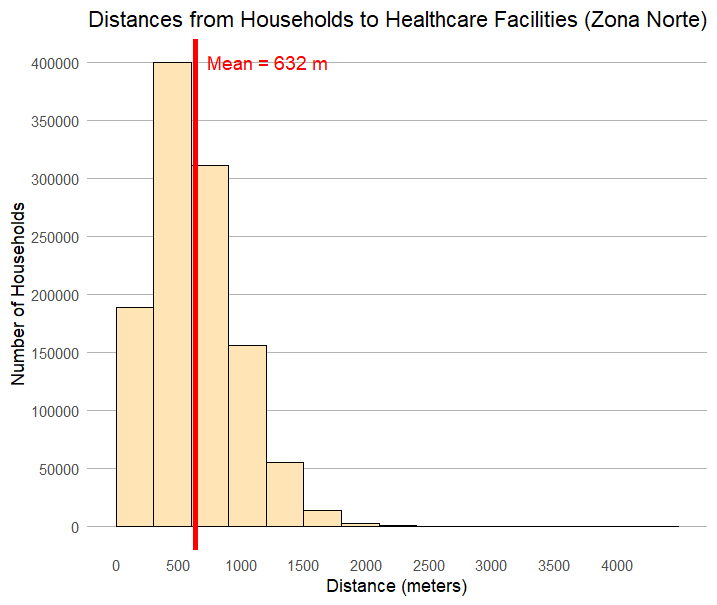
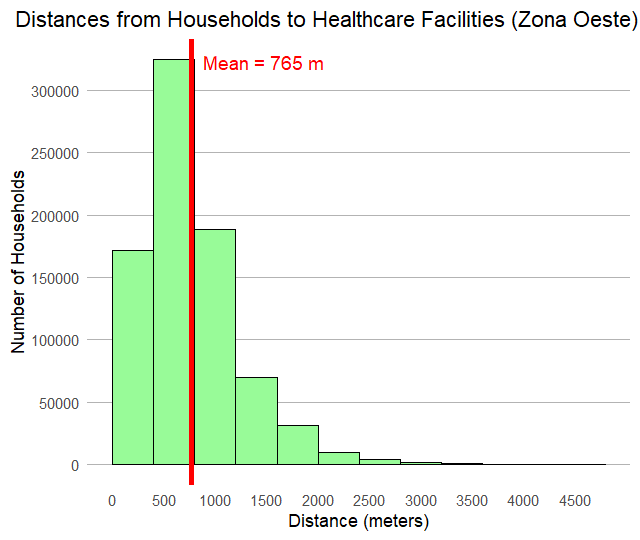
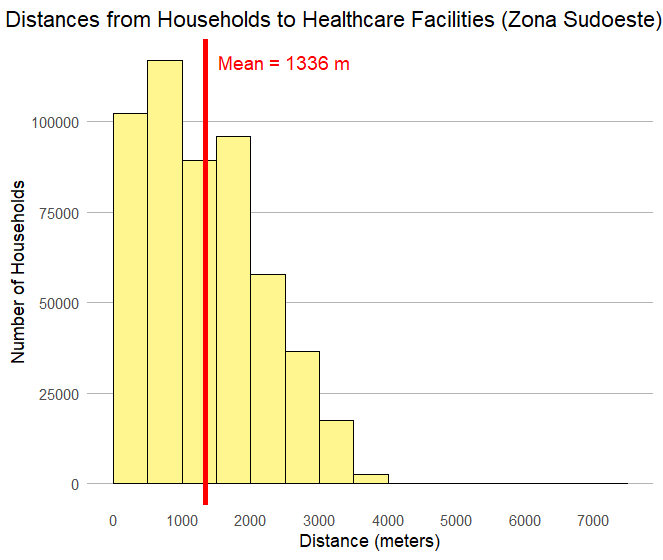
Figure 7: Histograms of distance values by geographic region, using the RStudio software, version 2025.05.0.
Source: The authors, 2026.
The analysis of the distance histograms by geographic region allows a more detailed understanding of how the values are distributed in each studied area. It is observed that, in the Zona Sudoeste, most observations are concentrated in distance classes above the mean, while in the Zona Sul and Centro the concentration occurs predominantly in classes close to the minimum values.
Furthermore, the Zona Norte, Zona Oeste and Centro present more balanced distributions, with a relatively symmetrical shape, suggesting a more homogeneous distribution of the observed distances. In contrast, the Zona Sudoeste presents asymmetric distributions, evidencing a greater concentration of values in certain distance ranges and less uniformity in the data distribution.
Histograms play an important role in exploratory data analysis, as they allow visualizing characteristics of the distribution that are not always perceived through summary statistical measures. By observing the shape of the distribution and its asymmetry, it is possible to better understand how displacements are distributed, identifying the predominance of shorter paths, as occurs in the Zona Sul, or longer ones, as occurs in the Zona Sudoeste.
The results of this study show that the distribution of Family Clinics and Municipal Health Centers in the municipality of Rio de Janeiro does not occur homogeneously among the different geographic regions. The analysis of the Kernel densities of private households and health units allowed identifying how the supply of these services relates to the distribution of the population in the territory. In general, a relatively well-distributed network is observed in a large part of the municipality.
However, the Zona Sudoeste stands out for the lower concentration of primary care units, despite presenting areas with significant population concentration. This result suggests the existence of portions of the territory where the population may face greater difficulties in accessing health services, evidencing the relevance of spatial analysis to support the planning of the care network.
Furthermore, the evaluation of average distances between households and health units, together with the analysis of their distribution through histograms, made it possible to better understand the proximity patterns between the population and primary care services. These analyses allowed identifying regional differences and complementing the information obtained by descriptive measures, offering a more detailed view of spatial accessibility.
Finally, it is important to highlight that the distances analyzed represent an approximation of geographic accessibility. Thus, the results express the potential proximity between households and health units, not necessarily reflecting the routes taken by the road network nor other factors that may influence the actual conditions of population displacement.
5 Conclusions
The distribution of Primary Health Care (PHC) units, especially the Family Clinics (CF) and Municipal Health Centers (CMS), in the municipality presents, in general, a relatively balanced spatial coverage, although with important differences between the Geographic Regions, since these units represent the main gateway for the population into the Unified Health System (SUS).
The distribution of the areas of highest occupancy density and of the PHC units in the municipality reveals partially coincident spatial patterns. In the Zona Norte, a strong correspondence is observed between population density and concentration of health units, especially in neighborhoods such as Méier, Engenho Novo, Cachambi, Inhaúma and the Complexo do Alemão. In the Zona Oeste, this relationship is also present, although in a less homogeneous manner, with emphasis on Bangu and Padre Miguel.
On the other hand, the Zona Sudoeste presents areas of high population density, such as Cidade de Deus, Gardênia Azul and Pechincha, with a low concentration of health services, indicating a possible gap in supply. In the Zona Sul, despite the presence of dense areas in Copacabana and Botafogo, the distribution of CF and CMS is more dispersed, without expressive concentration in the same points. Thus, the relationship between occupancy density and service supply is not uniform in the municipality, being more evident in the Zona Norte and Zona Oeste and less consistent in the Zona Sul and Zona Sudoeste.
The analysis of distances between households and health units, associated with statistical measures and histograms, allowed a more detailed understanding of the spatial accessibility patterns in the municipality, in addition to enabling the identification of relevant regional differences. This approach complements the interpretation of the results and highlights the potential of geospatial analysis as a tool to support the planning and management of PHC.
Finally, it is worth noting that the distances evaluated were calculated in a straight line, representing an estimate of the geographic proximity between the population and health services. Although this methodology does not consider the road network, displacement conditions or other factors that influence effective access to services, the results obtained provide important input for the identification of areas that may require greater attention in the planning of the care network. Thus, the study contributes to the understanding of the territorial distribution of primary care services and offers relevant information for a more balanced organization of the health network in the municipality.
The application of geoprocessing techniques proved to be essential for the planning of health facilities, by integrating geospatial data from different sources. The use of Kernel density allowed the identification of areas with higher concentration of households and the distribution of health units in the municipality of Rio de Janeiro.
In this context, spatial analysis constitutes a decision-making support instrument, capable of contributing to the optimization of resource allocation, the reduction of territorial inequalities, and the improvement of public health planning.
References
ABREU, Maurício de Almeida. Evolução urbana do Rio de Janeiro. 5. ed. Rio de Janeiro: Publicações Pereira Passos, 2022.
ARMSTRONG, Marc P; XIAO, Ningchuan; BENNETT, David A. Using genetic algorithms to create multicriteria class intervals for choropleth maps. Annals of the Association of American Geographers, n. 93, v. 3, p. 595–623, 2003. Available at: https://www.tandfonline.com/doi/abs/10.1111/1467-8306.9303005. Access in: 29 apr. 2026.
BARCELLOS, Christovam; RAMALHO, Walter Massa; GRACIE, Renata; FONTES, Márcia Pereira; SKABA, Daniel. Georreferenciamento de dados de saúde na escala submunicipal: algumas experiências no Brasil. Epidemiol. Serv. Saúde, Brasília, v. 17, n. 1, p. 59–70, 2008. DOI: 10.5123/S1679-49742008000100006. Available at: https://www.repositorio.unb.br/bitstream/10482/11481/1/ARTIGO_GeorreferenciamentoDadosSaude.PDF. Access in: 29 apr. 2026.
BORGES, Gabriel Mendes. A investigação da saúde nos censos demográficos do Brasil: possibilidades de análise, vantagens e limitações. Boletim do Instituto de Saúde, v. 16, n. 2, p. 6–14, 2015. DOI: https://doi.org/10.52753/bis.v16i2.35588. Available at: https://periodicos.saude.sp.gov.br/bis/article/view/35588. Access in: 28 mar. 2026.
BRASIL. Ministério da Saúde. Portaria de Consolidação nº 2, de 28 de setembro de 2017. Consolidação das normas sobre as políticas nacionais de saúde do Sistema Único de Saúde (SUS). Brasília, DF: Ministério da Saúde, 2017. Available at: https://bvsms.saude.gov.br/bvs/saudelegis/gm/2017/prc0002_03_10_2017.html. Access in: 3 jun. 2026.
BRASIL. Ministério da Saúde. Portaria de Consolidação nº 1, de 2 de junho de 2021. Consolidação das normas sobre Atenção Primária à Saúde. Brasília, DF: Ministério da Saúde, 2021. Available at: https://www.in.gov.br/en/web/dou/-/portaria-de-consolidacao-n-1-de-2-de-junho-de-2021-324136445. Access in: 3 jun. 2026.
BRASIL. Ministério da Saúde. Portaria GM/MS nº 3.493, de 10 de abril de 2024. Altera a Portaria de Consolidação GM/MS nº 6, de 28 de setembro de 2017, para instituir nova metodologia de cofinanciamento federal do Piso de Atenção Primária à Saúde no âmbito do Sistema Único de Saúde (SUS). Brasília, DF: Ministério da Saúde, 2024. Available at: https://bvsms.saude.gov.br/bvs/saudelegis/gm/2024/prt3493_11_04_2024.html. Access in: 3 jun. 2026.
BRITES, P. M. et al.. Mapeando o Brasil: Aquisição, processamento e representação de dados e informações espaciais em plataformas SIG. 1ª ed. Rio de Janeiro: IVIDES, 2026. 286 p. ISBN: 9786598567651, DOI: 10.5281/zenodo. 19441044.
CÂMARA, G.; MONTEIRO, A. M. V. Geocomputation techniques for spatial analysis: are they relevant to health data?. Caderno de Saúde Pública, v. 17, n. 5. Rio de Janeiro, 2001. Available at: https://www.scielo.br/j/csp/a/8mh3J5rVXD4BxnGcYDxjVxR/?format=pdf&lang=en. Access in: 08 oct. 2025
ESRI. ArcGIS Pro: Geographic information system software. Programa de computador. Licenciamento Corporativo Educacional. Rio de Janeiro, 2025. Available at: https://ufrj-academico.maps.arcgis.com/. Access in: 15 oct. 2025
FITZ, Paulo Roberto. Geoprocessamento sem complicação. São Paulo: Oficina dos Textos, 2008. 160 p. ISBN: 978-85-86238-82-6.
FERREIRA, Marcos César. Iniciação à análise geoespacial: teoria, técnicas e exemplos para geoprocessamento. São Paulo: Editora UNESP, 2014.
GOMES, P. C. C. O conceito de região e sua discussão. In: CASTRO, Iná Elias De; GOMES, Paulo Cesar da Costa; CORRÊA, Roberto Lobato (org.). Geografia: Conceitos e Temas. 2ª ed. Rio de Janeiro: Bertrand Brasil, 2000. p. 49–76. ISBN: 85-286-0545-0.
GOMES, Paulo Cesar da Costa. Quadros geográficos: uma forma de ver, uma forma de pensar. 1ª ed. Rio de Janeiro: Bertrand Brasil, 2017. 158 p. ISBN: 978-85-286-2245-4.
GOMEZ, Basil; JONES III, John Paul. Research methods in geography. 1ª ed. Oxford: Blackwell Publishing., 2010. 459 p. ISBN: 978-1-4051-0710-5.
GOODCHILD, Michael F. Geographical information science. International Journal of Geographical Information Systems, v. 6, n. 1, p. 31–5, 1992. Available at: https://dusk.geo.oregonstate.edu/virtual/goodchild1992.pdf. Access in: 29 apr. 2026
GOODCHILD, Michael F. Geographic information systems and science: Today and tomorrow. Annals of GIS, v. 15, n. 1, p. 3–9, 2009. ISSN: 19475691, DOI: 10.1080/19475680903250715. Available at: https://www.tandfonline.com/doi/epdf/10.1080/19475680903250715?needAccess=true. Access in: 29 apr. 2026
GOODCHILD, Michael F. Geographic information systems. In: GOMEZ, Basil; JONES III, John Paul (orgs.). Research Methods in Geography. Oxford: Blackwell Publishing., 2010. p. 376–391. ISBN: 978-1-4051-0710-5.
IBGE, Instituto Brasileiro de Geografia e Estatística. Resolução do Presidente da Fundação Instituto Brasileiro de Geografia e Estatística, IBGE. Nº. 1, de 25 de fevereiro de 2005. Altera a caracterização do Sistema Geodésico Brasileiro. 2005. Available at: https://geoftp.ibge.gov.br/metodos_e_outros_documentos_de_referencia/normas/rpr_01_25fev2005.pdf. Access in: 29 jul. 2025
IBGE, Instituto Brasileiro de Geografia e Estatística. Padrão de registro de endereços. Definições e orientações de uso. Rio de Janeiro: 2019. Available at: https://biblioteca.ibge.gov.br/visualizacao/livros/liv101639.pdf. Access in: 29 mar. 2026
IBGE, Instituto Brasileiro de Geografia e Estatística. Cadastro Nacional de Endereços para Fins Estatísticos - CNEFE. 2022. Available at: https://www.ibge.gov.br/estatisticas/sociais/populacao/38734-cadastro-nacional-de-enderecos-para-fins-estatisticos.html?=&t=downloads. Access in: 29 mar. 2026
IBGE, Instituto Brasileiro de Geografia e Estatística. Censo Demográfico 2022 Coordenadas Geográficas dos Endereços. Nota metodológica Nº. 1. Rio de Janeiro: Instituto Brasileiro de Geografia e Estatística - IBGE, 2024. 26 p. Available at: https://biblioteca.ibge.gov.br/index.php/biblioteca-catalogo?view=detalhes&id=2102063. Access in: 29 apr. 2026
IBGE, Instituto Brasileiro de Geografia e Estatística. Censo demográfico 2022: população e domicílios: primeiros resultados. Rio de Janeiro: IBGE, 2023. Available at: https://www.ibge.gov.br/estatisticas/sociais/populacao/22827-censo-demografico-2022.html. Access in: jun. 2026.
IBGE, Instituto Brasileiro de Geografia e Estatística. Cidades: Rio de Janeiro – panorama. 2025. Available at: https://cidades.ibge.gov.br/brasil/rj/rio-de-janeiro/panorama. Access in: jun. 2026.
JENKS, George F.; CASPALL, Fred C. Error on choroplethic maps: definition, measurement, reduction. Annals of the Association of American Geographers, v. 61, n. 2, p. 217–244, 1971. ISSN: 14678306, DOI: 10.1111/j.1467-8306.1971.tb00779.x. Available at: https://www.tandfonline.com/doi/abs/10.1111/j.1467-8306.1971.tb00779.x. Access in: 29 apr. 2026
LONGLEY, Paul A.; GOODCHILD, Michael F.; MAGUIRE, David J; RHIND, David W. Sistemas e ciências da informação geográfica. 3ª ed. Porto Alegre: Bookman, 2013. 560 p. ISBN: 978-8-565-83765-1.
LONGLEY, Paul A; GOODCHILD, Michael F; MAGUIRE, David J; RHIND, David W. Geographic information systems and science. 2ª ed. New York: Wiley, 2005. 460 p. ISBN: 978-1-118-67695-0.
MENEZES, Paulo Márcio Leal De; FERNANDES, Manoel do Couto. Roteiro de cartografia. São Paulo: 1ª ed. Oficina de Textos, 2013. ISBN: 978-85-7975-232-2.
NOGUEIRA, Ruth E. Cartografia: representação, comunicação e visualização de dados espaciais. 2. ed. Florianópolis: Ed. UFSC, 2008.
POSIT, Team. RStudio: Integrated Development Environment for R (Version 2025.05.0) Windows 10/11. Posit, PBC, 2025. 2025. Available at: https://posit.co/. Access in: 29 mar. 2026.
RIO DE JANEIRO, Prefeitura. Mapeamento de Uso do Solo da Cidade do Rio de Janeiro, 2019. Escala cartográfica 1:10.000. DATA RIO. Rio de Janeiro: Prefeitura da Cidade do Rio de Janeiro, Instituto Pereira Passos, 2021. Available at: https://www.data.rio/datasets/PCRJ::uso-do-solo-2019/explore. Access in: 3 jun. 2026.
RIO DE JANEIRO, Prefeitura. Limite de Bairros da Cidade do Rio de Janeiro. DATA RIO. Rio de Janeiro: Prefeitura da Cidade do Rio de Janeiro, Instituto Pereira Passos, 2023. Available at: https://www.data.rio/datasets/limite-de-bairros/explore. Access in: 29 mar. 2026.
RIO DE JANEIRO, Prefeitura. Censo 2022: população e domicílios por bairros (dados preliminares). Rio de Janeiro, 2024. Available at: https://www.data.rio/datasets/fd354740f1934bf5bf8e9b0e2b509aa9_2/about. Access in: 3 jun. 2026.
RIO DE JANEIRO, Prefeitura. Lei Complementar nº. 286, de 8 de setembro de 2025. Cria a área geográfica da Zona Sudoeste da Cidade do Rio de Janeiro, que abrange os bairros das Regiões Administrativas XVI, XXXIV e XXIV, que ora compõem a Área de Planejamento 4. Rio de Janeiro: 2025. Available at: https://aplicnt.camara.rj.gov.br/APL/Legislativos/contlei.nsf/a99e317a9cfec383032568620071f5d2/4107efa110ff967d03258cff0052fd46?OpenDocument. Access in: 29 mar. 2026.
RIO DE JANEIRO, Prefeitura. Unidades de Saúde Municipais. DATA RIO. Rio de Janeiro: 2026. Available at: https://datariov2-pcrj.hub.arcgis.com/datasets/d213d40853f2459f97efc46d8ffa2afa_0/explore. Access in: 29 mar. 2026.
SILVERMAN, Bernard W. Density Estimation for Statistics and Data Analysis. Chapman and Hall. New York, 1986. Available at: https://ned.ipac.caltech.edu/level5/March02/Silverman/paper.pdf. Access in: 16 apr. 2026.
About the Authors
Fábio da Silva Lima is a doctoral candidate in Geography in the Graduate Program in Geography at the Federal University of Rio de Janeiro (PPGG/UFRJ). He holds a bachelor's degree and a master's degree in Geography from the Federal University of Rio de Janeiro (UFRJ). He holds a bachelor's degree in Law from the Rio de Janeiro State University (UERJ). He holds a specialization in Notarial and Registration Law (2020) and in Environmental and Urban Law (2023) from Cândido Mendes University (UCAM). He works as a researcher at the Cartography Laboratory (GeoCart), Department of Geography, UFRJ, and as a graduate student representative on the Monitoring Committee for the Use of Geotechnologies in Teaching, Research, Innovation, and Extension at UFRJ (GEOTEC/UFRJ Committee).
Fábia Antunes Zaloti holds a bachelor's degree in Cartographic Engineering from São Paulo State University Júlio de Mesquita Filho, an MBA in Project Management from Getulio Vargas Foundation (FGV), a master's degree and a doctorate in Geography from the Federal University of Bahia, and is a postdoctoral researcher in Geography at the Federal University of Rio de Janeiro. She is a research associate at the Cartography Laboratory (GeoCart), Department of Geography, UFRJ. She was a substitute professor in the Undergraduate Geography Program (Licentiate and Bachelor's degrees) at UFBA, where she taught courses in GIS, Field Practices and Territory Mapping, Systematic Cartography, and Aerial Photogrammetry and Remote Sensing. She has experience in the management and execution of projects in Cartography, Remote Sensing, and Geoprocessing, encompassing: preparation of digital cartographic bases, modeling of geospatial databases for Geographic Information Systems, cartographic layout, mapping of land cover and land use, hydrography, and transportation systems.
Gabriel de Oliveira Alves is an undergraduate student in Geography at the Federal University of Rio de Janeiro (UFRJ) and a researcher affiliated with the Cartography Laboratory (GeoCart), Department of Geography, UFRJ. He develops research activities in Cartography and Remote Sensing, working mainly in the areas of remote sensing applied to environmental studies, toponymic analysis, and spatial representation of geographic data.
Paulo Márcio de Leal Menezes is a Voluntary Full Professor, affiliated with the Graduate Program in Geography at the Federal University of Rio de Janeiro, where he is linked to GeoCart - the Cartography Laboratory, Department of Geography, having been its coordinator from its creation on April 5, 1995, until April 2023. He has experience in the field of Geosciences, with an emphasis on Basic Cartography, Adjustment Calculus, and Geodesy, working mainly in the following areas: cartography, remote sensing, geoprocessing, digital cartography, historical cartography, and geographic names (toponymy). He served as Vice-President of the International Cartographic Association (ICA/ACI) from 2011 to 2015 within the Association's Executive Committee. He created the ICA Commission on Toponymy, serving as Chair and Co-Chair from 2015 to 2019. He is a CNPq Level 2 Researcher from March 2022 to September 2025. He holds a bachelor's degree in Engineering from the Military Academy of Agulhas Negras (1969), a bachelor's degree in Geodesy and Topography Engineering from the Military Institute of Engineering (1977), a master's degree in Systems and Computing from the Military Institute of Engineering (1987), and a doctorate in Geography from the Federal University of Rio de Janeiro (2000).
Manoel do Couto Fernandes is a Full Professor in the Department of Geography at the Federal University of Rio de Janeiro (UFRJ). He works in the areas of teaching, research, and extension at UFRJ. He is currently the coordinator of the Cartography Laboratory (GeoCart), Department of Geography, UFRJ, and a CNPq Level 2 Researcher. He holds a postdoctoral degree from the University of Wolverhampton (United Kingdom) and a doctorate from the Graduate Program in Geography at UFRJ. He develops research in the field of Geosciences, with an emphasis on Cartography, Geoecology, and Geosciences, supervising undergraduate, master's, doctoral, and postdoctoral students. In his professional and research activities, he interacts with various collaborators in co-authoring scientific articles in the areas of Geoecology, Cartography, Historical Cartography, Geosciences, and Geomorphology.
Author Contributions
Conceptualization, F.S.L., F.A.Z., G.O.A., P.M.L.M., M.C.F.; methodology, F.S.L., F.A.Z., G.O.A., P.M.L.M., M.C.F.; software, F.S.L., F.A.Z., G.O.A., P.M.L.M., M.C.F.; validation, F.S.L., F.A.Z., G.O.A., P.M.L.M., M.C.F.; formal analysis, F.S.L., F.A.Z., G.O.A., P.M.L.M., M.C.F.; investigation, F.S.L., F.A.Z., G.O.A., P.M.L.M., M.C.F.; resources, F.S.L., F.A.Z., G.O.A., P.M.L.M., M.C.F.; data curation, F.S.L., F.A.Z., G.O.A., P.M.L.M., M.C.F.; writing – original draft preparation, F.S.L., F.A.Z., G.O.A., P.M.L.M., M.C.F.; writing – review and editing, F.S.L., F.A.Z., G.O.A., P.M.L.M., M.C.F.; visualization, F.S.L., F.A.Z., G.O.A., P.M.L.M., M.C.F.; supervision, F.S.L., F.A.Z., G.O.A., P.M.L.M., M.C.F.; project administration, F.S.L., F.A.Z., G.O.A., P.M.L.M., M.C.F.; funding acquisition, F.S.L., F.A.Z., G.O.A., P.M.L.M., M.C.F. All authors have read and agreed to the published version of the manuscript.
Acknowledgments
The authors thank the National Council for Scientific and Technological Development (CNPq) for their support, especially for the doctoral scholarship granted to the first author.
They equally thank the Graduate Program in Geography at the Federal University of Rio de Janeiro (PPGG/UFRJ), the Cartography Laboratory (GeoCart) of the Department of Geography at UFRJ, the City Hall of the City of Rio de Janeiro, and the Brazilian Institute of Geography and Statistics (IBGE) for providing data and information that contributed to the completion of this study.
Conflicts of Interest
The authors declare no conflict of interest.
About Coleção Estudos Cariocas
Coleção Estudos Cariocas (ISSN 1984-7203) is a publication dedicated to studies and research on the Municipality of Rio de Janeiro, affiliated with the Pereira Passos Institute (IPP) of the Rio de Janeiro City Hall.
Its objective is to disseminate technical and scientific production on topics related to the city of Rio de Janeiro, as well as its metropolitan connections and its role in regional, national, and international contexts. The collection is open to all researchers (whether municipal employees or not) and covers a wide range of fields — provided they partially or fully address the spatial scope of the city of Rio de Janeiro.
Articles must also align with the Institute’s objectives, which are:
- to promote and coordinate public intervention in the city’s urban space;
- to provide and integrate the activities of the city’s geographic, cartographic, monographic, and statistical information systems;
- to support the establishment of basic guidelines for the city’s socioeconomic development.
Special emphasis will be given to the articulation of the articles with the city's economic development proposal. Thus, it is expected that the multidisciplinary articles submitted to the journal will address the urban development needs of Rio de Janeiro.