
Volume 14 Issue 2 *Corresponding author albertobarros@id.uff.br Submitted 14 May 2026 Accepted 22 Jun 2026 Published 09 Jul 2026 Citation BARROS, A. M. B. et al. Confinement morphology: open-source mapping of vertical accessibility and disability vulnerability in the Rocinha Favela, Rio de Janeiro (RJ). Coleção Estudos Cariocas, v. 14, n. 2, 2026.
DOI: 10.71256/19847203.14.2.230.2026 The article was originally submitted in PORTUGUESE. Translations into other languages were reviewed and validated by the authors and the editorial team. Nevertheless, for the most accurate representation of the subject matter, readers are encouraged to consult the article in its original language.


| Confinement morphology: open-source mapping of vertical accessibility and disability vulnerability in the Rocinha Favela, Rio de Janeiro (RJ) Morfologia do confinamento: mapeamento open-source da acessibilidade vertical e vulnerabilidade de PcD na Favela da Rocinha, Rio de Janeiro (RJ) Morfología del confinamiento: mapeo open-source de la accesibilidad vertical y vulnerabilidad de PcD en la Favela de Rocinha, Río de Janeiro (RJ) Alberto Martins Barros1, Deise dos Santos Faustino2,, Luan da Silva Costa3 and William Cosme de Souza Bannitz⁴ 1Universidade Federal Fluminense, Rua Passo da Pátria, 156 bloco D sala 236 - São Domingos - Niterói - RJ - 24210-240, ORCID 0000-0003-3733-4509240, albertobarros@id.uff.br 2Universidade do Estado do Rio de Janeiro, Rua São Francisco Xavier, 524 – Maracanã – Rio de Janeiro – RJ – 20550-900, ORCID 0009-0001-2614-6281, deisesfaustino@gmail.com 3Instituto de Comunicação e Informação Científica e Tecnológica em Saúde (ICICT), Fundação Oswaldo Cruz (Fiocruz), Av. Brasil, 4365, Pavilhão Haity Moussatché, Manguinhos, Rio de Janeiro - RJ, 21040-900, ORCID 0009-0004-2969-7451, luancostageo@gmail.com 4Pontifícia Universidade Católica do Rio de Janeiro, Rua Marquês de São Vicente, 225 - Gávea - Rio de Janeiro - RJ - 22451-045, ORCID 0009-0009-4569-8936, williambannitz@gmail.com
AbstractThis article proposes a methodology for mapping vertical accessibility and the vulnerability of People with Disabilities (PwD) using Open Source geotechnologies. Focusing on the Rocinha Favela (RJ) as a case study, the work structured a pipeline based on neighborhood radial sampling and geostatistical processing in Python. The results were presented in an interactive dashboard and reveal that the highest population density of PwD is concentrated in higher altitude strata. This study contributes to the debate on contemporary public management challenges by highlighting how geographical barriers act as social determinants that restrict the access of vulnerable populations to basic services. Keywords: geotechnologies; Python; people with disabilities (PwD); social urbanism; spatial sampling; confinement.
ResumoEste artigo propõe uma metodologia para mapear a acessibilidade vertical e a vulnerabilidade de Pessoas com Deficiência (PcD) utilizando geotecnologias Open Source. Como objeto de estudo a Favela da Rocinha (RJ), o trabalho estruturou um pipeline baseado em amostragem radial por vizinhança e processamento geoestatístico em Python. Os resultados foram apresentados em um painel interativo e revelam que a maior densidade populacional de PcD concentra-se nos estratos de maior altitude. Este estudo contribui para o debate sobre os desafios contemporâneos da gestão pública ao evidenciar como as barreiras geográficas atuam como determinantes sociais que restringem o acesso de populações vulneráveis aos serviços básicos. Palavras-chave: geotecnologias, Python, pessoas com deficiência (PcD), urbanismo social, amostragem espacial, confinamento.
ResumenEste artículo propone una metodología para mapear la accesibilidad vertical y la vulnerabilidad de las Personas con Discapacidad (PcD) utilizando geotecnologías de Código Abierto (Open Source). Tomando como objeto de estudio la Favela de la Rocinha (RJ), el trabajo estructuró un pipeline basado en el muestreo radial por vecindad y el procesamiento geoestadístico en Python. Los resultados fueron presentados en un panel interactivo y revelan que la mayor densidad de población de PcD se concentra en los estratos de mayor altitud. Este estudio contribuye al debate sobre los desafíos contemporáneos de la gestión pública al evidenciar cómo las barreras geográficas actúan como determinantes sociales que restringen el acceso de las poblaciones vulnerables a los servicios básicos. Palabras clave: geotecnologías; Python; personas con discapacidad (PcD); urbanismo social; muestreo espacial; confinamiento. |
1 Introduction
The Brazilian urbanization process did not consolidate in a disorderly manner, but rather through a selective logic of socio-spatial segregation that resulted in the formation of vast informal urban territories. The city is continuously planned from an incomplete framing of reality, and the population that most depends on accessible infrastructure becomes, precisely, the hardest to see. Favelas, far from being products of chance, are the outcome of an urban planning that historically prioritized the isolation of vulnerable populations in pockets of inaccessibility characterized by a complex interplay between socioeconomic and environmental factors. Such contexts represent a significant obstacle to the planning and implementation of effective public policies, especially those aimed at urban accessibility and social inclusion (Ribeiro, 2010).
The 2022 Demographic Census of the Brazilian Institute of Geography and Statistics (IBGE) revealed that approximately 16.4 million Brazilians live in favelas and urban communities, which corresponds to 8.1% of the country’s total population. Among these, Rocinha Favela, located in the municipality of Rio de Janeiro, stands out as the largest in Brazil, housing more than 72,000 inhabitants (IBGE, 2022; G1 Rio, 2024).
In this place, the issue acquires a specific density. The hillside organizes space, structures movement, and produces vertical discontinuities that are not only topographic but also social. The difficulty of moving around in areas of high slope and elevation, combined with infrastructural precariousness, restricts access to essential services, work and leisure opportunities, and perpetuates cycles of exclusion. Therefore, disability cannot be read solely as an attribute of the body; it is also an effect of the territory, of discontinuities in the urban fabric, of the gradient of streets, and of the absence of vertical mobility solutions. It is in this context that the concept of the morphology of confinement becomes useful: it concerns an urban geometry that does not appear as a physical wall, but operates as a material barrier to autonomy and to full participation in urban life (Gleeson, 1999; Santos, 1996). What should be a universal right is frequently denied to these communities by the lack of transparent and accessible equipment and tools that allow the understanding and contestation of their spatial reality.
Therefore, this study is justified by the need to democratize access to geospatial information and to empower communities and public managers with visual and interactive instruments for planning a more inclusive urbanism. The scenario demands an architecture of evidence capable of translating the territory into a public, visual, analytical, and intuitive language. Studies on geotechnologies and accessibility already indicate that collaborative maps, OpenStreetMap-based services, and publicly accessible spatial models can support personalized routes, identify barriers, and expand the right to the city (Salomoni; Mirri, 2014).
Thus, the general objective of this project was to develop a Proof of Concept (PoC) using exclusively Open Source geotechnologies to map vertical accessibility in Rocinha. The proposed methodology is based on a radial neighborhood sampling routine with a fixed radius of 50 meters from prior altitude calculations by sector centroids, integrating topography APIs and Python scripts for extracting altimetric medians and the slope spectrum. The interactive visualization in PyDeck allows the overlay of hypsometry, slope, density of PcD, and dynamic altimetric profiles.
In this way, the contribution of this research lies in articulating this repertoire with a specific application in Rocinha, where the results indicate that the highest concentration of PcD occurs in the highest-altitude terciles of the community. The analysis reveals that there are islands of accessibility in sectors that present, in their minimum slope rates, gradients below the limit of 8.33% established by standard NBR 9050 (ABNT, 2020). However, structural exclusion is confirmed by the fact that the medians and maximum slopes of all sub-neighborhoods present rates above the standard, evidencing the physical isolation of these populations. Thus, the developed dashboard not only denounces existing barriers, but serves as a robust tool for planning mobility interventions and promoting social justice, demonstrating that the combination of severe topography and social vulnerability produces a scenario in which physical autonomy is structurally limited.
2 Theoretical Foundation
2.1 Social Urbanism, Accessibility and Geotechnologies
Accessibility must be understood as a right, not as an adornment of the urban landscape. Ruiz, Temes-Cordovez and Câmara-Menoyo (2018) show that the use of new information technologies can generate maps guided by the principles of spatial justice, universal design and full autonomy in the city. Mirri et al. (2014) present a geospatial service based on OpenStreetMap to provide personalized routes to users with special needs, while Prandi, Salomoni and Mirri (2014) combine sensing, crowdsourcing and georeferenced systems to produce more detailed and useful datasets for urban accessibility.
In the field of participatory cartography, Flacke, Hoefsloot and Pfeffer (2023) describe an Open Source prototype of inclusive collaborative mapping, developed with the participation of persons with disabilities. Soman et al. (2020) show that scalable computational approaches, based on the topological properties of digital maps, can identify infrastructural deficits and propose minimal contextualized solutions for informal settlements. In another front, Grippa et al. (2019) demonstrate that Open Source solutions can map precarious settlements, extract useful geographic information and make methods and code available in open access, reinforcing the technical feasibility of the path adopted here.
In Brazil, the literature on mobility and accessibility in favelas confirms that interventions in this field tend to be indirect, fragmented or insufficient. Brandão and Bueno (2018) note that actions linked to physical mobility and accessibility integrate the infrastructure necessary for urban and land regularization, but still appear indirectly in urbanization programs. Izaga and Pereira (2014), when dealing with Rio de Janeiro’s favelas, show that the issue of urban mobility was addressed in recent programs, but without fully resolving the circulation demands in hillside areas. Rodrigues et al. (2021) reinforce that favela residents present spatial and temporal inequalities in displacement compared to non-residents, which helps sustain the hypothesis that territorial inequality translates into mobility inequality.
The normative framework of this work relies on NBR 9050 (ABNT, 2020), which establishes criteria and technical parameters for the design, construction, adaptation and installation of buildings and the urban environment under accessibility conditions. In this research, the standard was used as a reference to interpret the degree of criticality of the slope observed through spatial sampling, especially because the predominant relief of the territory already expressively exceeds the acceptable limits for the autonomous mobility of PcD.
2.2 Social Urbanism in Contexts of Confinement Morphology
The concept of social urbanism emerges as a transformative approach to urban planning, especially in contexts of high social and spatial vulnerability. Unlike traditional urban interventions, which sometimes prioritize physical infrastructure at the expense of social needs, social urbanism seeks the integration between physical space and the social fabric, promoting equity, citizen participation and the improvement of quality of life (Carro, 2021).
However, when we delve into the morphology of confinement, we are confronted with the antithesis of this fluidity. Here, the territory ceases to be a passive stage and becomes an agent that dictates who can and who cannot reproduce themselves spatially. The morphological condition ceases to be merely a geological formation and emerges as an architecture of exclusion, where each degree of slope acts as an invisible step, and each centimeter of altitude widens the physical and symbolic distance between the citizen and their right to the city. Under these geographical conditions, confinement does not manifest itself through bars, but through prohibitive slopes and elevations, because the morphology of the hillside becomes a topographic barrier that, in different senses, crystallizes the immobility of PcD and transforms the landscape into a material barrier to the sovereignty of urban existence.
In this field there is a scope of notable experiences such as those in Medellín, Colombia, which demonstrated the potential of social urbanism to reverse scenarios of violence and exclusion through projects that combine transportation infrastructure with social and cultural facilities, connecting the peripheries to the city center and fostering a sense of belonging (Darabi, 2019).
Nevertheless, the replication of successful models requires an in-depth understanding of the local context. The experience of Rio de Janeiro with cable cars in favelas, as in Complexo do Alemão, although inspired by Medellín, faced significant challenges and did not achieve the same transformative impact, believed to be, in part, due to the lack of consultation and alignment with the community’s priorities (Santos; Gonçalves, 2019). This reinforces the importance of participatory approaches and the use of precise data to inform planning decisions, ensuring that interventions are truly responsive to the residents’ needs and grounded in geospatial evidence.
2.3 Accessibility for Persons with Disabilities (PcD) in Informal Territories and the Role of Open Source Geotechnologies in Promoting Equity
Urban accessibility is a fundamental right and a pillar of inclusive urbanism. For PcD, accessibility goes beyond the mere removal of architectural barriers, as it encompasses the guarantee of autonomy, safety and full participation in social life. In a large part of Rio de Janeiro’s favelas, barriers are amplified by the rugged topography, narrow and irregular streets, lack of adequate sidewalks and absence of adapted public transportation (Alvim, [n.d.]). The Brazilian Accessibility Standard establishes technical parameters to ensure accessibility in buildings, urban spaces and equipment, including slope limits for ramps (ABNT, 2020). However, the application of this standard in informal territories presents complex challenges.
The vulnerability of PcD in favelas is multidimensional, going beyond mobility difficulties, and also reaching limited access to health services, education, employment, social assistance, among others. Mapping the spatial distribution of PcD in relation to the topographic characteristics of the terrain is crucial to identify critical areas and prioritize interventions that promote inclusion and equity.
Thus, geotechnologies have proven to be powerful tools for the study and intervention in complex urban contexts. The capacity to collect, process, analyze and visualize geospatial data in an accessible and transparent manner fills historical information gaps and empowers communities (Chakraborty et al., 2015). The use of elevation APIs, geographic information systems (GIS) based on free software and programming languages such as Python allows the creation of digital terrain models and the analysis of spatial patterns that would be unfeasible with traditional methods or high-cost proprietary software.
In this project, the choice of a 100% Open Source approach is not merely by chance or a matter of cost, but rather an ethical and methodological stance. It guarantees the reproducibility of the study, the auditability of the processes and the possibility of adaptation and improvement by other communities and researchers. By making the processing pipeline available in open access, this work contributes to the construction of collective knowledge aimed at promoting spatial justice in marginalized territories.
3 Acquisition and Pre-processing of Topographic Data
This study employs a robust territorial intelligence pipeline, designed under the premise of democratizing access to geospatial analysis through Open Source tools. The architecture was conceived to mitigate the scarcity of microdata in urban communities and promote reproducibility in other informal contexts. The data corpus on the PcD population in Rocinha was obtained from secondary data sourced from the Instituto Pereira Passos (IPP), with a reference period in the year 2019. The use of this database, made available through the UNIR Project (PUC-Rio, 2025), allows for the analysis of the socio-spatial distribution of this demographic group according to the census/administrative records consolidated by the municipality in that time frame. Although the reference period presents a temporal lag, this database constitutes an official consolidated source for the analysis of the distribution of PcD in the territory of Rocinha. To ensure analytical integrity in the face of the rugged morphology of the territory and to overcome spatial resolution limitations, an advanced sampling routine and statistical ranking treatment were applied, the structural steps of which are described below:
3.1 Organizações de fé e suas ambivalências em contextos urbanos desiguais
The main barrier to detailed topographic analysis in favelas is the absence of high-resolution Digital Terrain Models (DTM) provided by official agencies. Rocinha, in turn, lacks a sufficiently fine official altimetric base for the proposed problem. To overcome this limitation, the Proof of Concept (PoC) processed altimetric extraction through a resilient search engine with triple redundancy: Open-Elevation and OpenTopoData APIs, with automated geodetic fallback, ensuring the integrity of the 3D mesh even under network instabilities. This pipeline offers a free and open-source alternative for obtaining global altimetric data, allowing elevation queries for specific geographic coordinates. Although precision may vary depending on the underlying data source, these proved adequate for the scale of analysis proposed.
The first step of spatial processing involved the use of Python scripts, with the GeoPandas library, to manipulate the vector mesh (GeoJSON) representing the sub-neighborhoods of Rocinha. Initially, only the geometric altitude of the centroid was extracted, but this process became vulnerable to false plateaus captured by the satellite. Overcoming this, the algorithm generated a nine-point mesh for each sector, that is, the centroid plus eight vectors in a 50-meter radial projection. The altimetry engine queried the elevation of the entire sample and the altitude of the territory was defined by the median of these nine points. This approach stabilizes local topographic anomalies and ensures the recovery of the actual ground elevation. For hypsometric classification, the statistical ranking method into terciles was applied, ensuring the volumetric homogeneity of the samples.
Subsequently, another critical indicator of vertical accessibility was mathematically derived: the terrain slope. Using the same 50-meter radial mesh, the altitude difference between the centroid and the extremities of its spatial envelope was calculated. To mitigate the noise inherent to orbital data without masking the prohibitive reality of the hillside, the model extracted the full spectrum of local slope: minimum, median, and maximum. At this stage, the objective was to create an approximate but functional topographic gradient for the territorial diagnosis.
The adopted logic stems from a pragmatic principle: in socially vulnerable territories, excessively costly precision can render analysis unfeasible. However, a well-calibrated simplification can produce sufficient evidence to guide intervention. The natural fluctuation of the orbital method is compensated for by extracting the full spectrum within the 50-meter radius as a mapping benchmark. In this way, the hillside panorama is preserved and misleading point readings are circumvented, revealing the true physical barrier installed in the territory.
3.2 Classification, Interactive Visualization and Geostatistical Processing
After primary processing, the elevation data underwent advanced statistical processing aimed at overcoming the spatial resolution limitations (30m) of global orbital models. To ensure that the micro-relief of Rocinha was not masked by digital flattening, a radial neighborhood sampling routine was implemented. The use of neighborhood operations for the extraction of topographic statistics is a method consolidated in the spatial literature to mitigate local noise in Digital Elevation Models (DEM) and calculate the actual terrain gradient (Burrough; McDonnell; Lloyd, 2015). For each census sector, a nine-point mesh was generated — one centroid and eight radial points at a fixed 50-meter radius —, whose variables were classified and processed as follows:
- Hypsometry (Altitude): The altimetric elevation of each sector was defined by the median of the point sample. This technique made it possible to stabilize the model against anomalies of the Digital Surface Model (DSM), such as radar noise caused by dense rooftops or even elevated infrastructure, ensuring the recovery of the actual ground elevation. The variable was divided into three classes by terciles (low, medium, high), allowing the correlation of altitude strata with social vulnerability.
- Slope (Inclination): To ensure analytical transparency and avoid narrative biases, the model extracted the full slope spectrum per sub-neighborhood: minimum, median, and maximum. For cartographic representation and ranking — divided into seven classes by quantiles —, the maximum slope criterion was adopted. This choice is grounded in standard NBR 9050 (ABNT, 2020), which establishes accessibility based on the most restrictive point of the route. Thus, the index identifies the worst degree of physical barrier, preventing critical bottlenecks from being diluted by arithmetic means. However, to ensure the scientific integrity of the sample, the full spectrum is transparently presented in the evidence dashboard.
Structurally, the project was consolidated in a GitHub repository, serving as the foundation for the development of the interactive dashboard using the Streamlit library, which allows the creation of web data applications in Python. Subsequently, the integration of the PyDeck library was strategic to enable high-performance 3D geospatial visualizations, allowing the rendering of extruded layers to represent local hypsometry. In this configuration, the height of the extrusions corresponds to the actual altitude of the sectors, providing an immediate volumetric perception of the topography. In parallel, the application of scatter layers enabled the visualization of the concentration of PcD through a density gradient, where the radius and color of the bubbles represent the population percentage of persons with disabilities in each territory. This analytical overlay was fundamental to precisely identify the hotspots of spatial vulnerability in the community and present the data from multiple perspectives.
Complementarily, the Plotly library was used for generating dynamic charts, such as hypsometric profiles, scatter plots for correlation analysis, and slope spectrum profiles that allow the user to simultaneously compare relief variations in each sub-neighborhood. This approach offers interactivity features to explore the data in a multidimensional way, in addition to the possibility of instant export in PNG format. Such a feature is strategic for public management, as it enables the direct transposition of visual evidence into technical reports, diagnoses and urban planning documents.
Additionally, the dashboard integrates multilingual support in Portuguese, Spanish and English. This functionality was conceived as a strategy for the internationalization of the tool, aiming to foster the exploration of the diagnosis by different audiences and spheres of debate. Rocinha has a strong tourist appeal and a privileged location in the South Zone of Rio de Janeiro, so the multilingual engine seeks to confront the conventional tourist narrative with the severe internal territorial disparities. It is imperative that the international gaze upon the community understands the urban contradictions and accessibility barriers that remain invisible beneath the aesthetics of the hillsides, transforming technical data into an instrument of global denunciation.
3.3 Integrated Artificial Intelligence (AI): Gemini 1.5 Flash Copilot
A distinctive feature of this pipeline is the integration of the Gemini 1.5 Flash API, configured as an artificial intelligence agent that acts as a governance and communication layer. This agent was fed with project data and contextual guidelines about Rocinha, social urbanism and accessibility. Its function is the semantic interpretation of correlation matrices, enabling the model to analyze and explain the spatial interdependencies between the distribution of PcD and topographic variables, translating complex data into intelligible responses.
Additionally, the Copilot processes natural language queries, resolving technical doubts of users about the methodology and the implications of the results. Such architecture aims to mitigate information asymmetries and democratize access to technical knowledge for non-specialists. Conceptually, this approach converges with the literature that advocates the combination of collaborative mapping, open data and assistive spatial services for the promotion of urban justice (Mirri et al., 2014; Prandi; Salomoni; Mirri, 2014; Ruiz; Temes-Cordovez; Cámara-Menoyo, 2018).
4 Results
The application of the methodological pipeline revealed spatial patterns and quantitative metrics that authenticate the severity of accessibility barriers in Rocinha Favela. The visual evidence presented in this section was extracted directly from the dashboard interface, using the native data export functionality. The main result of this study, corroborated by the spatial correlation analysis, reveals that the highest average concentration of PcD (6.39%) in Rocinha is located in areas with the highest altimetric elevation and steep slope. The geographic hostility of the territory restricts mobility precisely in the sectors where the required physical effort is maximum and spatial autonomy is minimum.
In this case, topography is not a backdrop, but an active part of the production of vulnerability, as it evidences a severe geographic isolation, where the population with the greatest mobility restriction is confined to the zones of most difficult access. The social implications are profound, as they limit access to health services, education, transportation and work opportunities (Alvim, [n.d.]). The 3D visualization on the interactive map makes this spatial reality immediately perceptible, transforming abstract data into a tangible representation of exclusion.
When delving into the normative reading, a new and highly relevant alert is found: the Brazilian Accessibility Standard NBR 9050 establishes a maximum slope limit of 8.33% for accessible ramps, aiming to guarantee the safety and autonomy of persons with reduced mobility (ABNT, 2020). However, the spatial analysis of the territory revealed that the median slope of 100% of the sub-neighborhoods exceeds the normative limits. The graphs in Figures 1 and 2 detail the altimetric and slope profiles of Rocinha. The extraction of the slope spectrum demonstrates that most sectors present stretches with minimum rates below 8.33%, suggesting the existence of punctual ‘islands of accessibility’. However, the median and the maximum rate of all sub-neighborhoods break the continuity of the autonomous route. Highlighted is the Faz Depressa sector, which alone concentrates, as indicated in Figure 3, 16.61% of PcD, classifying it as the third highest in altimetry and presenting a slope with a median of 16.3% and a maximum of 34%. The topographic abyss repeats itself in Vila Vermelha with a maximum slope rate of 46.7% — in addition to the 4th highest altitude at 206m —, in Capado with 36%, and in Cachopa with a median slope of 26.2%. These sectors, respectively, concentrate high population rates of 11%, 9.35% and 9.59%.
The graph in Figure 4 presents the statistical intersection between altitude and the concentration of PcD by sector, making visible the vulnerability hotspot located at the top of the community. The graph in Figure 5 details the dispersion of this group in relation to local slope, demonstrating that the majority of residents with disabilities live in zones that drastically exceed the slope limits foreseen for functional autonomy. Finally, Figure 6 consolidates the concentration of PcD by terrain level, highlighting the highest levels concentrating 6.39%.
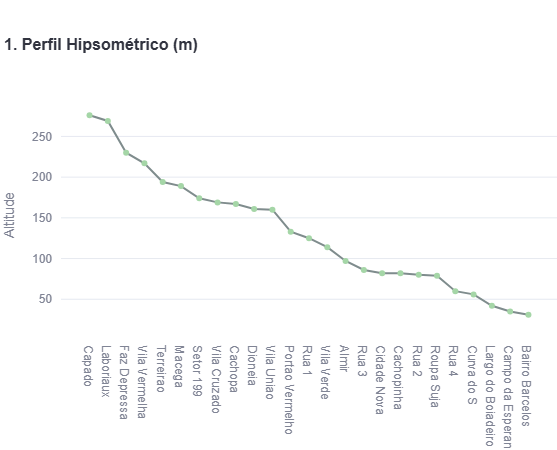
Figure 1: Hypsometric profile (altitude variation across Rocinha sub-neighborhoods)
Source: Prepared by the authors
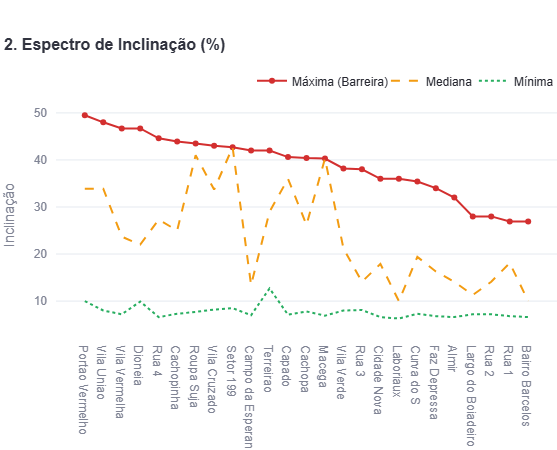
Figure 2: Slope spectrum (distribution of slope percentages (%) per sub-neighborhood in Rocinha)
Source: Prepared by the authors
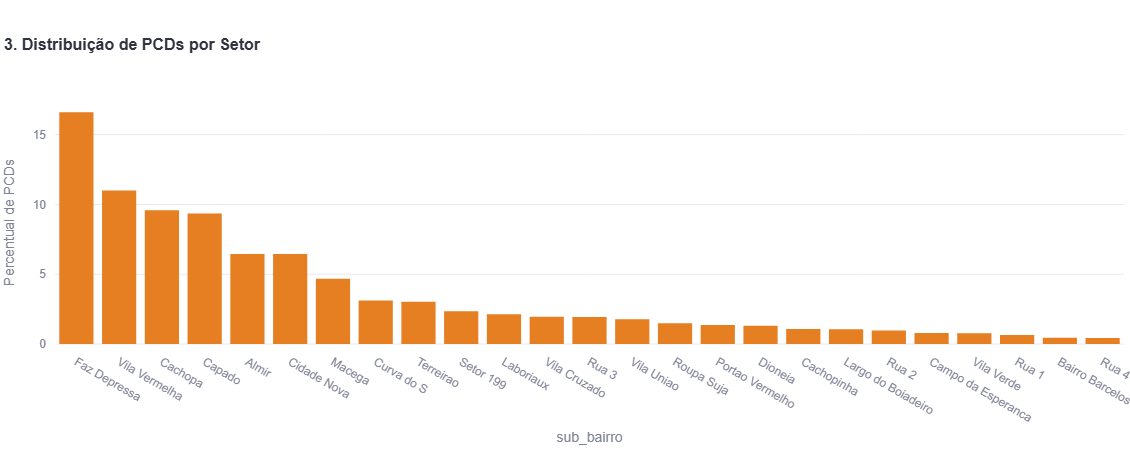
Figure 3: Percentage distribution of PcD per sub-neighborhood in Rocinha
Source: Prepared by the authors
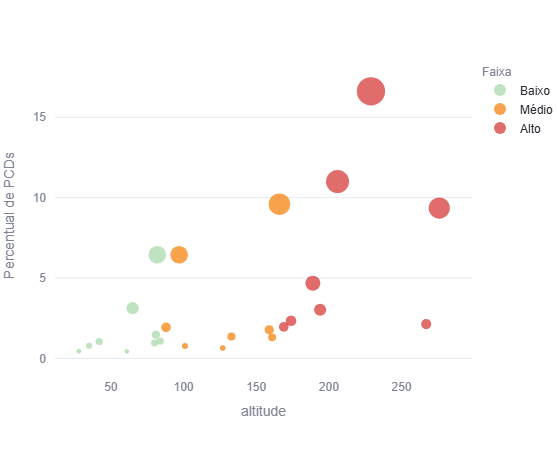
Figure 4: Dispersion and correlation between altitude (m) and concentration of PcD (%) in Rocinha sub-neighborhoods
Source: Prepared by the authors
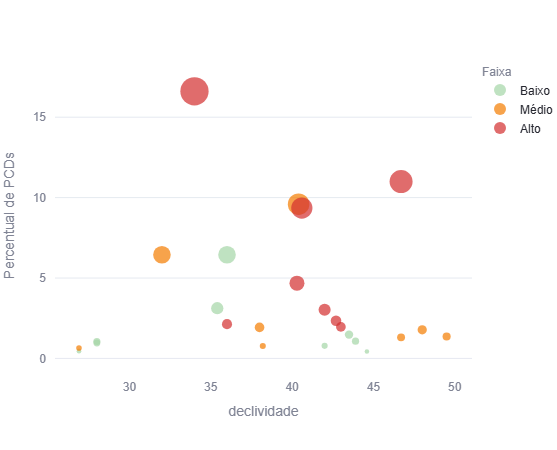
Figure 5: Spatial dispersion and correlation between density of PcD (%) and slope indices (%) in Rocinha sub-neighborhoods
Source: Prepared by the authors
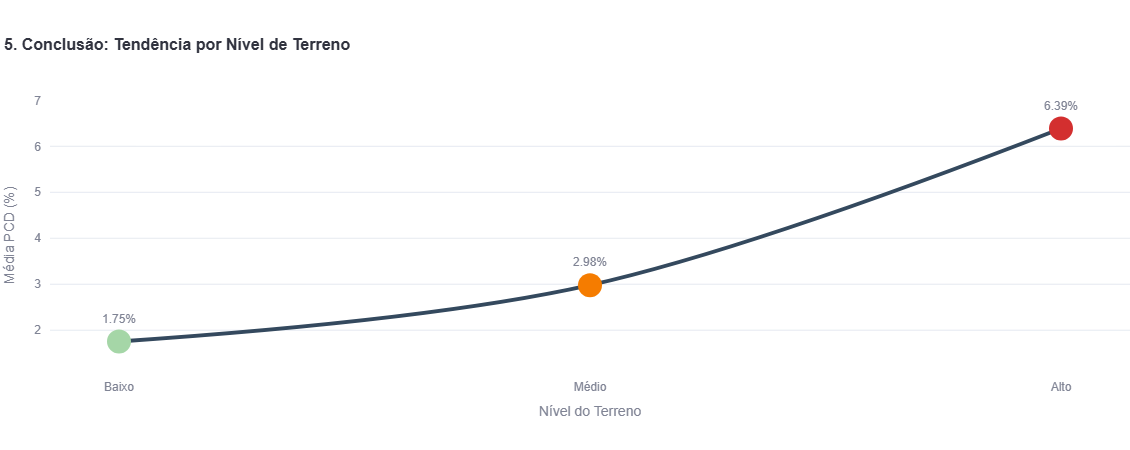
Figure 6: Mean population density of PcD (%) according to terrain level bands (Low, Medium, High)
Source: Prepared by the authors
This scenario indicates that universal accessibility does not fail only in the most critical stretches, as it already collapses in the structural average of the neighborhood itself. In a rugged terrain like Rocinha, if there is no massive vertical mobility infrastructure, the autonomous circulation of PcD is not merely hindered, but structurally impossible. This data quantifies the chronic inaccessibility of the territory and the ineffectiveness of palliative adaptation solutions. It serves as evidence of the need for deep structural interventions so that conditions of dignity and autonomy may be offered to the PcD of the community.
The literature on mobility in Rio de Janeiro’s favelas and on accessibility in precarious settlements supports this reading by showing that mobility is a central component of urbanization, but often treated secondarily in public interventions. Another important result is the usefulness of the dashboard as an instrument of transparency. By crossing the density of PcD and topography, the system makes visible a relationship that, in traditional diagnoses, remains abstract in reports of public agencies. Interactive visualization does not replace territorial analysis, but makes it unquestionably intelligible. This is coherent with works that demonstrate the capacity of collaborative maps and open databases to support solutions in informal settlements (Brandão; Bueno, 2018; Izaga; Pereira, 2014; Rodrigues et al., 2021).
5 Discussion
The results obtained in this study reinforce the complexity of accessibility challenges in informal settlements and the urgency of innovative approaches to urban planning. The concentration of PcD in areas of higher slope in Rocinha is not an isolated phenomenon, but rather a reflection of the socio-spatial and economic dynamics that historically push the most vulnerable populations towards risk-prone and difficult-to-access zones, expressing an uneven geographical development (Ribeiro, 2010; Harvey, 2006).
In this sense, the contribution of the project is broad. From a technical point of view, it validates a replicable pipeline, of low financial cost and independent — or complementary — to complex official databases. From a political standpoint, the project exposes the terrain as a public argument by showing that the spatial inequality of Rocinha is not abstract, for it is measurable, visualizable and communicable. The concept of the morphology of confinement ceases to be a simple rhetorical metaphor and gains strength by becoming geotechnological evidence, supported by data and by a cartographic foundation accessible to public management.
Although global Digital Elevation Models (DEM) offer a valuable database for large-scale analyses, their 30-meter spatial resolution imposes severe limits on capturing urban micro-relief. Thus, a deviation caused by morphological smoothing may occur, especially in hillside areas such as the locality of Laboriaux. Because it is situated on a narrow ridge, the orbital sampling algorithm ends up averaging adjacent peaks and slopes into a single pixel, resulting in underestimated inclinations — in this case, a median of 10% —, which contrast with the local perception of critical slopes. This methodological factor justifies and validates the adoption of the slope spectrum in the data processing engine of this project, acting as a necessary filter to mitigate the digital flattening of the sensor and to bring the model closer to the true physical experience imposed on residents.
5.1 Comparison with vertical mobility experiences and implications for public policies and future research
The need for massive vertical mobility interventions, such as funiculars and urban elevators, emerges as an unavoidable practical alternative. Several global experiences of this nature, such as the Metrocable of Medellín, Colombia, demonstrate the transformative potential of cable transport systems in favelas. In Medellín, the Metrocable not only improved physical connectivity but also acted as a catalyst for social urbanism, integrating marginalized communities into the formal city and reducing violence (Darabi, 2019).
However, the replication of these models is not trivial and requires prior study, respecting the subjectivities of the place. The case of the cable car in Complexo do Alemão, Rio de Janeiro, serves as a relevant counterpoint. Despite the technological similarity to the aforementioned example, the lack of community engagement and the prioritization of large-scale projects to the detriment of basic needs such as sanitation and housing resulted in limited social impact and the eventual deactivation of the system (Santos; Gonçalves, 2017). This outcome conveys that, by itself, technology does not guarantee success, for it must be integrated into a broad strategy of social urbanism. This process demands strong popular participation and alignment with local demands.
Funiculars, following the example of models implemented in favelas of Rio de Janeiro, constitute alternatives for vertical mobility. Although they operate on a smaller scale than cable car systems, these pieces of equipment offer significant gains in accessibility on specific stretches, provided they are integrated into planning that provides for continuous operation and maintenance. As demonstrated by the diversity of the technological pipeline proposed in this study, the effectiveness of social urbanism lies in the coexistence and complementarity of different infrastructures. In this scenario, the developed dashboard acts as a strategic instrument of territorial intelligence, enabling the identification of priority vectors for the installation of such equipment and maximizing the real impact on the autonomy and socio-spatial inclusion of PcD.
The results have the power to support the formulation of public policies. The finding that the slope of Rocinha exceeds the limits of NBR 9050 (ABNT, 2020) demands a revision of accessibility approaches in favelas. It is not enough merely to adapt; it is necessary to transform the basic infrastructure, which implies significant investments in vertical mobility and also in planning that considers topography as a central element.
Furthermore, the use of Open Source geotechnologies and the integration of AI in the analysis and visualization process offer a model for the development of decision-support tools that are accessible, transparent and replicable. It is recommended that future research explore: the collection of PcD data at greater granularity — perhaps through participatory mapping — to refine vulnerability analysis; the integration of other socioeconomic factors into the interactive dashboard; the development of predictive models to identify areas at risk of inaccessibility in other favelas; and the evaluation of the quantitative impact of existing vertical mobility interventions.
5.2 Methodological Limitations
The dependence on APIs for obtaining altimetric data, although a pragmatic solution for the absence of official DTMs, introduces a significant limitation in the resolution of topographic data. Free elevation APIs are based on global Digital Elevation Models (DEMs) that have spatial resolutions ranging from 30 to 90 meters. In dense and complex urban environments such as favelas, characterized by sharp microtopographies, irregular buildings and narrow alleys, this orbital spatial resolution is often insufficient to capture the minutiae of the terrain that directly impact vertical accessibility (Mahabir; Agrawal, 2018).
Although the implementation of radial neighborhood sampling mitigated the single centroid bias, the aggregated scale of analysis presents challenges in heterogeneous territories. Statistical extraction at the sub-neighborhood level, even refined by the filter of maximum slope, allows for the evaluation of the structural trend of the hillside, but does not reach the scale of architectural design. Thus, the modeling does not allow the identification of specific barriers at the microscale, such as steps in alleyways, which are crucial and insurmountable obstacles to the accessibility of PcD.
The native resolution of satellites may mask critical local variations, underestimating or overestimating barriers at very specific points. It is acknowledged that the complex morphology of Rocinha demands, in its final instance, metric or centimetric precision. As an evolution of the project, it is recommended that the methodological architecture incorporate ultra-high-resolution bases, migrating to offline processing of raster matrices. The application of direct zonal statistics on these data would allow the exact calculation of the slope of each stretch of path, definitively mitigating micro-relief distortions without burdening the latency of the web application.
Although slope and altimetry are primary factors, vertical accessibility is a multidimensional concept that goes beyond the macro inclination of the terrain. Other infrastructure elements were not explicitly considered in the current modeling, such as precarious paving, potholes, the width of streets and the absence of handrails. In addition, the current lack of georeferenced microdata on the exact location of the residences of PcD and on the typology of disability — such as wheelchair users or persons with visual impairment — limits the granularity of the vulnerability analysis, with the present results being a portrait of the collective sectoral density.
6 Conclusion
This study demonstrated that the terrain geometry in Rocinha Favela acts as a powerful morphology of confinement due to its morphological complexity, imposing insurmountable barriers to vertical accessibility and deepening the vulnerability of PcD. The morphology of confinement is, therefore, an effect of urban geometry on the right to come and go. By transforming this condition into analytical visualization, the project strengthens the denunciation and offers a basis for fairer public decisions.
In Rocinha, the terrain slope far exceeds normative accessibility standards. The mapping of vertical accessibility reveals that the physical autonomy of PcD depends less on punctual solutions and more on a robust territorial policy, centered on vertical mobility, universal design and a fine reading of the hillside. The main contribution of this work lies in evidencing the overlap between social vulnerability and topographic barrier: when the population with disabilities is concentrated in high and steep areas, the urban form becomes a mechanism of exclusion.
Therefore, this article demonstrates that Open Source geotechnologies can operate as an infrastructure of spatial justice in territories of morphological complexity, complementing conventional diagnoses and official data. From a methodological point of view, the combination of Open-Elevation and OpenTopoData APIs, Python, visualization in PyDeck and open governance shows that it is possible to produce low-cost territorial evidence with high communicative power.
From an academic and political standpoint, the study affirms that accessibility is a matter of urban structure, hillside management and redistribution of the right to the city. The developed interactive dashboard is not merely a data visualization tool, but an instrument of denunciation and a catalyst for urban planning. By rendering visible the invisibility of inaccessibility, it offers technical subsidies so that civil society, public authorities and the communities themselves can formulate and implement evidence-based social urbanism policies.
The physical autonomy and full participation of PcD in the urban life of Rocinha depend on structural, planned and territorialized interventions that recognize topography as a challenge to be overcome through vertical mobility solutions. In this way, it will be possible to build truly inclusive cities, where the geometry of the terrain ceases to be a wall and becomes a path to equity.
As future recommendations, it is desirable that this research evolves into an even more precise planning tool, utilizing resources to overcome methodological limitations, such as the acquisition of high-resolution topographic data via LiDAR (Light Detection and Ranging) or drone photogrammetry with Structure-from-Motion (SfM) techniques (Chun et al., 2021). These technologies enable the generation of DTMs and DSMs with centimetric precision, capable of capturing the microtopography of favelas, including buildings, stairways and small terrain variations.
The analysis should migrate from the sub-neighborhood scale to the scale of the building and the path network. This requires the detailed mapping of these infrastructures, preferably with data collected in the field or through very-high-resolution satellite imagery and computer vision techniques. The use of network analysis algorithms that consider the slope of each street segment, the presence of steps, the width and the type of pavement as attributes of the network would allow tracing optimal routes for different types of mobility and precisely identifying accessibility bottlenecks.
The methodological limitations listed are inherent to the nature of a Proof of Concept and to the complexity of the object of study. However, they do not diminish the value of the research, but point to clear paths for improvement. By adopting higher-resolution topographic data, refining the scale of analysis, engaging the community in data collection and expanding accessibility indicators, future research can be built upon this solid foundation. The aim is to develop increasingly precise tools, capable of supporting social urbanism policies that transform the geometry of the terrain, today marked by a morphology of confinement, into a path for the full inclusion of PcD in informal territories. It is recognized, however, that such interventions are measures for mitigating pre-existing inequalities. The ultimate horizon of public action in these territories must necessarily be the overcoming of the very condition of informality, fully integrating these areas into the structure and rights of the formal city.
References
ALVIM, M. A luta do deficiente morador de favelas. Rio de Janeiro: Viva Favela, [s. d.]. Available at: http://vivafavela.vivario.org.br/408-a-luta-do-deficiente-morador-de-favelas/. Access in: 8 may. 2026.
ARRUDA, N.; YANCES, H. MAP Cartagena: metodología para el mapeo de asentamientos precarios usando OpenStreetMap. Revista Cartográfica, v. 93, 2016.
ASSOCIAÇÃO BRASILEIRA DE NORMAS TÉCNICAS. NBR 9050: acessibilidade a edificações, mobiliário, espaços e equipamentos urbanos. Rio de Janeiro: ABNT, 2020.
BRANDÃO, B.; BUENO, L. Intervenções de mobilidade e acessibilidade em programas de urbanização de favelas: análise em São Paulo e Rio de Janeiro de 1996 a 2012. Arquitetura Revista, [S. l.], 2018.
BURROUGH, P. A.; MCDONNELL, R. A.; LLOYD, C. D. Principles of Geographical Information Systems. 3. ed. Oxford: Oxford University Press, 2015.
CAPIZZI, P.; MARTORANA, R. Analysis of HVSR data using a modified centroid-based algorithm for near-surface geological reconstruction. Geosciences, [s. l.], v. 12, n. 4, p. 147, 2022. Available at: https://www.mdpi.com/2076-3263/12/4/147. Access in: 8 may. 2026.
CARRO, E. Urbanismo social: ferramenta de transformação territorial. ArchDaily Brasil, 20 dez. 2021. Available at: https://www.archdaily.com.br/br/972846/urbanismo-social-ferramenta-de-transformacao-territorial. Access in: 8 maio 2026.
CHAKRABORTY, A. et al. Open data for informal settlements: Toward a user’s guide for urban managers and planners. Journal of Urban Management, [s. l.], v. 4, n. 2, p. 101-114, 2015. Available at: https://www.sciencedirect.com/science/article/pii/S2226585615000229. Access in: 8 maio 2026.
CHUN, J. et al. Comparing High Accuracy t-LiDAR and UAV-SfM Derived Point Clouds for Geomorphological Change Detection. ISPRS International Journal of Geo-Information, [S. l.], v. 10, n. 6, p. 367, jun. 2021. Available at: https://www.mdpi.com/2220-9964/10/6/367. Access in: 23 may. 2024.
DARABI, A. In Medellin, Cable Cars Transformed Slums—In Rio, They Made Them Worse. [S. l.]: IISD, 11 abr. 2019. Available at: https://www.iisd.org/articles/policy-analysis/medellin-cable-cars-transformed-slums-rio-they-made-them-worse. Access in: 8 may. 2026.
FLACKE, J.; HOEFSLOOT, F.; PFEFFER, K. Co-designing and mapping for accessible cities: a cross-disability project in Zwolle, The Netherlands. The 18th International Conference on Computational Urban Planning and Urban Management. Proceedings. [S. l.: s. n.], 2023.
GLEESON, Brendan. Geographies of disability. London: Routledge, 1999.
G1 RIO. Rocinha, maior favela do país segundo Censo 2022, possui mais habitantes que dois terços dos municípios do RJ. Rio de Janeiro, 8 nov. 2024. Available at: https://g1.globo.com/rj/rio-de-janeiro/noticia/2024/11/08/rocinha-maior-favela-do-pais-segundo-censo-possui-mais-habitantes-que-municipios-do-rj.ghtml. Access in: 8 may. 2026.
GRIPPA, T. et al. Mapping slums and model population density using earth observation data and open source solutions. 2019 Joint Urban Remote Sensing Event (JURSE), Vannes, France, 2019. doi: 10.1109/JURSE.2019.8808934.
HARVEY, David. Os limites do capital. Tradução de Magda Lopes. São Paulo: Boitempo, 2006. Acesso em: 8 maio 2026.
INSTITUTO BRASILEIRO DE GEOGRAFIA E ESTATÍSTICA (IBGE). Censo 2022: Brasil tinha 16,4 milhões de pessoas morando em Favelas e Comunidades Urbanas. Rio de Janeiro: Agência de Notícias IBGE, 8 nov. 2024. Available at: https://agenciadenoticias.ibge.gov.br/agencia-noticias/2012-agencia-de-noticias/noticias/41797-censo-2022-brasil-tinha-16-4-milhoes-de-pessoas-morando-em-favelas-e-comunidades-urbanas. Access in: 8 may. 2026.
IZAGA, F.; PEREIRA, M. A mobilidade urbana na urbanização das favelas no Rio de Janeiro. Cadernos do Desenvolvimento Fluminense, Rio de Janeiro, n. 4, 2014.
MAHABIR, R.; AGRAWAL, S. A Critical Review of High and Very High-Resolution Satellite Imagery for Slum Mapping. Remote Sensing, [s. l.], v. 10, n. 1, p. 8, 2018. Available at: https://www.mdpi.com/2413-8851/2/1/8. Access in: 8 may. 2026.
MIRRI, S. et al. On combining crowdsourcing, sensing and open data for an accessible smart city. Eighth International Conference on Next Generation Mobile Apps, Services and Technologies, Oxford, UK, 2014, pp. 294-299, doi: 10.1109/NGMAST.2014.59..
OPEN-ELEVATION. A free and open-source elevation API. 2024. Available at: https://open-elevation.com/. Access in: 8 may. 2026.
OWEN, K. K.; WONG, D. W. An approach to differentiate informal settlements using spectral, texture, geomorphology and road accessibility metrics. Applied Geography, [s. l.], v. 40, p. 101-112, 2013. Available at: https://www.sciencedirect.com/science/article/pii/S0143622812001592. Access in: 8 may. 2026.
PRANDI, C.; SALOMONI, P.; MIRRI, S. mPASS: integrating people sensing and crowdsourcing to map urban accessibility. Proceedings of the IEEE International Conference on Consumer Communications and Networking Conference. 10-13.[S. l.], 2014.
PONTIFÍCIA UNIVERSIDADE CATÓLICA DO RIO DE JANEIRO (PUC-Rio). Projeto UNIR: Sistema de Informações Geográficas para Apoio ao Urbanismo Social. Rio de Janeiro: CCS/PUC-Rio, 2025. Available at: https://sigaunir.ccs.puc-rio.br/index.php?option=com_sppagebuilder&view=page&id=142. Access in: 8 may. 2026.
RIBEIRO, W. C. Riscos e vulnerabilidade urbana no Brasil. Scripta Nova, Barcelona, v. 14, n. 341, nov. 2010.
RIOONWATCH. Mapping the 'Uncharted' Favela: The Growing Role of Participatory Mapping. 2017. Available at: https://rioonwatch.org/?p=38456. Access in: 8 may. 2026.
ROCHA, E. Análise da acessibilidade ao espaço urbano por pessoa em cadeira de rodas empregando tecnologias da geoinformação. Dissertação (Mestrado) – Universidade Federal de Pernambuco. CTG. Programa de Pós-graduação em Ciências Geodésicas e Tecnologias da Geoinformação, 2016.
RODRIGUES, A. et al. Measuring mobility inequalities of favela residents based on mobile phone data. Habitat International, v. 110, 2021, ISSN 0197-3975, https://doi.org/10.1016/j.habitatint.2021.102346., 2021.
RUÍZ, A.; TEMES-CÓRDOVEZ, R. R.; CÁMARA-MENOYO, C. Accesibilidad y tecnologías de información colaborativas. Cartografías para una ciudad inclusiva. Bitácora Urbano Territorial, [S. l.], v. 28, n. 1, p. 171–178, 2018. DOI: 10.15446/bitacora.v28n1.68316.
SANTOS, L. B. D.; GONÇALVES, R. S. A questão da mobilidade nos projetos de urbanização: o teleférico como modal de transporte nas favelas. Escenarios: empresa y territorio, [s. l.], n. 11, p. 101-115, 2017. Acesso em: 8 maio 2026.
SANTOS, Milton. A Natureza do Espaço: Técnica e Tempo, Razão e Emoção. São Paulo: Hucitec, 1996.
STORYMAPS ARCGIS. Comparing the spatial accuracy of LiDAR to Digital Elevation. 2019. Available at: https://storymaps.arcgis.com/stories/60ea9bed675e4157b2952021e2a41453. Access in: 8 may. 2026.
About the Authors
Alberto Martins Barros is a geographer, holds a master's degree and is a doctoral candidate in Biosystems Engineering at UFF. A specialist in Health Surveillance with an MBA in Project Management, he dedicates his career to the intersection between geographic data science and the territory. He has experience in the development of spatial data ETL and decision-support tools for complex urban contexts. He is currently specializing in the integration of open-source ecosystems (such as Google Earth Engine, Python, R, PostgreSQL/PostGIS and GeoServer) for geospatial modeling applied to territorial vulnerabilities, with a focus on the democratization of geographic data intelligence.
Deise dos Santos Faustino holds a degree in Cartographic Engineering from UERJ, postgraduate qualifications in Oil and Gas and Public Health, and training in Field Epidemiology through the EpiSUS Program. She has solid experience in the management and analysis of geographic databases applied to urban planning, energy and public health.
Luan da Silva Costa is a geographer from PUC-Rio and a specialist in Information Systems, Monitoring and Public Health Analysis from Fiocruz. He works as a Geoprocessing Analyst at the Municipal Health Department of Rio de Janeiro. He develops work in the areas of geoprocessing applied to health, spatial epidemiology and geographic data analysis.
William Cosme de Souza Bannitz is a geographer graduated from PUC-Rio. He has training in field epidemiology through EpiSUS Fundamental and develops work in the areas of geoprocessing applied to health, epidemiology and geospatial data analysis. He routinely uses an ecosystem that integrates geoprocessing tools, applying Python and Artificial Intelligence in process automation.
Authors Contributions
Conceptualization, [A.M.B]; methodology, [A.M.B]; software, [A.M.B]; validation, [A.M.B]; formal analysis, [A.M.B]; investigation, [A.M.B; W.C.S.B]; resources, [A.M.B]; data curation, [A.M.B; W.C.S.B]; writing—original draft preparation, [A.M.B]; writing—review and editing, [A.M.B]; visualization, [A.M.B; D.S.F; L.S.C; W.C.S.B]; supervision, [A.M.B]; project administration, [A.M.B]; funding acquisition, [A.M.B]. All authors have read and agreed to the published version of the manuscript.
Data Availability
The geospatial data and the processed results for this research can be explored through the interactive dashboard available at: Vertical Accessibility Dashboard: Rocinha. (https://pcdrocinha.streamlit.app/)
Acknowledgments
The authors acknowledge the contributions of the UNIR Project (PUC-Rio) for consolidating a platform that functions as a data repository for Rocinha, which was essential for the development of this research.
Conflicts of Interest
The author declares no conflict of interest.
About Coleção Estudos Cariocas
Coleção Estudos Cariocas (ISSN 1984-7203) is a publication dedicated to studies and research on the Municipality of Rio de Janeiro, affiliated with the Pereira Passos Institute (IPP) of the Rio de Janeiro City Hall.
Its objective is to disseminate technical and scientific production on topics related to the city of Rio de Janeiro, as well as its metropolitan connections and its role in regional, national, and international contexts. The collection is open to all researchers (whether municipal employees or not) and covers a wide range of fields — provided they partially or fully address the spatial scope of the city of Rio de Janeiro.
Articles must also align with the Institute’s objectives, which are:
- to promote and coordinate public intervention in the city’s urban space;
- to provide and integrate the activities of the city’s geographic, cartographic, monographic, and statistical information systems;
- to support the establishment of basic guidelines for the city’s socioeconomic development.
Special emphasis will be given to the articulation of the articles with the city's economic development proposal. Thus, it is expected that the multidisciplinary articles submitted to the journal will address the urban development needs of Rio de Janeiro.